. 2019 Apr 4;10(1):1530.
doi: 10.1038/s41467-019-09470-w.

A NOTCH feed-forward loop drives reprogramming from adrenergic to mesenchymal state in neuroblastoma

Affiliations

A NOTCH feed-forward loop drives reprogramming from adrenergic to mesenchymal state in neuroblastoma

Tim van Groningen et al. Nat Commun. .

Abstract

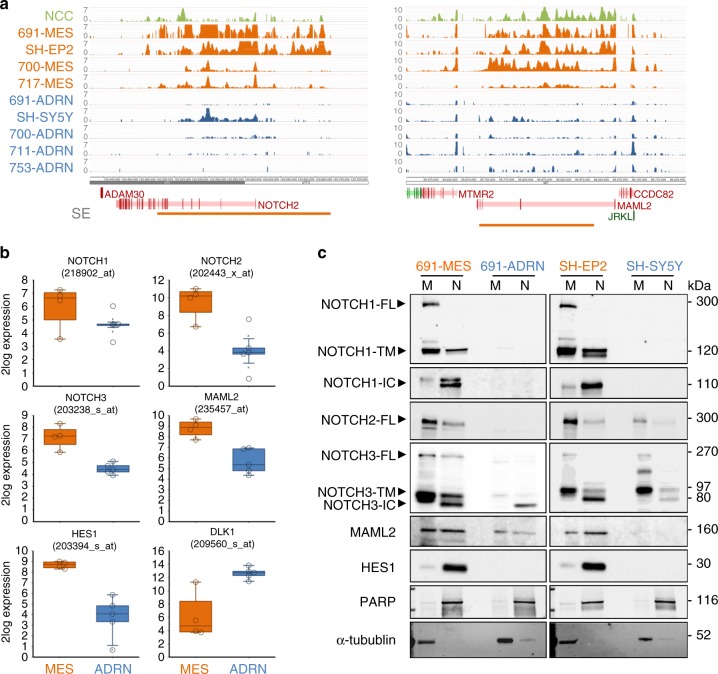
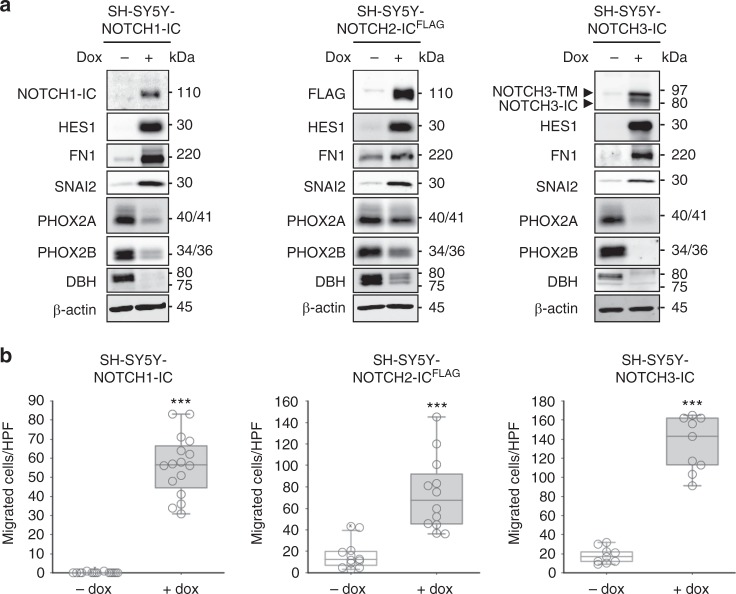
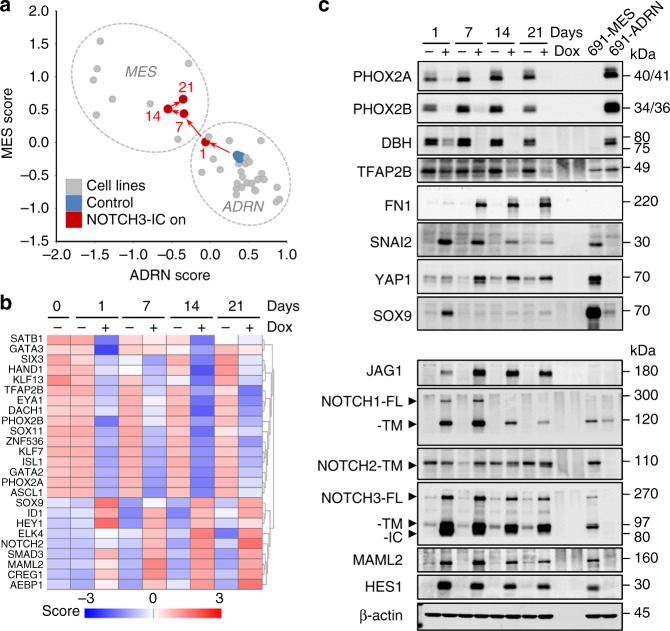
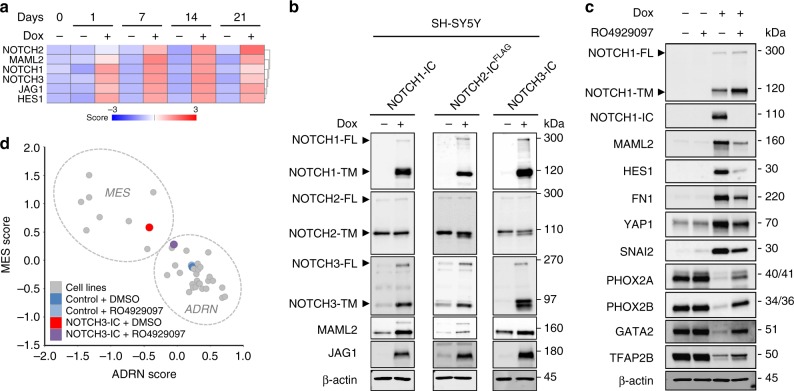
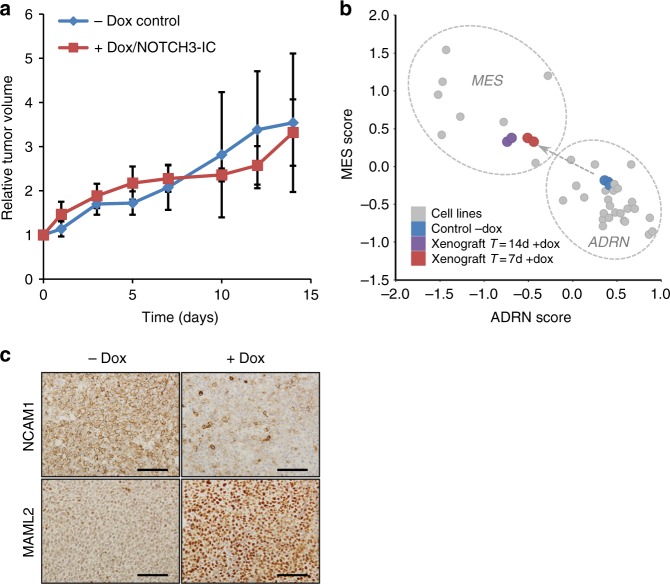
Transition between differentiation states in development occurs swift but the mechanisms leading to epigenetic and transcriptional reprogramming are poorly understood. The pediatric cancer neuroblastoma includes adrenergic (ADRN) and mesenchymal (MES) tumor cell types, which differ in phenotype, super-enhancers (SEs) and core regulatory circuitries. These cell types can spontaneously interconvert, but the mechanism remains largely unknown. Here, we unravel how a NOTCH3 intracellular domain reprogrammed the ADRN transcriptional landscape towards a MES state. A transcriptional feed-forward circuitry of NOTCH-family transcription factors amplifies the NOTCH signaling levels, explaining the swift transition between two semi-stable cellular states. This transition induces genome-wide remodeling of the H3K27ac landscape and a switch from ADRN SEs to MES SEs. Once established, the NOTCH feed-forward loop maintains the induced MES state. In vivo reprogramming of ADRN cells shows that MES and ADRN cells are equally oncogenic. Our results elucidate a swift transdifferentiation between two semi-stable epigenetic cellular states.


Conflict of interest statement

The authors declare no competing interests.

Figures

Fig. 1
Fig. 1
The core regulatory circuitry of MES cells includes transcription and activation of the NOTCH pathway. a ChIP-sequencing profiles of H3K27ac mark in neural crest cells (NCC, in green), MES neuroblastoma cells (691-MES, SH-EP2, 700-MES, 717-MES, in orange) or ADRN neuroblastoma cells (691-ADRN, SH-SY5Y, 700-ADRN, 711-ADRN, 753-ADRN, in blue). The number of reads per 20 million mapped reads is shown on the y-axis. Chromosomal gene position is shown on the x-axis. Super-enhancers (SE) are indicated by horizontal bars. Gene color depicts orientation on sense (green) and anti-sense (red) DNA strands. b Box plots of mRNA expression for the four MES cell lines and five ADRN cell lines shown in panel a. Whiskers denote the interval within 1.5 times the interquartile range (box edges) of the median (center line). Expression values (2log-transformed) for each cell line are indicated by open circles. Affymetrix mRNA probesets are indicated for each gene. c Western blot analysis of NOTCH1, NOTCH2, NOTCH3, the NOTCH co-factor MAML2 and the NOTCH target gene HES1 in membrane (M) or nuclear (N) lysates. Protein lysates were from MES- and ADRN cell line pairs of isogenic origin, depicted in orange and blue, respectively. IC intracellular domain, FL full-length, TM transmembrane. PARP and α-tubulin were used as loading controls for the nuclear- and membrane fractions, respectively. Source data are provided as a Source Data file
Fig. 2
Fig. 2
NOTCH paralogues induce a mesenchymal phenotype in ADRN neuroblastoma cells. a Western blot analysis of cell lysates of SH-SY5Y with inducible overexpression of NOTCH1-IC, NOTCH2-ICFLAG or NOTCH3-IC. Immunoblots show NOTCH1-IC, NOTCH2-ICFLAG or NOTCH3 proteins as well as protein of the known NOTCH target gene HES1 to confirm induction of each transgene. Lysates are analyzed for MES-markers (FN1 and SNAI2) and ADRN-markers (PHOX2A, PHOX2B, and DBH). β-actin was used as loading control. IC intracellular domain, TM transmembrane domain, dox doxycycline. Source data are provided as a Source Data file. b Transwell migration assay of SH-SY5Y cells with inducible overexpression of NOTCH1-IC, NOTCH2-ICFLAG or NOTCH3-IC. Cells were allowed to migrate for 48 h. dox, doxycycline. Box plots show the number of migrated cells per High-Power Field (HPF). Whiskers denote the interval within 1.5 times the interquartile range (box edges) of the median (center line). Two-sided Student’s t-test assuming equal variance was used to calculate statistical difference, ***p < 0.001. Source data are provided as a Source Data file
Fig. 3
Fig. 3
NOTCH3-IC is a master regulator of ADRN-to-MES reprogramming a. Analysis of mRNA signature scores for MES and ADRN cells in a panel of neuroblastoma cell lines and a time series of NOTCH3-IC induction. Control (-dox) SH-SY5Y-NOTCH3-IC cells are depicted in blue; SH-SY5Y cells with induction of NOTCH3-IC (+dox) are shown in red. Time of NOTCH3-IC induction is indicated in days. Dashed circles group cell lines of MES- or ADRN-type as previously determined. b Z-score mRNA expression of core super-enhancer associated transcription factors specific for ADRN or MES cells. Time of NOTCH3-IC induction (in days) is indicated above. dox, doxycycline. c Western blot analysis showing proteins of ADRN-markers (PHOX2A, PHOX2B, DBH, and TFAP2B), MES-markers (FN1, SNAI2, YAP1, and SOX9) and members of the NOTCH pathway (JAG1, NOTCH1, NOTCH2, NOTCH3, MAML2, and HES1) in SH-SY5Y with inducible overexpression of NOTCH3-IC. Time of NOTCH3-IC induction is indicated above the western blots. Protein lysates from 691-MES and 691-ADRN cells are loaded on the same blot as a reference for MES and ADRN states, respectively. β-actin was used as loading control. dox, doxycycline. Source data are provided as a Source Data file
Fig. 4
Fig. 4
NOTCH3-IC induces epigenetic remodeling of super-enhancer landscapes. a Analysis of H3K27ac marked super-enhancer regions (n = 1662) that were previously shown to be associated with MES or ADRN cells in neuroblastoma. Shown are changes of H3K27ac signal in SH-SY5Y cells with induced expression of NOTCH3-IC (T = 7 days of induction). Red (increased) or blue (decreased) H3K27ac signal of the super-enhancers is depicted by horizontal bars on the genomic regions. Expanded views show the super-enhancer (SE) regions that distinguish MES and ADRN lines (indicated by orange and blue vertical bars, respectively) (right). b, c H3K27ac profiles in SH-EP2, SH-SY5Y and in SH-SY5Y cells with (NOTCH3-IC on) or without (NOTCH3-IC off) 7 days of doxycycline-induced expression of NOTCH3-IC. Shown are examples of b ADRN-specific SE-associated TF genes (ASCL1, PHOX2A) and ADRN lineage genes (DBH, DDC). In c, examples of MES-specific SE-associated TF genes (SMAD3, ELK4, NOTCH2, MAML2) are shown. SEs associated with ADRN- and MES cells are indicated by blue and orange horizontal bars, respectively. Gene color depicts orientation on sense (green) and anti-sense (red) DNA strands. d. Motif analysis on regions with increased H3K27ac signal. Statistical significance of enrichment was calculated using Fisher’s exact test with Bonferroni correction
Fig. 5
Fig. 5
NOTCH-IC paralogues induce a reciprocal feed-forward signaling cascade. a SH-SY5Y cells with inducible overexpression of NOTCH3-IC were profiled for gene expression up to 21 days. Z-scores of mRNA expression values are shown for JAG1, NOTCH1, NOTCH2, NOTCH3, MAML2, and HES1. The transcription of NOTCH receptors from endogenous loci is measured using probesets located in the 3′UTRs of NOTCH1 (probeset 218902_at), NOTCH2 (probeset 202443_x_at) and NOTCH3 (probeset 203238_s_at). Notably, the 3′UTR is absent in the NOTCH3-IC transgene. b. Western blot analysis of NOTCH1, NOTCH2, NOTCH3, MAML2, and JAGGED1 proteins in SH-SY5Y with NOTCH1-IC, NOTCH2-ICFLAG or NOTCH3-IC inducible overexpression. β-actin was used as loading control. Time of induction was 96 h. Source data are provided as a Source Data file. c Western blot analysis of SH-SY5Y cells with (+dox) or without (−dox) NOTCH3-IC expression that were cultured in the presence (+) or the absence (−) of the gamma-secretase inhibitor RO4929097. Protein lysates were analyzed for NOTCH pathway genes (NOTCH1, MAML2, HES1), MES markers (FN1, YAP1, SNAI2) and ADRN markers (PHOX2A, PHOX2B, GATA2, TFAP2B). β-actin was used as loading control. dox, doxycycline. Source data are provided as a Source Data file. d Analysis of MES and ADRN mRNA signature scores in SH-SY5Y cells with NOTCH3-IC induction that were treated with the gamma-secretase inhibitor RO4929097. Control cells (-dox) treated with DMSO or RO4929097 are shown in dark- and light blue, respectively. NOTCH3-IC expressing cells with DMSO or RO4929097 are shown in red and purple, respectively. Cells were induced with doxycycline and treated with RO4929097 for 14 days. Dashed circles indicate groups of MES- or ADRN-type cell lines as previously determined
Fig. 6
Fig. 6
A transient phase of NOTCH3-IC expression induces commitment to a MES phenotype. a Western blot analysis of transient NOTCH3-IC induction. Time of doxycycline (dox) induction is indicated above the blots. Induction was followed by doxycycline wash-out and all samples were harvested after T = 14 days. Immunoblots show NOTCH pathway proteins (JAG1, NOTCH1, and NOTCH3), MES-markers (FN1 and YAP1) and ADRN-markers (PHOX2A, PHOX2B, DBH, and GATA2). As a positive reference, a sample of continued NOTCH3-IC induction for T = 14 days was run on the same gel (right). β-actin was used as loading control. Source data are provided as a Source Data file. b Summed z-scores of mRNA signatures for MES and ADRN genesets. Non-induced control (−dox) cells are shown in dark blue. Persistent NOTCH3-IC induction of T = 7 and 14 days are shown in pink and red, respectively. A transient phase of NOTCH3-IC induction (T = 7 days + doxycycline, followed by T = 7 days - doxycycline wash-out) is shown in light blue. As a reference, various neuroblastoma cell lines are shown in gray dots and grouped by dashed lines according to MES and ADRN phenotypes (see ref. ). c, d mRNA analysis (z-score of expression) of C) NOTCH pathway genes and D) core transcription factors of MES and ADRN lineages. + and—indicate culture conditions with or without doxycycline, respectively. Time of doxycycline treatment is indicated in days. For color-coding of samples, see panel c
Fig. 7
Fig. 7
Induction of ADRN-to-MES reprogramming is tumorigenic in vivo. a Growth of SH-SY5Y-NOTCH3-IC xenograft with (+dox, red) or without (−dox, blue) doxycycline in the drinking water. Error bars represent standard deviation. Y-axis shows relative tumor growth; x-axis depicts time in days. Source data are provided as a Source Data file. b mRNA analysis of ADRN and MES signature scores of SH-SY5Y-NOTCH3-IC xenograft tumors with induction of NOTCH3-IC. Non-induced control tumors (n = 4) are depicted in blue, tumors with 7 or 14 days NOTCH3-IC expression (n = 4) are shown in red and purple, respectively. Dashed lines group various neuroblastoma cell lines (gray dots) according to MES and ADRN phenotypes for reference (see ref. ). c Immunohistochemistry of NCAM1 and MAML2 on tumors with (+dox) or without (−dox) 7 days of NOTCH3-IC induction. dox, doxycycline. Scale bar, 100 µM

References

    1. van Groningen T, et al. Neuroblastoma is composed of two super-enhancer-associated differentiation states. Nat. Genet. 2017;49:1261–1266. doi: 10.1038/ng.3899. - DOI - PubMed
    1. Boeva V, et al. Heterogeneity of neuroblastoma cell identity defined by transcriptional circuitries. Nat. Genet. 2017;49:1408–1413. doi: 10.1038/ng.3921. - DOI - PubMed
    1. Patel AP, et al. Single-cell RNA-seq highlights intratumoral heterogeneity in primary glioblastoma. Science. 2014;344:1396–1401. doi: 10.1126/science.1254257. - DOI - PMC - PubMed
    1. Tirosh I, et al. Dissecting the multicellular ecosystem of metastatic melanoma by single-cell RNA-seq. Science. 2016;352:189–196. doi: 10.1126/science.aad0501. - DOI - PMC - PubMed
    1. Tirosh I, et al. Single-cell RNA-seq supports a developmental hierarchy in human oligodendroglioma. Nature. 2016;539:309–313. doi: 10.1038/nature20123. - DOI - PMC - PubMed

Publication types

MeSH terms