. 2019 Mar 20:13:221.
doi: 10.3389/fnins.2019.00221. eCollection 2019.

Graph Theoretical Characteristics of EEG-Based Functional Brain Networks in Patients With Epilepsy: The Effect of Reference Choice and Volume Conduction

Affiliations

Graph Theoretical Characteristics of EEG-Based Functional Brain Networks in Patients With Epilepsy: The Effect of Reference Choice and Volume Conduction

Maria N Anastasiadou et al. Front Neurosci. .

Abstract

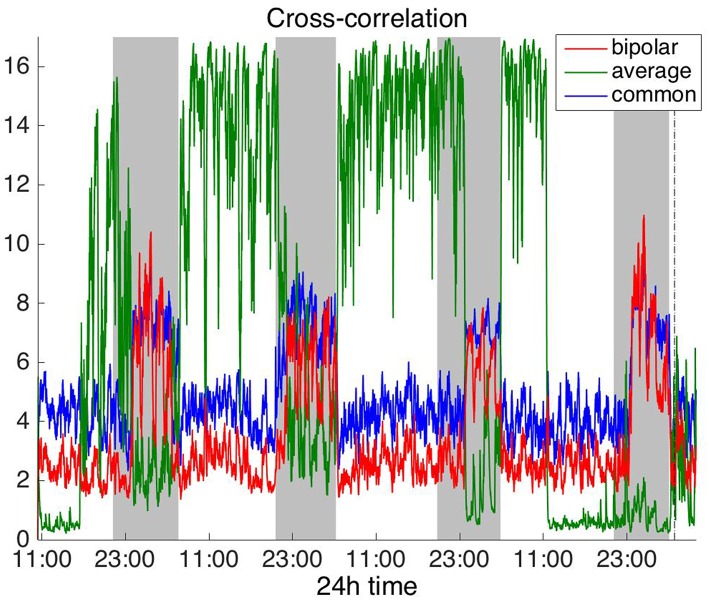
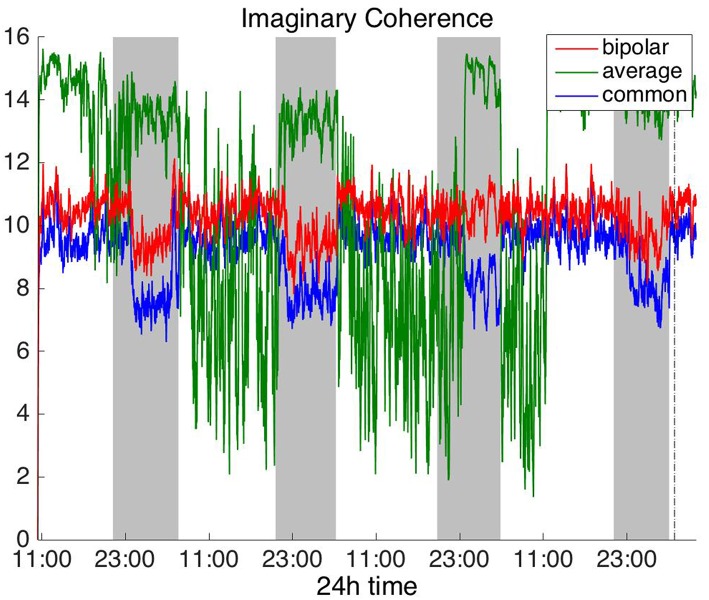
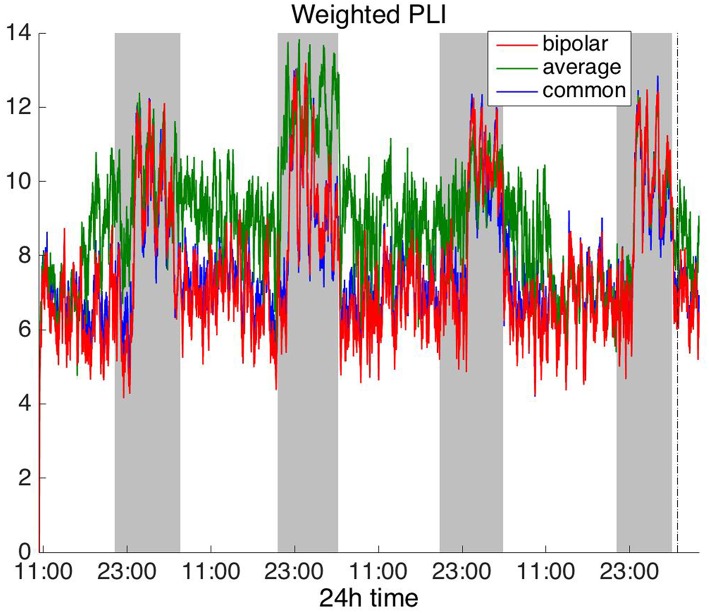
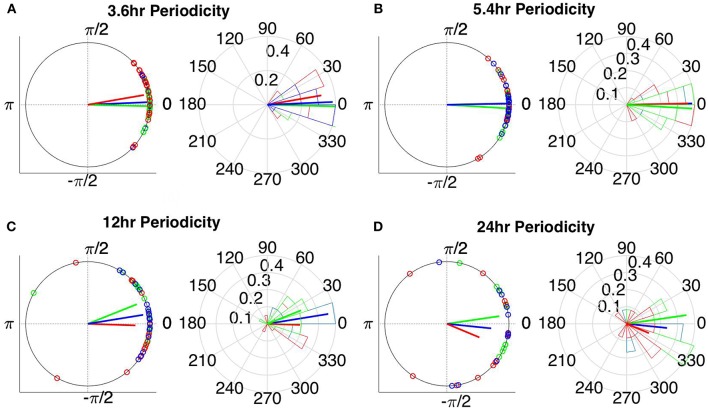
It is well-established that both volume conduction and the choice of recording reference (montage) affect the correlation measures obtained from scalp EEG, both in the time and frequency domains. As a result, a number of correlation measures have been proposed aiming to reduce these effects. In our previous work, we have showed that scalp-EEG based functional brain networks in patients with epilepsy exhibit clear periodic patterns at different time scales and that these patterns are strongly correlated to seizure onset, particularly at shorter time scales (around 3 and 5 h), which has important clinical implications. In the present work, we use the same long-duration clinical scalp EEG data (multiple days) to investigate the extent to which the aforementioned results are affected by the choice of reference choice and correlation measure, by considering several widely used montages as well as correlation metrics that are differentially sensitive to the effects of volume conduction. Specifically, we compare two standard and commonly used linear correlation measures, cross-correlation in the time domain, and coherence in the frequency domain, with measures that account for zero-lag correlations: corrected cross-correlation, imaginary coherence, phase lag index, and weighted phase lag index. We show that the graphs constructed with corrected cross-correlation and WPLI are more stable across different choices of reference. Also, we demonstrate that all the examined correlation measures revealed similar periodic patterns in the obtained graph measures when the bipolar and common reference (Cz) montage were used. This includes circadian-related periodicities (e.g., a clear increase in connectivity during sleep periods as compared to awake periods), as well as periodicities at shorter time scales (around 3 and 5 h). On the other hand, these results were affected to a large degree when the average reference montage was used in combination with standard cross-correlation, coherence, imaginary coherence, and PLI, which is likely due to the low number of electrodes and inadequate electrode coverage of the scalp. Finally, we demonstrate that the correlation between seizure onset and the brain network periodicities is preserved when corrected cross-correlation and WPLI were used for all the examined montages. This suggests that, even in the standard clinical setting of EEG recording in epilepsy where only a limited number of scalp EEG measurements are available, graph-theoretic quantification of periodic patterns using appropriate montage, and correlation measures corrected for volume conduction provides useful insights into seizure onset.

Keywords: epilepsy; graph theory; montage; periodicities; scalp EEG; volume conduction.


Figures

Figure 1
Figure 1
Smoothed average degree of the functional brain network of Patient 4, constructed using cross-correlation, for various thresholds. For all thresholds, the 24 h period is visible and the resulting patterns are similar, although details for some intermediate periodicities may be lost.
Figure 2
Figure 2
Average degree of the functional brain networks of Patient 4 as a function of time, using cross correlation for assessing pairwise correlations. The vertical dashed line indicates seizure onset and the gray bars indicate sleep intervals. Cross correlation yields an opposite 24 h periodic pattern when using the average reference. However, we can clearly observe a periodic pattern with a main period equal to around 24 h for all montages.
Figure 3
Figure 3
Average degree of the functional brain networks of Patient 4 as a function of time, using corrected cross correlation for assessing pairwise correlations. The vertical dashed line indicates seizure onset and the gray bars indicate sleep intervals. In contrast to cross correlation (Figure 2), corrected cross correlation yields the same 24 h periodic pattern for all montages.
Figure 4
Figure 4
Average degree of the functional brain networks of Patient 4 as a function of time (broadband signal), using coherence for assessing pairwise correlations. The vertical dashed line indicates seizure onset and the gray bars indicate sleep intervals. Similarly to correlation (Figure 2), coherence yields an opposite 24 h periodic pattern when using the average reference.
Figure 5
Figure 5
Average degree of the functional brain networks of Patient 4 as a function of time (broadband signal), using imaginary coherence for assessing pairwise correlations. The vertical dashed line indicates seizure onset and the gray bars indicate sleep intervals. Similarly to correlation (Figure 2) and coherence (Figure 4), imaginary coherence yields an opposite 24 h periodic pattern when using the average reference.
Figure 6
Figure 6
Average degree of the functional brain networks of Patient 4 as a function of time (broadband signal), using PLI for assessing pairwise correlations. The vertical dashed line indicates seizure onset and the gray bars indicate sleep intervals. PLI yields a different 24 h periodic pattern when using the average reference.
Figure 7
Figure 7
Average degree of the functional brain networks of Patient 4 as a function of time (broadband signal), using WPLI for assessing pairwise correlations. The vertical dashed line indicates seizure onset and the gray bars indicate sleep intervals. Similarly to corrected cross-correlation (Figure 3), WPLI yields the same 24 h periodic pattern for all montages.
Figure 8
Figure 8
Lomb-Scargle periodogram of the average degree of the functional brain network of Patient 4 using cross-correlation, corrected cross-correlation, coherence, imaginary coherence, PLI, and WPLI for common reference (blue line) and bipolar montage (red line). The dotted horizontal lines denote the statistical significance level (p = 0.05). The arrows in the inset figures denote the periods around 3.6 and 5.4 h, which were identified across all subjects along with the peaks around 12 and 24 h. Corrected cross correlation and WPLI were affected less by reference choice.
Figure 9
Figure 9
Instantaneous phases of the network average degree at seizure onset for the (A) 3.6 h, (B) 5.4 h, (C) 12 h, and (D) 24 h periodicities of all patients for corrected cross correlation. The left panels present the unit circle and the phases as points for all seizures from all patients. The right panels show the angular histogram of the distribution as well as the corresponding probability values. Blue, common reference (Cz); green, average reference; red, bipolar reference.
Figure 10
Figure 10
Instantaneous phases of the network average degree at seizure onset for the (A) 3.6 h, (B) 5.4 h, (C) 12 h, and (D) 24 h periodicities of all patients for WPLI. The left panels present the unit circle and the phases as points for all seizures from all patients. The right panels show the angular histogram of the distribution as well as the corresponding probability values. Blue, common reference (Cz); green, average reference; red, bipolar reference.

References

    1. Anastasiadou M., Hadjipapas A., Christodoulakis M., Papathanasiou E. S., Papacostas S. S., Mitsis G. D. (2016). Epileptic seizure onset correlates with long term eeg functional brain network properties*, in 2016 IEEE 38th Annual International Conference of the Engineering in Medicine and Biology Society (EMBC) (Orlando, FL: ), 2822–2825. 10.1109/EMBC.2016.7591317 - DOI - PubMed
    1. Baud M. O., Kleen J. K., Mirro E. A., Andrechak J. C., King-Stephens D., Chang E. F., et al. . (2018). Multi-day rhythms modulate seizure risk in epilepsy. Nat. Commun. 9:88. 10.1038/s41467-017-02577-y - DOI - PMC - PubMed
    1. Berens P. (2009). CircStat : a MATLAB toolbox for circular statistics. J. Stat. Softw. 31, 1–21. 10.18637/jss.v031.i10 - DOI
    1. Burns S. P., Santaniello S., Yaffe R. B., Jouny C. C., Crone N. E., Bergey G. K., et al. . (2014). Network dynamics of the brain and influence of the epileptic seizure onset zone. Proc. Natl. Acad. Sci. U.S.A. 111, E5321–5330. 10.1073/pnas.1401752111 - DOI - PMC - PubMed
    1. Chella F., Pizzella V., Zappasodi F., Marzetti L. (2016). Impact of the reference choice on scalp EEG connectivity estimation. J. Neural Eng. 13:36016. 10.1088/1741-2560/13/3/036016 - DOI - PubMed