. 2019 Mar 21:10:552.
doi: 10.3389/fmicb.2019.00552. eCollection 2019.

Within-Species Genomic Variation and Variable Patterns of Recombination in the Tetracycline Producer Streptomyces rimosus

Affiliations

Within-Species Genomic Variation and Variable Patterns of Recombination in the Tetracycline Producer Streptomyces rimosus

Cooper J Park et al. Front Microbiol. .

Abstract

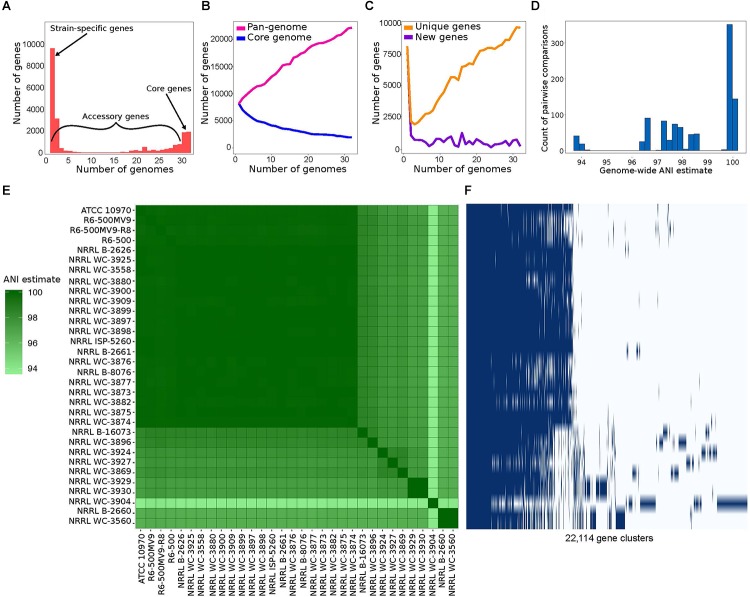
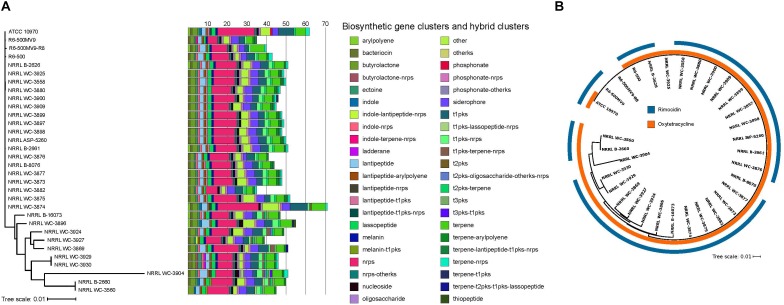
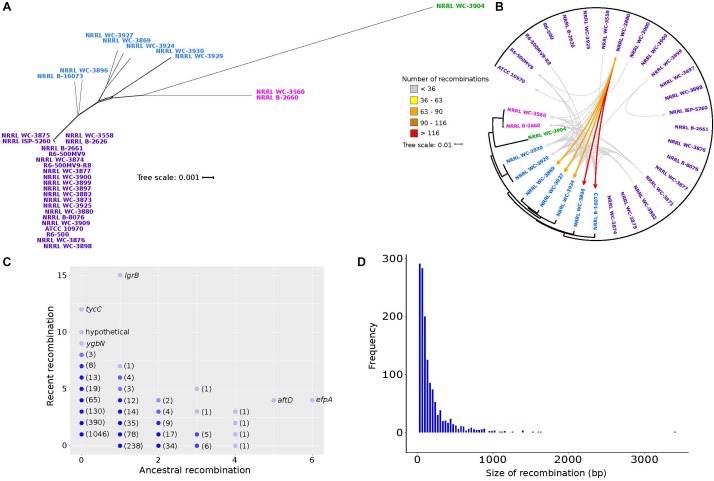
Streptomyces rimosus is best known as the primary source of the tetracycline class of antibiotics, most notably oxytetracycline, which have been widely used against many gram-positive and gram-negative pathogens and protozoan parasites. However, despite the medical and agricultural importance of S. rimosus, little is known of its evolutionary history and genome dynamics. In this study, we aim to elucidate the pan-genome characteristics and phylogenetic relationships of 32 S. rimosus genomes. The S. rimosus pan-genome contains more than 22,000 orthologous gene clusters, and approximately 8.8% of these genes constitutes the core genome. A large part of the accessory genome is composed of 9,646 strain-specific genes. S. rimosus exhibits an open pan-genome (decay parameter α = 0.83) and high gene diversity between strains (genomic fluidity φ = 0.12). We also observed strain-level variation in the distribution and abundance of biosynthetic gene clusters (BGCs) and that each individual S. rimosus genome has a unique repertoire of BGCs. Lastly, we observed variation in recombination, with some strains donating or receiving DNA more often than others, strains that tend to frequently recombine with specific partners, genes that often experience recombination more than others, and variable sizes of recombined DNA sequences. We conclude that the high levels of inter-strain genomic variation in S. rimosus is partly explained by differences in recombination among strains. These results have important implications on current efforts for natural drug discovery, the ecological role of strain-level variation in microbial populations, and addressing the fundamental question of why microbes have pan-genomes.

Keywords: Streptomyces; accessory genome; biosynthetic gene cluster; core genome; pan-genome; recombination; tetracycline.


Figures

Figure 1
Figure 1
Pan-genome analysis of 32 Streptomyces rimosus strains. (A) The number of unique genes that are shared by any given number of genomes or unique to a single genome. Numerical values for each gene category are shown in Supplementary Table S2. (B) The size of the core genome, i.e., genes that are present in at least 31 of the 32 strains (blue line) and pan-genome, i.e., the totality of unique genes present in the population (pink line) in relation to numbers of genomes compared. The list of core genes is listed in Supplementary Table S3. (C) The number of unique genes, i.e., genes unique to individual strains (yellow line) and new genes, i.e., genes not found in the previously compared genomes (purple line) in relation to numbers of genomes compared. (D) Distribution of pairwise average nucleotide identity (ANI) values. ANI calculates the average nucleotide identity of all orthologous genes shared between any two genomes. The 95% ANI cutoff is a frequently used standard for species demarcation. (E) Pairwise whole genome ANI comparison. Percentage values are shown in Supplementary Table S4. (F) Gene presence-absence matrix showing the distribution of genes present in a genome. Each row corresponds to a strain in panel E. Each column represents an orthologous gene family. Dark blue blocks represent the presence of a gene, while light blue blocks represent the absence of a gene.
Figure 2
Figure 2
Distribution of BGCs per genome. (A) BGCs and hybrid clusters were identified using antiSMASH. The maximum likelihood phylogenetic tree was reconstructed using concatenated alignments of 1,945 core genes. Scale bar of phylogenetic tree represents nucleotide substitutions per site. Acronyms: nrps, non-ribosomal peptide synthase; t1pks, type 1 polyketide synthase; t2pks, type II polyketide synthase; t3pks, type III polyketide synthase; ks, ketosynthase. (B) Phylogenetic distribution of the oxytetracycline and rimocidin BGCs. Colored rings outside the tree show the presence/absence of BGCs known to encode for oxytetracycline and rimocidin. The two BGCs were identified by searching all the genomes for homologs of each of the genes comprising the BGCs using BLASTP (Altschul et al., 1990) with a minimum e-value of 10-10. Individual genes in a BGC obtained from previous studies (Seco et al., 2004; Zhang et al., 2006) were used as query sequences. Presence of the BGC was inferred if there were significant BLASTP hits for at least 90% of the individual genes within the BGC.
Figure 3
Figure 3
Genetic relationships among S. rimosus strains are influenced by homologous recombination. (A) A phylogenetic network of the S. rimosus core genome generated using SplitsTree. The strain names were colored according to clustering results using BAPS. (B) Donor-recipient linkages of major recombination events (i.e., highways of recombination) identified using fastGEAR and BLASTN. Scale bar represents nucleotide substitutions per site. Each arrow represents a certain number of recombination events between a pair of genomes, with different colors representing the range of numbers. (C) Genes that have undergone recent or ancestral recombination. Horizontal axis shows the estimated number of ancestral recombinations and vertical axis shows the estimated number of recent recombinations. Names of some of the genes are shown. Numbers in parenthesis indicate the number of genes represented by overlapping dots found on the same position. (D) Frequency histogram of the size of recombination events of all genes in the pan-genome.

References

    1. Altschul S. F., Gish W., Miller W., Myers E. W., Lipman D. J. (1990). Basic local alignment search tool. J. Mol. Biol. 215 403–410. 10.1016/S0022-2836(05)80360-2 - DOI - PubMed
    1. Andam C. P., Choudoir M. J., Vinh Nguyen A., Sol Park H., Buckley D. H. (2016). Contributions of ancestral inter-species recombination to the genetic diversity of extant Streptomyces lineages. ISME J. 10 1731–1741. 10.1038/ismej.2015.230 - DOI - PMC - PubMed
    1. Andam C. P., Gogarten J. P. (2011). Biased gene transfer in microbial evolution. Nat. Rev. Microbiol. 9 543–555. 10.1038/nrmicro2593 - DOI - PubMed
    1. Andam C. P., Mitchell P. K., Callendrello A., Chang Q., Corander J., Chaguza C., et al. (2017). Genomic epidemiology of penicillin-nonsusceptible pneumococci with nonvaccine serotypes causing invasive disease in the United States. J. Clin. Microbiol. 55 1104–1115. 10.1128/JCM.02453-16 - DOI - PMC - PubMed
    1. Andreani N. A., Hesse E., Vos M. (2017). Prokaryote genome fluidity is dependent on effective population size. ISME J. 11 1719–1721. 10.1038/ismej.2017.36 - DOI - PMC - PubMed

LinkOut - more resources