. 2019 Mar 20:10:503.
doi: 10.3389/fimmu.2019.00503. eCollection 2019.

TLR3 Activation of Intratumoral CD103+ Dendritic Cells Modifies the Tumor Infiltrate Conferring Anti-tumor Immunity

Affiliations

TLR3 Activation of Intratumoral CD103+ Dendritic Cells Modifies the Tumor Infiltrate Conferring Anti-tumor Immunity

Emiliano Roselli et al. Front Immunol. .

Abstract

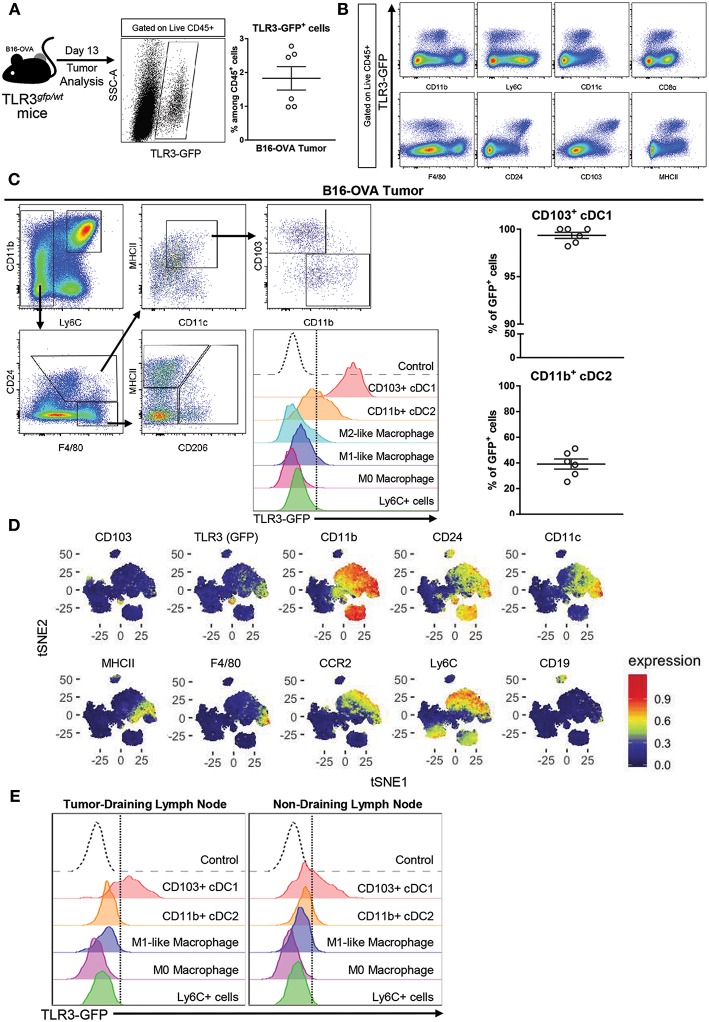
An important challenge in cancer immunotherapy is to expand the number of patients that benefit from immune checkpoint inhibitors (CI), a fact that has been related to the pre-existence of an efficient anti-tumor immune response. Different strategies are being proposed to promote tumor immunity and to be used in combined therapies with CI. Recently, we reported that intratumoral administration of naked poly A:U, a dsRNA mimetic empirically used in early clinical trials with some success, delays tumor growth and prolongs mice survival in several murine cancer models. Here, we show that CD103+ cDC1 and, to a much lesser extent CD11b+ cDC2, are the only populations expressing TLR3 at the tumor site, and consequently could be potential targets of poly A:U. Upon poly A:U administration these cells become activated and elicit profound changes in the composition of the tumor immune infiltrate, switching the immune suppressive tumor environment to anti-tumor immunity. The sole administration of naked poly A:U promotes striking changes within the lymphoid compartment, with all the anti-tumoral parameters being enhanced: a higher frequency of CD8+ Granzyme B+ T cells, (lower Treg/CD8+ ratio) and an important expansion of tumor-antigen specific CD8+ T cells. Also, PD1/PDL1 showed an increased expression indicating that neutralization of this axis could be exploited in combination with poly A:U. Our results shed new light to promote further assays in this dsRNA mimetic to the clinical field.

Keywords: CD103+ cDC1; TLR3; cancer immunotherapy; dsRNA mimetics; tumor-infiltrate.


Figures

Figure 1
Figure 1
TLR3 is mainly expressed by CD103+ cDC1 and a fraction of CD11b+ cDC2. (A) Expression of TLR3-GFP on tumor-infiltrating leukocytes (CD45+ cells) isolated from B16-OVA tumors harvested from TLR3gfp/wt mice at day 13 after tumor cell inoculation. n = 6. (B) Intratumoral immune cells (Live CD45+ cells) from TLR3gfp/wt mice showing expression of TLR3-GFP together with different population markers. (C) Gating strategy used to characterize tumor-infiltrating myeloid cells. Expression of TLR3-GFP on different tumor-infiltrating myeloid cells (middle panel). Frequency of CD103+ cDC1 and CD11b+ cDC2 expressing TLR3-GFP among total cells in each population (right panel). (D) tSNE dimensionality reduction showing concatenated flow cytometry data of intratumoral immune cells from TLR3gfp/wt mice with heat-map showing the distribution of various surface markers on the different clusters. (E) Histograms showing TLR3-GFP expression on different myeloid cells present in tumor-draining and non-draining inguinal lymph nodes. Data in (A,C) are shown as mean ± SEM.
Figure 2
Figure 2
Poly A:U administration at the tumor site exhaustively modifies the tumor immune infiltrate. (A) WT C57BL/6 mice bearing B16-OVA tumors were intratumorally -treated with either poly A:U (100 μg/mice/dose) or PBS (control) every other day as indicated in the upper scheme. Plot of individual tumor volume of poly A:U and PBS groups. Tumor weight was evaluated at day 13 post-inoculation. (B) Total number of intratumoral myeloid cells per gram of tumor (density). (C) Total number of intratumoral lymphoid cells per gram of tumor (density). (D) tSNE plots showing concatenated flow cytometry data of intratumoral immune cells from mice treated with PBS (control) or poly A:U (pAU) showing the distribution of the lymphoid populations. Ex vivo analyses were performed at day 13 post-tumor inoculation. Data in (A–C) are shown as mean and pooled over two cohorts with significance determined by unpaired t-test. n = 9/group. *p < 0.05; **p < 0.01.
Figure 3
Figure 3
Poly A:U administration at the tumor site reduces the number of IL10-producing M2-like macrophages, increases intratumoral TNF, and promotes maturation/activation of cDCs. (A) Representative dot-plots displaying IL10 expression by M2-like macrophages (Ly6CCD11b+F4/80+CD206+). Total number of M2-like macrophages positive for IL10. (B) Total number of TNF+ cells infiltrating B16-OVA tumors from poly A:U-treated (pAU) and control (PBS) groups. (C) Frequency of CD86+ cells among intratumoral CD11b+ cDC2 and CD103+ cDC1 from mice treated with poly A:U (pAU) or control (PBS). Shown are representative histograms for each condition with meanMFI±SEM. (D) Frequency of CD86+ cells among CD11b+ cDC2 and CD103+ cDC1 present in both tumor-draining lymph nodes (DLN) and non-draining lymph nodes (N-DLN) from mice treated with poly A:U (pAU) or control (PBS). MFI for CD86 in CD11b+ cDC2 and CD103+ cDC1 among the positive population for this marker. Shown are representative histograms for each condition with meanMFI±SEM. Ex vivo analyses were performed at day 13 post-tumor inoculation from WT C57BL/6 mice. Data are shown as mean with significance determined by unpaired t-test. n = 4–5/group. *p < 0.05; **p < 0.01; ***p < 0.001; ****p < 0.0001.
Figure 4
Figure 4
Treatment with poly A:U modifies the T cell compartment, favoring a tumor-specific immune response. (A) Frequency of CD8+ T cells, CD4+ Tconv cells and CD4+ Treg cells among intratumoral TCRβ+ cells. Intratumoral Treg:CD8+ ratio and Treg:Tconv ratio obtained from tumors treated with PBS (control) or poly A:U (pAU) calculated using total number of cells per gram of tumor. (B) Frequency of granzyme B+ cells among intratumoral CD8+ T cells. MFI for granzyme B in intratumoral CD8+ T cells among the positive population for this marker. Shown are representative histograms for each condition with meanMFI±SEM. (C) Frequency of OVA-tetramer+ cells among intratumoral CD8+ T cells. Shown are representative dot-plots for each condition showing OVA-tetramer+ cells expressing PD1. (D) Frequency of granzyme B+/KRLG1+ cells among intratumoral NK cells. MFI for granzyme B/KLRG1 in intratumoral NK cells among the positive population for this marker. Shown are representative histograms for each condition with meanMFI±SEM. (E) tSNE dimensionality reduction showing concatenated flow cytometry data of intratumoral immune cells from mice treated with PBS (control) or poly A:U (pAU) with heat-map showing the distribution of OVA-tetramer+ cells indicated by arrows (upper panel) and granzyme B+ cells (lower panel). Ex vivo analyses were performed at day 13 post-tumor inoculation from WT C57BL/6 mice. Data in (A–D) are shown as mean with significance determined by unpaired t-test. n = 4/group. *p < 0.05; **p < 0.01; ***p < 0.001.
Figure 5
Figure 5
Administration with poly A:U at the tumor bed impacts the PD1/PDL1 axis. (A) Frequency of PD1+ cells among intratumoral CD8+ T cells, CD4+ Treg cells and CD4+ Tconv cells. MFI for PD1 in CD8+ T cells (upper panel), CD4+ Treg cells (middle panel), and CD4+ Tconv cells (lower panel) among the positive population for this marker. Shown are representative histograms for each condition with meanMFI±SEM. tSNE dimensionality reduction showing concatenated flow cytometry data of intratumoral immune cells from mice treated with PBS (control) or poly A:U (pAU) with heat-map showing the distribution of PD1+ cells among the CD8+ T cells, CD4+ Treg cells, and CD4+ Tconv cells clusters (dotted lines). (B) Frequency of PD-L1+ cells within the different subsets of intratumoral immune cells (upper panel). PD-L1 expression in representative histograms for each condition (lower panel). Ex vivo analyses were performed at day 13 post-tumor inoculation from WT C57BL/6 mice. Data in (A,B) are shown as mean with significance determined by unpaired t-test. n = 4–9/group. *p < 0.05; **p < 0.01; ****p < 0.0001.

References

    1. Ribas A, Wolchok JD. Cancer immunotherapy using checkpoint blockade. Science. (2018) 359:1350–55. 10.1126/science.aar4060 - DOI - PMC - PubMed
    1. Sharma P, Hu-Lieskovan S, Wargo JA, Ribas A. Primary, adaptive, and acquired resistance to cancer immunotherapy. Cell. (2017) 168:707–23. 10.1016/j.cell.2017.01.017 - DOI - PMC - PubMed
    1. Sharma P, Allison JP. The future of immune checkpoint therapy. Science. (2015) 348:56–61. 10.1126/science.aaa8172 - DOI - PubMed
    1. Binnewies M, Roberts EW, Kersten K, Chan V, Fearon DF, Merad M, et al. . Understanding the tumor immune microenvironment (TIME) for effective therapy. Nat Med. (2018) 24:541–50. 10.1038/s41591-018-0014-x - DOI - PMC - PubMed
    1. Merad M, Sathe P, Helft J, Miller J, Mortha A. The dendritic cell lineage: ontogeny and function of dendritic cells and their subsets in the steady state and the inflamed setting. Annu Rev Immunol. (2013) 31:563–604. 10.1146/annurev-immunol-020711-074950 - DOI - PMC - PubMed

Publication types

MeSH terms