. 2019 Mar 20:9:119.
doi: 10.3389/fonc.2019.00119. eCollection 2019.

Leveraging Spatial Variation in Tumor Purity for Improved Somatic Variant Calling of Archival Tumor Only Samples

Affiliations

Leveraging Spatial Variation in Tumor Purity for Improved Somatic Variant Calling of Archival Tumor Only Samples

Rebecca F Halperin et al. Front Oncol. .

Abstract

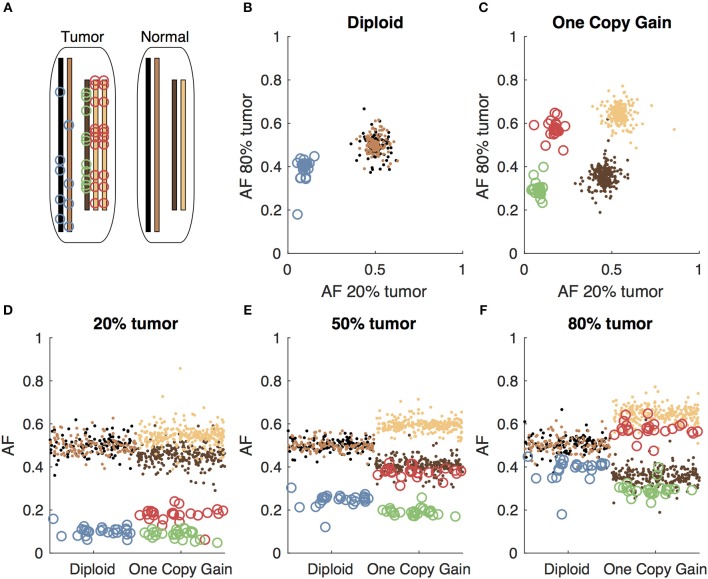
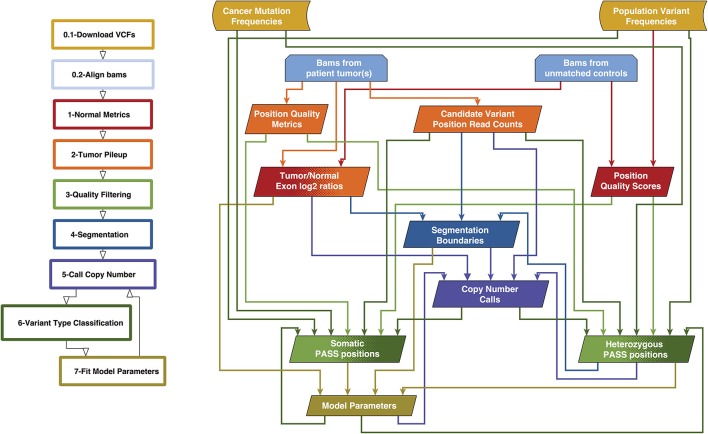
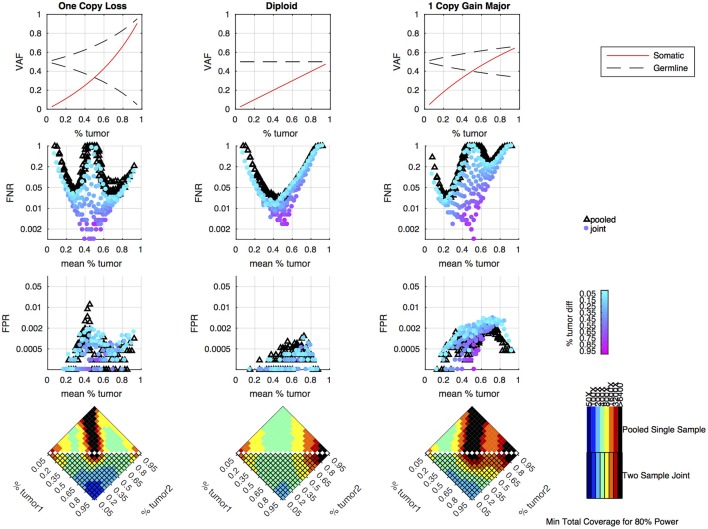
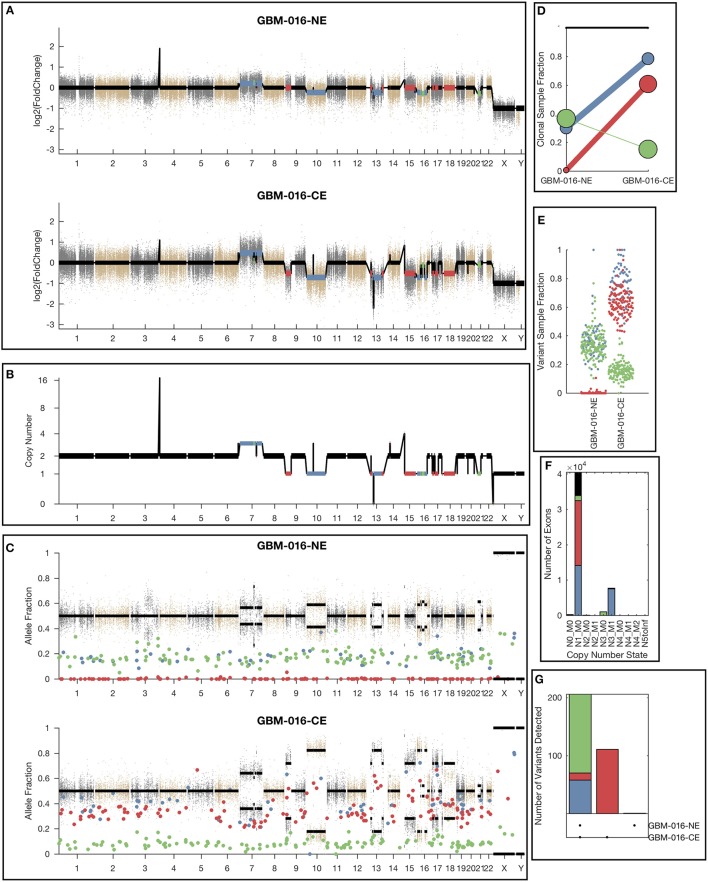
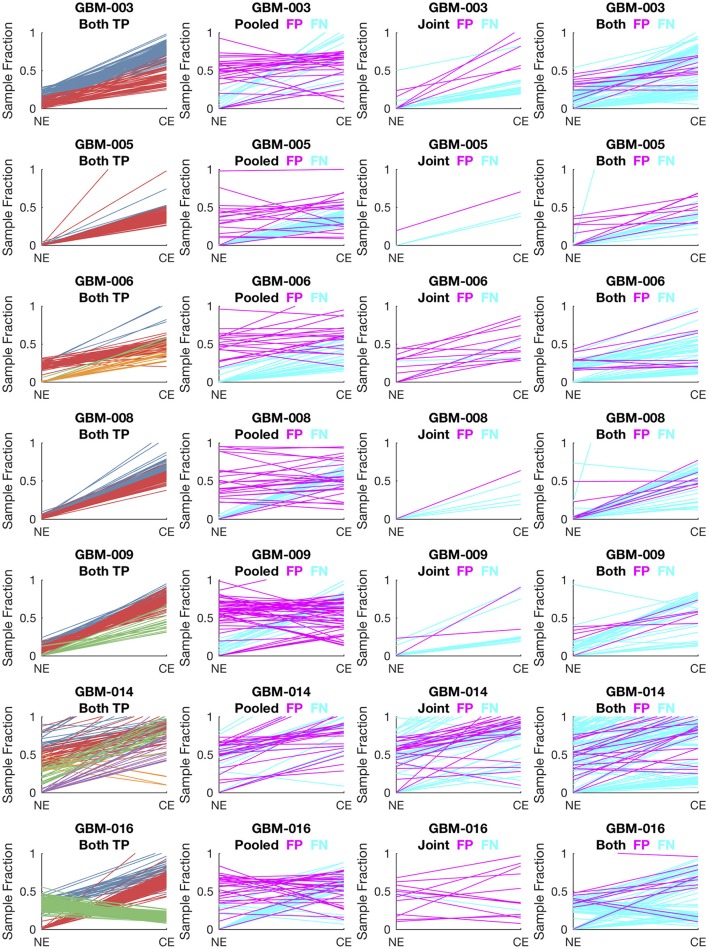
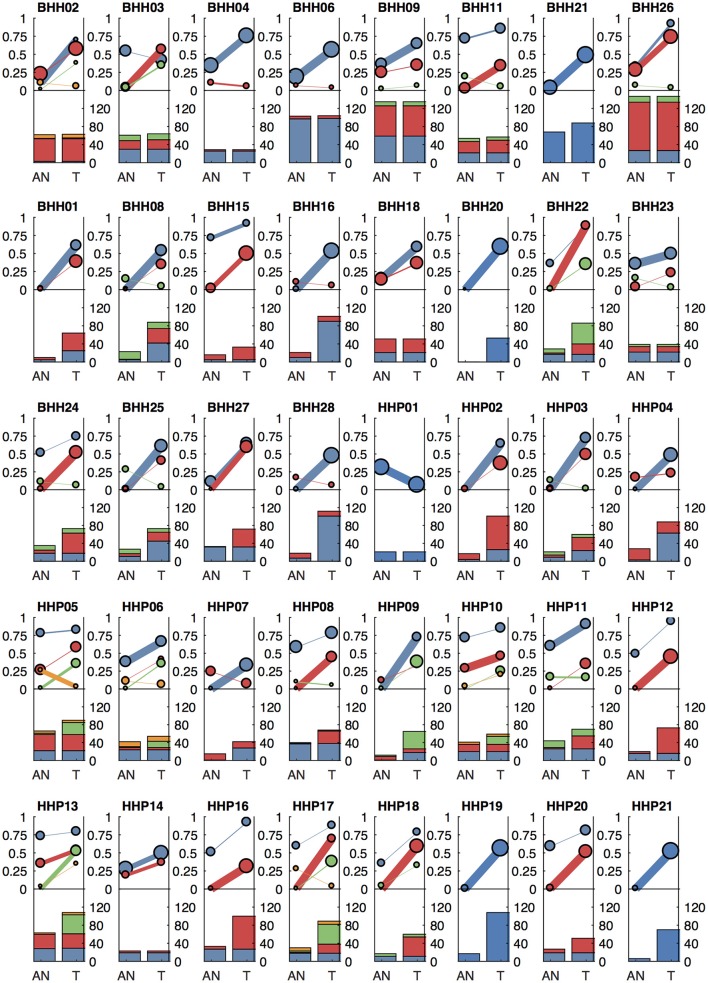
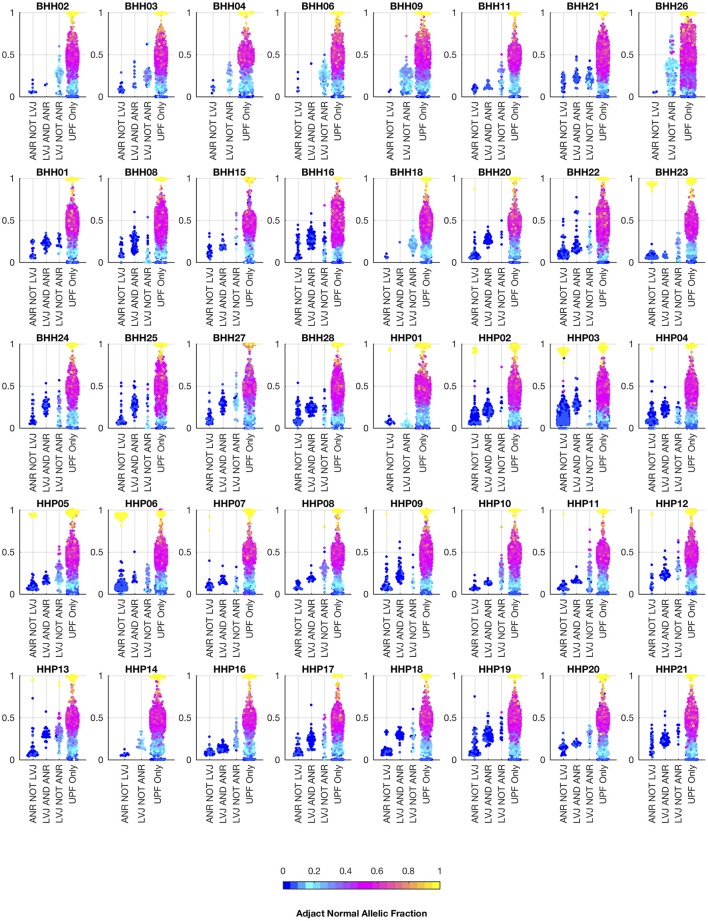
Archival tumor samples represent a rich resource of annotated specimens for translational genomics research. However, standard variant calling approaches require a matched normal sample from the same individual, which is often not available in the retrospective setting, making it difficult to distinguish between true somatic variants and individual-specific germline variants. Archival sections often contain adjacent normal tissue, but this tissue can include infiltrating tumor cells. As existing comparative somatic variant callers are designed to exclude variants present in the normal sample, a novel approach is required to leverage adjacent normal tissue with infiltrating tumor cells for somatic variant calling. Here we present lumosVar 2.0, a software package designed to jointly analyze multiple samples from the same patient, built upon our previous single sample tumor only variant caller lumosVar 1.0. The approach assumes that the allelic fraction of somatic variants and germline variants follow different patterns as tumor content and copy number state change. lumosVar 2.0 estimates allele specific copy number and tumor sample fractions from the data, and uses a to model to determine expected allelic fractions for somatic and germline variants and to classify variants accordingly. To evaluate the utility of lumosVar 2.0 to jointly call somatic variants with tumor and adjacent normal samples, we used a glioblastoma dataset with matched high and low tumor content and germline whole exome sequencing data (for true somatic variants) available for each patient. Both sensitivity and positive predictive value were improved when analyzing the high tumor and low tumor samples jointly compared to analyzing the samples individually or in-silico pooling of the two samples. Finally, we applied this approach to a set of breast and prostate archival tumor samples for which tumor blocks containing adjacent normal tissue were available for sequencing. Joint analysis using lumosVar 2.0 detected several variants, including known cancer hotspot mutations that were not detected by standard somatic variant calling tools using the adjacent tissue as presumed normal reference. Together, these results demonstrate the utility of leveraging paired tissue samples to improve somatic variant calling when a constitutional sample is not available.

Keywords: cancer genomics; cancer hotspot mutations; next generation sequencing; somatic variant calling; tumor exome sequencing; tumor-only sequencing.


Figures

Figure 1
Figure 1
Somatic and germline variant allelic fractions example. (A) Two chromosomes are illustrated for this example. Both chromosomes are present in the diploid state in the normal cell. In the tumor cell, one chromosome is in the diploid state, and the other shows one-copy gain. Blue circles represent somatic variants on the diploid chromosome, green and red circles represent somatic variants on the minor and major alleles of the gained chromosome, respectively. Simulated allelic fractions of germline variants (brown/tan) and somatic variants are plotted for a simulated 20% tumor (D), 50% tumor (E) and 80% tumor (F) by chromosome position. In the 50% tumor example, somatic variants could easily be distinguished from germline on the diploid chromosome, but on the copy number gain chromosome, the allelic fractions of the somatic variants on the major allele overlap with the germline variants. By using both the 20 and 80% tumor samples, the somatic variants can be separated from the germline variants by allelic fraction on both the diploid chromosome (B) and the copy number gain chromosome (C).
Figure 2
Figure 2
Overview of lumosVar 2.0 analysis. The flow-chart on the left show the main steps in the analysis. Steps 0.1 and 0.2 are data preparation, and steps 1–7 are performed by lumosVar 2.0. The graph on the right illustrates the main inputs and outputs of each step. The color of the arrows coming from each box indicates the steps where that data is used as input, and the color of each box indicates the step where the data is generated.
Figure 3
Figure 3
Simulation results comparing pooled and joint approaches. Top row of graphs shows the expected allele frequency of somatic (red) and germline variants (black) by tumor content (x-axis) for different copy number states. The middle two rows of graphs are based on simulation results using a mean coverage of 200X per sample (400X pooled). They show the false negative rate (FNR—simulated somatic variants not called somatic) and false positive rate (FPR—simulated germline heterozygous variants falsely called somatic) plotted by mean tumor content for the pooled (black triangles) and joint (colored circles) approaches. For the joint approach, the color of the circles represents the difference in tumor content between the two samples analyzed jointly. The bottom set of graphs shows the coverage required to detect at least 80% of the simulated somatic variants using two samples of different tumor content (shown on the x and y axis) using a joint approach (lower triangle of each heatmap) or using a single-sample approach on a merged sample with a tumor content that is the average of the two samples and coverage that is the sum of the two samples (upper triangle of heatmap). The color indicates the mean target coverage in the pooled approach, or the sum of the mean target coverage in the two-sample joint approach. Black squares indicate that <80% of the somatic variants were detected at the highest coverage simulated (6400X).
Figure 4
Figure 4
Example lumosVar 2.0 output. (A) Log2 fold change of the mean exon read depths compared to the unmatched controls. (B) The estimated integer copy number states are plotted for each genomic segment by chromosome position. (C) The variant allele fractions are plotted by chromosome position. The gray and brown dots represent variants called as germline heterozygous by lumosVar 2.0 and the large colored dots represent variants called somatic by lumosVar 2.0. (D) Summary of the clonal variant group patterns. The thickness of the lines represents the proportion of copy number events assigned to each group and the size of each circle is proportional to the number mutations assigned to each group. (E) Sample fraction (estimated proportion of cells in the sample containing the variant) distribution of somatic mutations. (F) Number of exons determined to be in each copy number state, excluding diploid. (G) Number of somatic mutations detected in both samples (left bar), enhancing only (middle bar), and non-enhancing only (right bar). On all plots, the colors indicate the clonal variant group.
Figure 5
Figure 5
Comparison of variants called in pooled vs. joint approach. The first column of graphs shows the estimated sample fractions of true somatic variants that were detected by both the pooled and joint approaches. The variants are colored by clonal variant groups. The other three columns show the sample fractions of variants that were called incorrectly only in the pooled approach (column 2), only in the joint approach (column 3), or incorrectly in both approaches (column 4). False positives variants are shown in magenta and false negatives in cyan.
Figure 6
Figure 6
Clonal patterns and variant counts detected by lumosVar 2.0 in the archival dataset. The top half of each plot shows the summary of the clonal variant group patterns for each patient. Each line represents a clonal variant group and the thickness of the lines represents the proportion of copy number events assigned to each group and the size of each circle is proportional to the number mutations assigned to each group. The bottom half of each plot shows the number of somatic variants detected in the adjacent normal (AN) and tumor (T) samples, with the colors corresponding the clonal variant groups. The 8 patients in the top row had the adjacent normal tissue macrodissected from tumor containing slides and these patients typically have similar number of variants detected in the tumor and adjacent normal.
Figure 7
Figure 7
Comparison of allelic fractions of variants in archival dataset by calling method. For each of the breast and prostate patients, the allele fractions in the tumor sample are plotted for the variants detected in each of the three approaches. The color of each point indicates the allele fraction of the variant in the adjacent normal sample. Most of the variants detected in the adjacent normal as reference approach, but not lumosVar 2.0 joint analysis (ANR NOT LVJ), have low allele fractions in both the tumor and the adjacent normal. The variants detected by lumosVar 2.0 joint analysis, but not adjacent normal as reference approach (LVJ NOT ANR) typically have higher allele fractions in the tumor, and lower allele fractions in the adjacent normal, though lumosVar 2.0 joint analysis also detects some variants that are lower allele fraction in the tumor and higher allele fraction in the adjacent normal in a few patients such as HPP01. The variants only called in the unmatched filtering (UPF only) approach have similar allele fractions in the tumor and adjacent normal samples. The 8 patients in the top row had the adjacent normal tissue macrodissected from tumor containing slides and these patients typically have more variants detected by lumosVar 2.0 joint analysis and not ANR compared to the remaining patients whose adjacent normal sample was procured from separate slides.

References

    1. Allen EMV, Wagle N, Stojanov P, Perrin DL, Cibulskis K, Marlow S, et al. Whole-exome sequencing and clinical interpretation of FFPE tumor samples to guide precision cancer medicine. Nat Med. (2014) 20:682–8. 10.1038/nm.3559 - DOI - PMC - PubMed
    1. Bailey MH, Tokheim C, Porta-Pardo E, Sengupta S, Bertrand D, Weerasinghe A, et al. . Comprehensive characterization of cancer driver genes and mutations. Cell. (2018) 173:371–85.e18. 10.1016/j.cell.2018.02.060 - DOI - PMC - PubMed
    1. Cheng DT, Mitchell TN, Zehir A, Shah RH, Benayed R, Syed A, et al. . Memorial Sloan Kettering-Integrated Mutation Profiling of Actionable Cancer Targets (MSK-IMPACT): a hybridization capture-based next-generation sequencing clinical assay for solid tumor molecular oncology. J Mol Diagn. (2015) 17:251–64. 10.1016/j.jmoldx.2014.12.006 - DOI - PMC - PubMed
    1. Frampton GM, Fichtenholtz A, Otto GA, Wang K, Downing SR, He J, et al. . Development and validation of a clinical cancer genomic profiling test based on massively parallel DNA sequencing. Nat Biotechnol. (2013) 31:1023–31. 10.1038/nbt.2696 - DOI - PMC - PubMed
    1. Khurana E, Fu Y, Chakravarty D, Demichelis F, Rubin MA, Gerstein M. Role of non-coding sequence variants in cancer. Nat Rev Genet. (2016) 17:93–108. 10.1038/nrg.2015.17 - DOI - PubMed