Review
. 2019 Feb 26:4:47-68.
doi: 10.1016/j.cnp.2019.01.005. eCollection 2019.

Vestibular evoked myogenic potentials in practice: Methods, pitfalls and clinical applications

Affiliations
Review

Vestibular evoked myogenic potentials in practice: Methods, pitfalls and clinical applications

Sally M Rosengren et al. Clin Neurophysiol Pract. .

Abstract

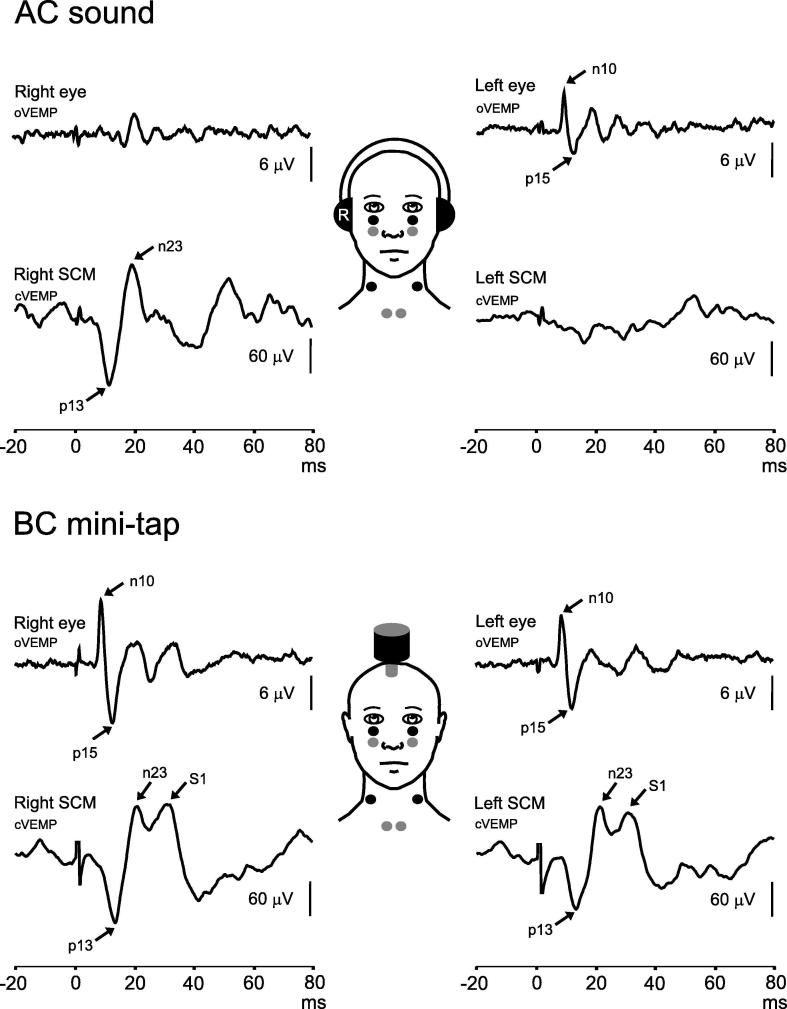
Vestibular evoked myogenic potentials (VEMPs) are a useful and increasingly popular component of the neuro-otology test battery. These otolith-dependent reflexes are produced by stimulating the ears with air-conducted sound or skull vibration and recorded from surface electrodes placed over the neck (cervical VEMPs) and eye muscles (ocular VEMPs). VEMP abnormalities have been reported in various diseases of the ear and vestibular system, and VEMPs have a clear role in the diagnosis of superior semicircular canal dehiscence. However there is significant variability in the methods used to stimulate the otoliths and record the reflexes. This review discusses VEMP methodology and provides a detailed theoretical background for the techniques that are typically used. The review also outlines the common pitfalls in VEMP recording and the clinical applications of VEMPs.

Keywords: AC, air-conducted; AR, asymmetry ratio; AVS, acute vestibular syndrome; BAER, brainstem auditory evoked potential; BC, bone-conducted; BPV, benign positioning vertigo; BVP, bilateral vestibulopathy; CANVAS, cerebellar ataxia, neuropathy and vestibular areflexia syndrome; Deg, degrees; ECG, electrocardiographic; EEG, electroencephalographic; EMG, electromyographic activity/electromyogram; FL, force level; HL, hearing level; IO, inferior oblique; MD, Meniere’s disease; Method; NIOSH, National Institutes of Occupational Safety and Health; Otolith; PCS, posterior circulation stroke; PICA, posterior inferior cerebellar artery; PP, peak-to-peak; RMS, root mean square; SCC, semicircular canal; SCD, superior canal dehiscence; SCM, sternocleidomastoid; SL, sensation level; SPL, sound pressure level, being the RMS value for a sinusoid; SVH, subjective visual horizontal; Sound; UW, unilateral weakness; VEMP; VEMP, vestibular evoked myogenic potential; VM, vestibular migraine; VN, vestibular neuritis; VS, vestibular schwannoma; Vestibular; Vibration; cVEMP, cervical vestibular evoked myogenic potential; dB, decibels, the logarithm of the relative power versus a reference; dBA, decibels, measured using an “A” weighting; nHL, normal hearing level; oVEMP, ocular vestibular evoked myogenic potential; pkFL, peak force level; pkSPL, peak sound pressure level (3 dB higher than RMS for a sinusoid); vHIT, video head impulse test.


Figures

Fig. 1
Fig. 1
cVEMPs and oVEMPs evoked by air-conducted (AC) sound and bone-conducted (BC) vibration in a normal volunteer. Typical electrode positions used to record oVEMPs and cVEMPs are shown bilaterally and consist of bipolar montages made up of active (black circles) and reference (grey circles) pairs. In the top panel, cVEMPs (lower traces) evoked by AC sound can be seen on the right side, i.e. ipsilateral to stimulation, while oVEMPs (upper traces) can be seen on the left side, contralateral to stimulation. In the bottom panel, VEMPs evoked by BC stimulation applied to the forehead are shown. Responses can be seen bilaterally, as BC stimulation activates vestibular afferents in both ears. cVEMPs evoked by BC stimulation can have additional peaks following the p13-n23 response (labelled S1 here), which are thought to be stretch reflexes.
Fig. 2
Fig. 2
Effect of stimulus artefact on oVEMPs. In the upper trace, the oVEMP has been truncated by the bone-conducted stimulus artefact, while in the lower trace the whole response is visible.
Fig. 3
Fig. 3
Threshold differences between cVEMPs and oVEMPs evoked by AC sound. oVEMP thresholds are approx. 5 dB higher than cVEMP thresholds, independent of the shape of stimulus used. In this example, data are from Rosengren et al. (2011), in which 61 normal volunteers were stimulated with 0.1 ms clicks and 500 Hz, 2 ms tone bursts, both at 105 dB LAeq. Error bars represent standard error.
Fig. 4
Fig. 4
Effect of number of stimulus repetitions on cVEMPs. In part A, data are from a single subject stimulated with 500 Hz, 2 ms tone bursts at 105 dB LAeq. Data from a trial with 200 stimulus repetitions are shown, separated into the first three sets of 50 repetitions (1–49, 50–99 and 100–150 stimuli). Below these are the average of all 200 repetitions (black trace) and a repeat trial with 200 stimuli (grey trace). The first two 50 repetition trials gave the impression of a present response at the appropriate time (approx. 13 and 23 ms), but averaging more stimuli showed that the response was absent and the observed peaks were part of the background EMG. In parts B and C, data are from a different single subject tested with the same stimulus. Part B shows data from a trial with 200 stimulus repetitions, separated into four consecutive sets of 50 repetitions. These short trials again gave the impression of a possible cVEMP, but are too noisy to provide convincing evidence. Part C shows the same data presented with increasing numbers of stimulus repetitions. The cVEMP becomes clearer and the peaks reliably extend beyond the baseline noise level with 150–200 stimuli. A second trace of 200 stimuli is shown in grey, showing that the subject has quite small, but reproducible, cVEMPs.
Fig. 5
Fig. 5
Measuring the SCM contraction using full-wave rectified EMG. The upper two traces show unrectified and full-wave rectified EMG following 1 stimulus repetition. It can be seen that the rectified trace is the absolute value of the unrectified trace. The middle two traces show the cVEMP recording after 5 stimulus repetitions, showing an intermediate step in the formation of the average. The lower two traces show the cVEMP and rectified EMG average after 200 stimulus repetitions. The cVEMP has a typical appearance, with peaks of 83 µV at 13.6 ms and 118 µV at 21.5 ms. The full-wave rectified EMG (after being averaged over 200 repetitions) is now averaged over the 20 ms baseline period (80 µV). The amplitude ratio for this subject is 2.5, calculated by dividing the peak-to-peak amplitude (201 µV) by the mean rectified EMG.
Fig. 6
Fig. 6
Effect of correction for muscle contraction on cVEMP amplitude. cVEMPs (upper traces) evoked by AC sound were measured from the left and right SCM muscles of a normal volunteer. Contraction strength (lower traces, mean pre-stimulus full-wave rectified EMG) was much lower in the right SCM (46 µV) than the left (156 µV), and as a result the uncorrected amplitudes were asymmetric across the two ears (109 vs 320 µV, asymmetry 49%). Using ratios as amplitude measures (i.e. corrected amplitudes) to correct for this contraction difference produced a normal asymmetry ratio of 6.7%.
Fig. 7
Fig. 7
Effect of stimulus intensity on cVEMPs. In part A, the subject had no response to two trials of AC sound delivered at 95 dB (tone bursts of 500 Hz, 2 ms). Increasing the stimulus intensity to 100 and 105 dB revealed a normal reflex. In part B, a different subject had no response to BC stimulation delivered to the forehead in the midline with stimulus intensity 40 Vpp, but had a normal response to a stronger stimulus.
Fig. 8
Fig. 8
Effect of muscle contraction on cVEMPs. This subject had an absent cVEMP evoked by AC sound with a weak SCM contraction of 61 µV mean rectified EMG, but a small normal reflex with a stronger contraction of 127 µV.
Fig. 9
Fig. 9
Effect of vertical gaze on oVEMPs. Part A shows oVEMPs evoked by AC tone bursts (500 Hz, 2 ms). The top two overlaid traces show absent responses to stimuli delivered at two intensities (105 and 110 dB LAeq) recorded with gaze elevated to 20 degrees. Raising the angle of gaze to maximal up-gaze revealed a small oVEMP. Part B shows oVEMPs evoked by BC stimulation with gaze straight ahead and elevated to 25 degrees. oVEMPs are larger with up-gaze.
Fig. 10
Fig. 10
Vestibular neuritis (left ear). This figure illustrates a pattern of abnormality consistent with the superior portion of the vestibular nerve being affected in a patient with vestibular neuritis. In the affected ear oVEMPs are absent, while cVEMPs are preserved bilaterally. Video head impulses (vHITs) are reduced in the anterior and lateral semicircular canals, while posterior canals are unaffected. The audiogram shows essentially normal and symmetric hearing with a mild sloping sensorineural hearing loss, which is age-consistent. Subjective visual horizontal testing is significantly abnormal showing a leftward bias. MRI of the brain is normal. In Fig. 10, Fig. 11, Fig. 12, Fig. 13, Fig. 14, Fig. 15, Fig. 16, right ear results are in red, left ear results are in blue. vHIT gains are listed in the upper-right corner of each recording. cVEMP amplitude is shown as a corrected amplitude (ratio), after dividing the peak-to-peak value by the mean rectified EMG. Asymmetry ratios are given for VEMPs and calorics. Arrows and asterisks indicate results which fall outside the normal limits. [Abbreviations: AR; asymmetry ratio, dB HL; Decibels hearing level, Deg; Degree, kHz; Kilohertz, SCC; Semicircular canal, SVH; subjective visual horizontal, UW; unilateral weakness.]
Fig. 11
Fig. 11
Right posterior inferior cerebellar artery (PICA) stroke. VEMP reflexes and audiogram are normal bilaterally. Right anterior and left lateral semicircular canal vHIT gains are reduced in the right anterior and left lateral and posterior semicircular canals. Subjective visual horizontal testing is significantly abnormal showing a leftward bias away from the affected side. MRI of the brain shows an area of diffusion restriction within the right medial cerebellar hemisphere in the right PICA territory.
Fig. 12
Fig. 12
Ménière's disease (right ear). In this patient with Ménière’s, cVEMP reflexes are reduced in the affected ear while the oVEMP reflexes are preserved bilaterally. vHITs and subjective visual horizontal tests are normal. The audiogram shows a significant asymmetry with the affected ear showing a flat moderately-severe sensorineural hearing loss. Caloric testing also shows a significant asymmetry, where the right ear shows negligible vestibular response to ice-water irrigation.
Fig. 13
Fig. 13
Vestibular migraine. In this patient with vestibular migraine all audiovestibular test results are normal and symmetric.
Fig. 14
Fig. 14
Bilateral vestibular loss (superficial siderosis). Bilateral audiovestibular loss in a patient with superficial siderosis. The oVEMP and cVEMP reflexes are absent bilaterally, with vHIT results showing significantly reduced gains and catch-up saccades in all six semicircular canals. The audiogram shows a sloping mild to profound sensorineural hearing loss bilaterally. MRI of the brain shows haemosiderin deposition over the brainstem and spinal cord (arrows). Subjective visual horizontal test is normal.
Fig. 15
Fig. 15
Unilateral vestibular loss (left vestibular schwannoma). The audio vestibular test results are reduced on the left side, while the right-sided test results are normal. MRI of the brain shows a left-sided vestibular schwannoma compressing the brainstem.
Fig. 16
Fig. 16
Superior semicircular canal dehiscence syndrome (left ear). In the affected ear there are abnormally large oVEMP and cVEMP reflexes with low reflex thresholds while the audiogram shows a low-frequency air-bone gap with increased air-conducted thresholds in dB SPL). Temporal bone CT scan shows a dehiscence over the left anterior (superior) canal. All other audiovestibular tests results fall within normal limits.

References

    1. Agrawal Y., Bremova T., Kremmyda O., Strupp M. Semicircular canal, saccular and utricular function in patients with bilateral vestibulopathy: analysis based on etiology. J. Neurol. 2013;260(3):876–883. - PMC - PubMed
    1. Aw S.T., Welgampola M.S., Bradshaw A.P., Todd M.J., Magnussen J.S., Halmagyi G.M. Click-evoked vestibulo-ocular reflex distinguishes posterior from superior canal dehiscence. Neurology. 2010;75(10):933–935. - PubMed
    1. Basta D., Todt I., Ernst A. Characterization of age-related changes in vestibular evoked myogenic potentials. J. Vestib. Res. 2007;17(2–3):93–98. - PubMed
    1. Brantberg K. Familial early-onset progressive vestibulopathy without hearing impairment. Acta Otolaryngol. 2003;123(6):713–717. - PubMed
    1. Brantberg K., Tribukait A. Vestibular evoked myogenic potentials in response to laterally directed skull taps. J. Vestib. Res. 2002;12(1):35–45. - PubMed