. 2019 Nov;234(11):19640-19654.
doi: 10.1002/jcp.28564. Epub 2019 Apr 4.

Activation of the STAT3/microRNA-21 pathway participates in angiotensin II-induced angiogenesis

Affiliations

Activation of the STAT3/microRNA-21 pathway participates in angiotensin II-induced angiogenesis

Li-Yuan Chen et al. J Cell Physiol. 2019 Nov.

Abstract

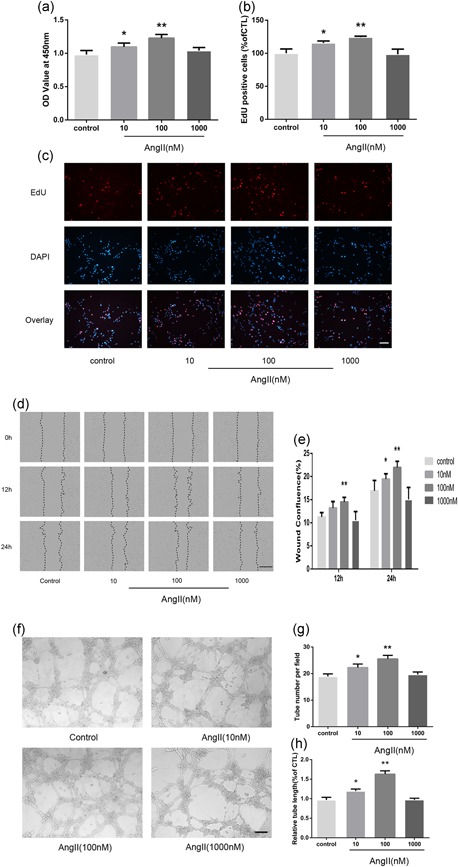
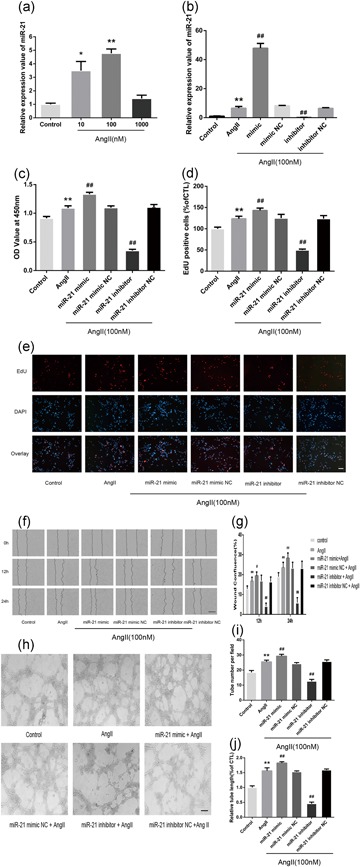
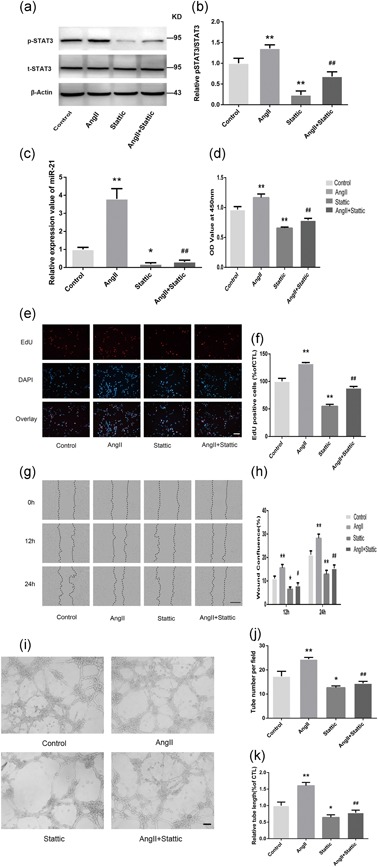
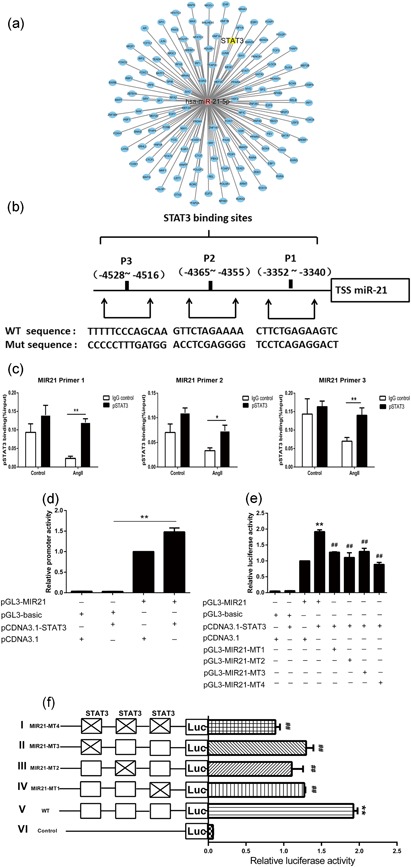
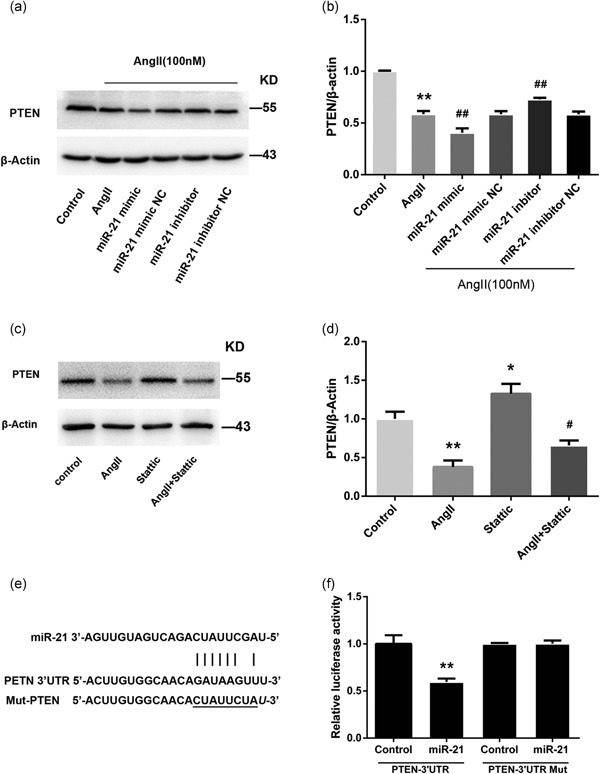
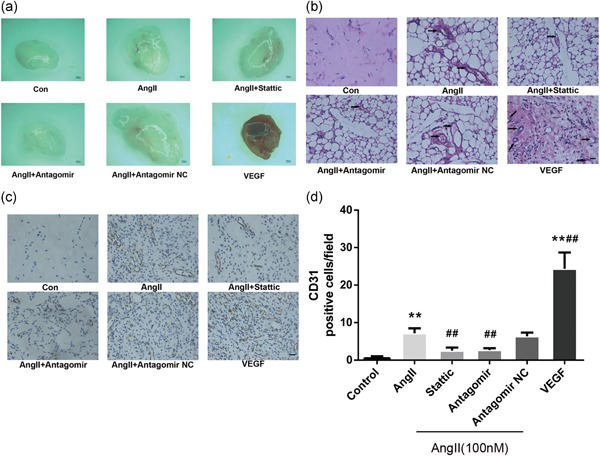
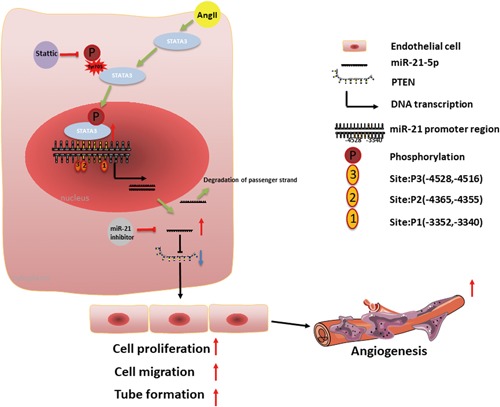
Angiotensin II (AngII) facilitates angiogenesis that is associated with the continuous progression of atherosclerotic plaques, but the underlying mechanisms are still not fully understood. Several microRNAs (miRNAs) have been shown to promote angiogenesis; however, whether miRNAs play a crucial role in AngII-induced angiogenesis remains unclear. This study evaluated the functional involvement of miRNA-21 (miR-21) in the AngII-mediated proangiogenic response in human microvascular endothelial cells (HMECs). We found that AngII exerted a proangiogenic role, indicated by the promotion of proliferation, migration, and tube formation in HMECs. Next, miR-21 was found to be upregulated in AngII-treated HMECs, and its specific inhibitor potently blocked the proangiogenic effects of AngII. Subsequently, we focused on the constitutive activation of STAT3 in the AngII-mediated proangiogenic process. Bioinformatic analysis indicated that STAT3 acted as a transcription factor initiating miR-21 expression, which was verified by ChIP-PCR. A reporter assay further identified three functional binding sites of STAT3 in the miR-21 promoter region. Moreover, phosphatase and tensin homolog (PTEN) was recognized as a target of miR-21, and STAT3 inhibition restored AngII-induced reduction in PTEN. Similarly, the STAT3/miR-21 axis was shown to mediate AngII-provoked angiogenesis in vivo, which was demonstrated by using the appropriate inhibitors. Our data suggest that AngII was involved in proangiogenic responses through miR-21 upregulation and reduced PTEN expression, which was, at least in part, linked to STAT3 signaling. The present study provides novel insights into AngII-induced angiogenesis and suggests potential treatment strategies for attenuating the progression of atherosclerotic lesions and preventing atherosclerosis complications.

Keywords: STAT3; angiogenesis; angiotensin II; atherosclerosis; miR-21.


Conflict of interest statement

The authors declare that there is no conflict of interests.

Figures

Figure 1
Figure 1
AngII induces human microvascular endothelial cell (HMEC) proliferation, migration, and capillary tube formation. (a) A Cell Counting Kit‐8 assay was performed to evaluate cell proliferation after 24 hr in corresponding serum‐free medium (n = 6). (b, c) EdU‐labeling analysis showed the fluorescence images of HMECs stimulated with 0, 10, 100, or 1,000 nM AngII for 24 hr (EdU, red fluorescent signals; DAPI, blue signals; ×100). (c) The percentage of DAPI‐positive cells indicated the quantification of EdU‐positive HMECs (n = 3; b). (d) HMECs monolayers were scratched and incubated with 0, 10, 100, or 1,000 nM AngII. Microscopic images were taken at 0, 12, and 24 hr using the IncuCyte ZOOM Live‐Cell Analysis System (Essen BioScience; ×40). (e) The relative wound confluence at 12 and 24 hr after wounding is shown (n = 3). (f) Representative micrographs of capillary tube formation by HMECs (1 × 104/well) treated with AngII (0, 10, 100, 1,000 nM). (g, h) Mean numbers of capillary‐like tubes (g) and cumulative tube lengths (h) were quantified by the mean of the counts from five random fields (×100; n = 3). The data are presented as the mean ± standard deviation. *p < 0.05 vs. con. **p < 0.01 vs. con. Scale bar in Figure 1c,f represents 80 μm and in Figure 1d represents 400 μm
Figure 2
Figure 2
miR‐21 upregulation is associated with AngII‐induced angiogenesis in HMECs. (a) qPCR analysis of the relative expression value of miR‐21 in HMECs after incubation with different concentrations (0, 10, 100, and 1,000 nM) of AngII for 24 hr (n = 3). (b) miR‐21 expression in HMECs was detected by real‐time PCR after transfection (n = 3). (c) CCK‐8 assays were used to detect cell proliferation after transfection (n = 4). (d,e) Representative images of the EdU assay (e) and the quantified number of EdU‐positive cells. The miR‐21 inhibitor offset the AngII‐induced increase in HMEC proliferation, while the miR‐21 mimic exerted the opposite effect (d; n = 3). (f) Representative images of HMECs after wounding from the indicated experimental groups. (g) Relative wound confluence of HMECs 24 hr after the transfection of hsa‐miR‐21 mimic, hsa‐miR‐21 inhibitor, and their respective negative controls (n = 3). (h) Representative images portraying the formation of capillary‐like tubes in HMECs after the indicated transfections. (i,j) HMEC branch number and length. All data are presented as the mean ± standard deviation. *p < 0.05 vs. con. **p < 0.01 vs. con. # p < 0.05 vs. AngII. ## p < 0.01 vs. AngII. The scale bars in Figure 2e,h represent 80 μm and in Figure 2f represent 400 μm. AngII: angiotensin II; CCK‐8: cell counting kit‐8; HMEC: human microvascular endothelial cell; miR‐21: miRNA‐21; qPCR: quantitative PCR
Figure 3
Figure 3
STAT3 phosphorylation is involved in AngII‐induced angiogenesis in HMECs. The HMECs were pretreated with Stattic (2 μM), a selective inhibitor, for 2 hr and then treated with AngII (100 nM) for 15 min. Western blot (a) and quantitative analyses (b) were performed to measure t‐STAT3 and p‐STAT3 (Tyr705) protein levels in HMECs (n = 3). (c) miR‐21 expression in HMECs was detected by real‐time PCR after AngII (24 hr) or Stattic treatment (2 hr; n = 4). (d) CCK‐8 assays were performed to detect HMEC proliferation (n = 4). Representative EdU images (e) and quantitative data (f) showing that HMEC cell proliferation was increased by AngII (100 nM), whereas these effects were reversed by coincubation with Stattic (2 µM; n = 3). (g,h) A scratch wound‐healing assay was conducted in HMECs with the indicated treatments. The migration distance was measured at 0, 12, and 24 hr after the cells had been scratched (n = 3). (i–k) HMECs were pretreated with Stattic (2 μM) for 2 hr and cocultured with or without AngII (100 nM). Representative images of in vitro angiogenesis assays (i). The tube number (j) and length (k) of each treatment are shown (n = 3). All data are presented as the mean ± standard deviation. *p < 0.05 vs. con. **p < 0.01 vs. con. # p < 0.05 vs. AngII. ## p < 0.01 vs. AngII. The scale bars in Figure 3e,i represent 80 μm. In Figure 3g, the bar represents 400 μm. AngII: angiotensin II; CCK‐8: cell counting kit‐8; HMEC: human microvascular endothelial cell; miR‐21: miRNA‐21; STAT3: signal transducer and activator of transcription 3
Figure 4
Figure 4
Three functional STAT3‐binding sites are identified in the miR‐21 proximal promoter region. (a) Bioinformatic analysis network of the transcription factors interacting with the promoter of miR‐21. The red circle represents hsa‐miR‐21‐5p, and the blue circles represent transcription factors related to essential biological processes. (b) Putative STAT3‐binding sites from the −3352 to −3340 positions, −4365 to −4355 positions, and −4528 to −4516 positions upstream of the miR‐21 transcription start site (+1) on miR‐21. (c) ChIP assays were performed to detect the binding of the p‐STAT3 protein to the miR‐21 promoter. Rabbit anti‐p‐STAT3 antibody or control rabbit IgG was used for immunoprecipitation with DNA isolated from HMECs. The immunoprecipitate was amplified by qPCR using primers targeting miR‐21. The results were normalized to the negative control IgG (n = 3). (d) Reporter gene assay using the miR‐21 promoter (n = 5). HEK293T cells were transfected with the indicated vectors for 48 hr; luciferase activities were measured with the Dual‐Luciferase Reporter System. (e) Promoter reporter assay of a firefly luciferase vector driven by miR‐21 (pGL3‐miR‐21‐Luc) containing the three STAT3‐binding sites shown in (b; n = 5). (f) Constructs containing mutations in all of the three binding sites (I), a single binding site (II, III, IV), or wild‐type (V) were cotransfected into HEK293T cells with a Renilla luciferase construct for normalization. The pGL3‐basic construct containing no promoter element (VI) was also transfected as a control. *p < 0.05 vs. IgG con, **p < 0.01 vs. IgG con in (c). **p < 0.01 vs. pGL3‐basic and pCDNA3.1‐STAT3 cotransfected group in (d). **p < 0.01 vs. pGL3‐miR‐21 and pCDNA3.1 cotransfected group. ## p < 0.01 vs. pGL3‐miR‐21 and pCDNA3.1‐STAT3 cotransfected group in (e). **p < 0.01 vs. pGL3‐basic and pCDNA3.1‐STAT3 cotransfected group. ## p < 0.01 vs. pGL3‐miR‐21 and pCDNA3.1‐STAT3 cotransfected group in (f). HMEC: human microvascular endothelial cell; IgG: immunoglobulin G; miR‐21: miRNA‐21; qPCR: quantitative PCR; STAT3: signal transducer and activator of transcription 3 [Color figure can be viewed at wileyonlinelibrary.com]
Figure 5
Figure 5
miR‐21 reduces PTEN expression by directly targeting its 3′‐UTR. (a,b) Representative western blots and quantitative analysis showing PTEN protein levels after transfection with miR‐21 mimic (30 nM), miR‐21 inhibitor (100 nM), or negative control (n = 3). (c,d) The effect of the STAT3‐specific inhibitor (Stattic) on the protein expression level of PTEN was determined by western blotting (c), and band intensities were quantified by optical density scanning (n = 3) (d). (e) Schematic illustration of reporter plasmid construction containing full‐length 3′‐UTR of PTEN. (f) An miR‐21 mimic (30 nM) or negative control was cotransfected with the luciferase reporter vector into HEK293 cells. The relative luciferase activity is shown (n = 3). All data are presented as the mean ± standard deviation. *p < 0.05 vs. con. **p < 0.01 vs. con. # p < 0.05 vs. AngII. ## p < 0.01 vs. AngII. AngII: angiotensin II; miR‐21: miRNA‐21; PTEN: phosphatase and tensin homolog
Figure 6
Figure 6
The inhibition of STAT3/miR‐21 pathway abrogated AngII‐induced angiogenesis in vivo. A Matrigel mixture containing VEGF (50 ng/ml) and AngII (100 nM) alone or in combination with either Stattic (50 µM) or miR‐21 antagomir (10 nM) was injected subcutaneously into the ventral side of the mice. After 14 days, the Matrigel plugs were recovered. Each group consisted of six mice. (a) Representative images of macroscopic visualization of Matrigel plugs at 14 days. (Leica MZ10 F; Leica, Wetzlar, Germany), ×80. (b, d) Plugs from implanted mice were subjected to H&E staining (b) and immunohistochemical staining for CD31 (c, d); representative images (c) for quantitative analysis (d; n = 6). Scale bars: 500 μm in (a), 19.6 μm in (b) and (c). New vessel formation (black arrowheads) was observed at ×400. *p < 0.05 vs. con. **p < 0.01 vs. con. # p < 0.05 vs. AngII. ## p < 0.01 vs. AngII. AngII: angiotensin II; H&E: hematoxylin and eosin; STAT3: signal transducer and activator of transcription 3 [Color figure can be viewed at wileyonlinelibrary.com]
Figure 7
Figure 7
Schematic diagram of the proposed mechanism for AngII‐induced angiogenesis. AngII upregulates miR‐21 expression in ECs by activating STAT3. Upregulation of miR‐21 by AngII inhibits PTEN expression by directly targeting the 3′‐UTR, leading to increased proliferation, migration, and tube formation in ECs. Targeting the STAT3/miR‐21 axis decreases AngII‐induced angiogenesis in vivo and in vitro. AngII: angiotensin II; EC: endothelial cell; PTEN: phosphatase and tensin homolog; STAT3: signal transducer and activator of transcription 3 [Color figure can be viewed at wileyonlinelibrary.com]

References

    1. Banerjee, K. , & Resat, H. (2016). Constitutive activation of STAT3 in breast cancer cells: A review. International Journal of Cancer, 138, 2570–2578. 10.1002/ijc.29923 - DOI - PMC - PubMed
    1. Beak, J. Y. , Kang, H. S. , Huang, W. , Myers, P. H. , Bowles, D. E. , Jetten, A. M. , & Jensen, B. C. (2019). The nuclear receptor RORα protects against angiotensin II‐induced cardiac hypertrophy and heart failure. American Journal of Physiology. Heart and Circulatory Physiology, 316, H186–H200. - PMC - PubMed
    1. Bhat, T. A. , Nambiar, D. , Tailor, D. , Pal, A. , Agarwal, R. , & Singh, R. P. (2013). Acacetin inhibits in vitro and in vivo angiogenesis and downregulates Stat signaling and VEGF expression. Cancer Prevention Research, 6, 1128–1139. 10.1158/1940-6207.capr-13-0209 - DOI - PMC - PubMed
    1. Brands, M. W. , Banes‐Berceli, A. K. , Inscho, E. W. , Al‐Azawi, H. , Allen, A. J. , & Labazi, H. (2010). Interleukin 6 knockout prevents angiotensin II hypertension: Role of renal vasoconstriction and janus kinase 2/signal transducer and activator of transcription 3 activation. Hypertension, 56, 879–884. https://doi.org/hypertensionaha.110.158071 - PMC - PubMed
    1. Chen, N. , Feng, L. , Qu, H. , Lu, K. , Li, P. , Lv, X. , & Wang, X. (2018). Overexpression of IL‐9 induced by STAT3 phosphorylation is mediated by miR‐155 and miR‐21 in chronic lymphocytic leukemia. Oncology Reports, 39, 3064–3072. 10.3892/or.2018.6367 - DOI - PubMed

Publication types

MeSH terms

LinkOut - more resources