. 2019 Mar 1;75(Pt 3):242-261.
doi: 10.1107/S2059798319003528. Epub 2019 Mar 19.

How best to use photons

Affiliations

How best to use photons

Graeme Winter et al. Acta Crystallogr D Struct Biol. .

Abstract

Strategies for collecting X-ray diffraction data have evolved alongside beamline hardware and detector developments. The traditional approaches for diffraction data collection have emphasised collecting data from noisy integrating detectors (i.e. film, image plates and CCD detectors). With fast pixel array detectors on stable beamlines, the limiting factor becomes the sample lifetime, and the question becomes one of how to expend the photons that your sample can diffract, i.e. as a smaller number of stronger measurements or a larger number of weaker data. This parameter space is explored via experiment and synthetic data treatment and advice is derived on how best to use the equipment on a modern beamline. Suggestions are also made on how to acquire data in a conservative manner if very little is known about the sample lifetime.

Keywords: data analysis; data collection; data processing; radiation damage.


Figures

Figure 1
Figure 1
Merging statistics for 12 comparable data sets from three samples (A, left; B, middle; C, right) where the total number of scattered photons was kept approximately constant while the transmission and total rotation range varied to assess the effects on the total data quality.
Figure 2
Figure 2
Merging statistics for thaumatin data sets recorded with transmissions from formula image 
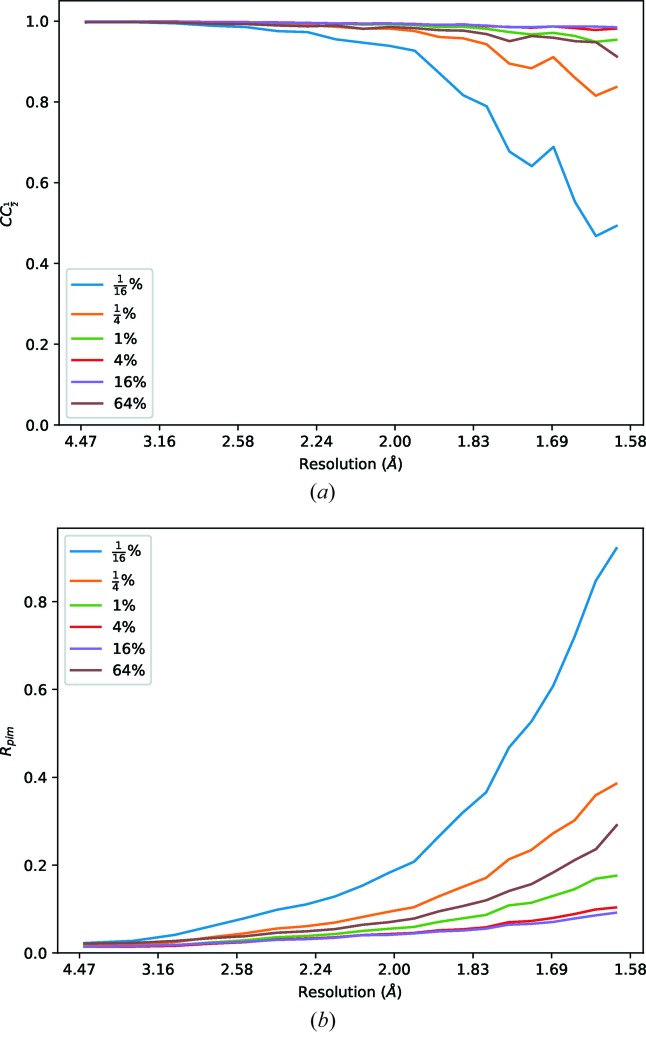
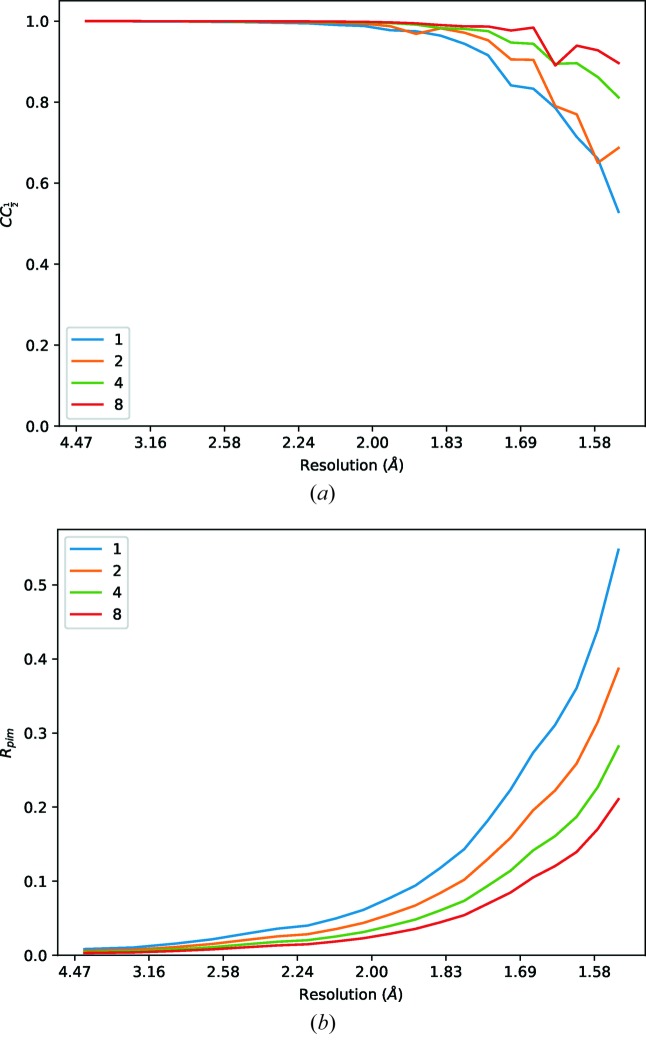
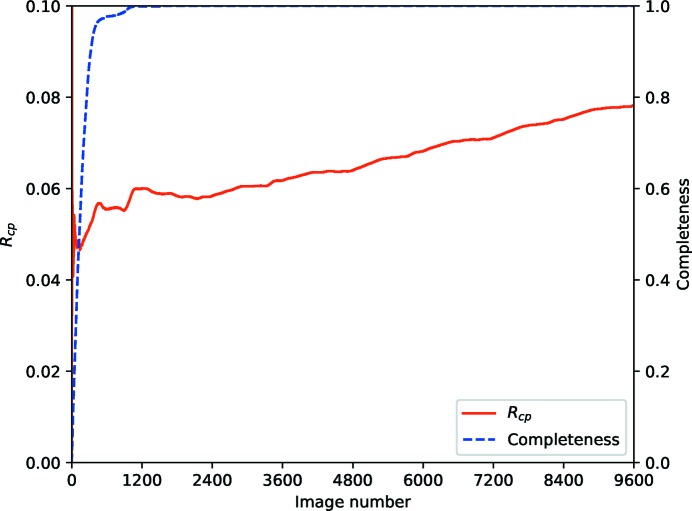
to 64%, processed to a fixed resolution of 1.6 Å. Clearly the weakest of these data are suffering from poor precision in the intensity measurements, which rapidly improve as a greater dose is applied. There is, however, a point of diminishing returns between 1 and 16% where radiation damage becomes a greater factor in data quality than counting statistics.
Figure 3
Figure 3
Difference maps (rendered at 3σ) derived from thaumatin data, showing the tartrate molecule from the crystallization conditions, for data recorded with transmission from formula image 
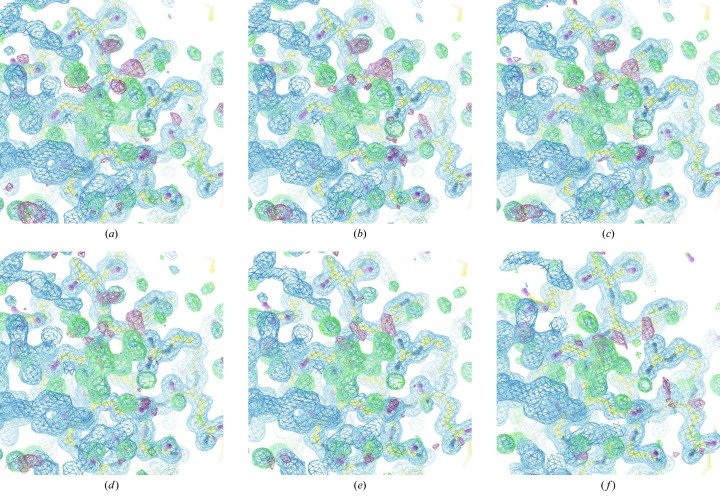
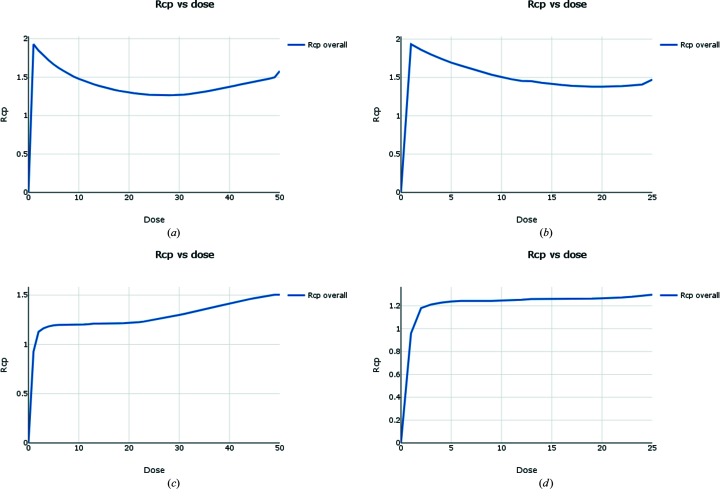
to 64%. Signs of radiation damage are clearly visible in the electron density in the last of these data sets. Of particular interest is the similarity in the maps (b)–(e): by eye there is very little difference in the maps despite the factor of 64 difference in transmission used.
Figure 4
Figure 4
Examples of a digitally attenuated diffraction spot for transmissions 1 to 4−5, and a scheme showing the mechanism for digitally attenuating data in place, for a transmission factor T. The command line for running DIALS implementation included in Appendix D in the Supporting Information.
Figure 5
Figure 5
Merging statistics for data derived from the first insulin crystal, with digital transmission applied. The data are indexed by the transmission factor from 1 to formula image 
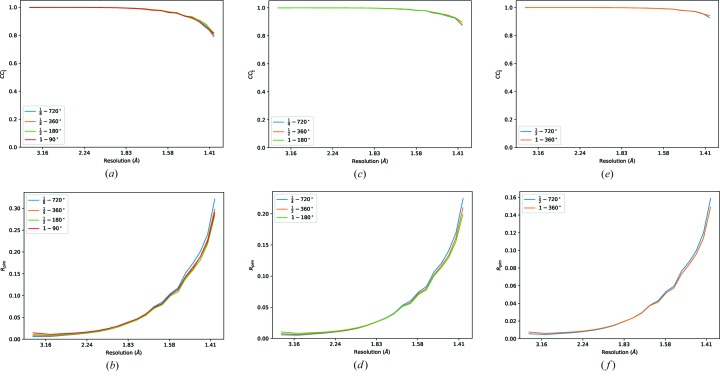
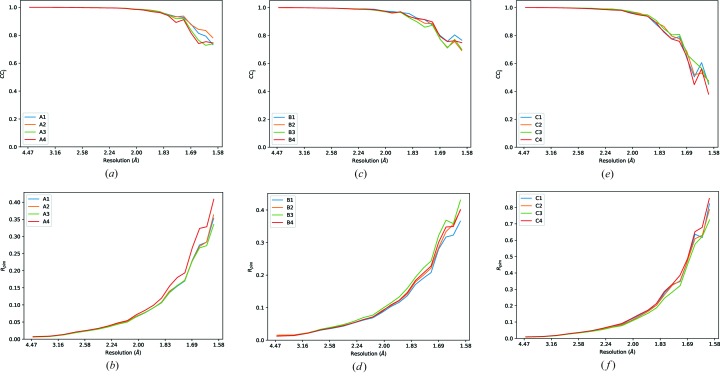
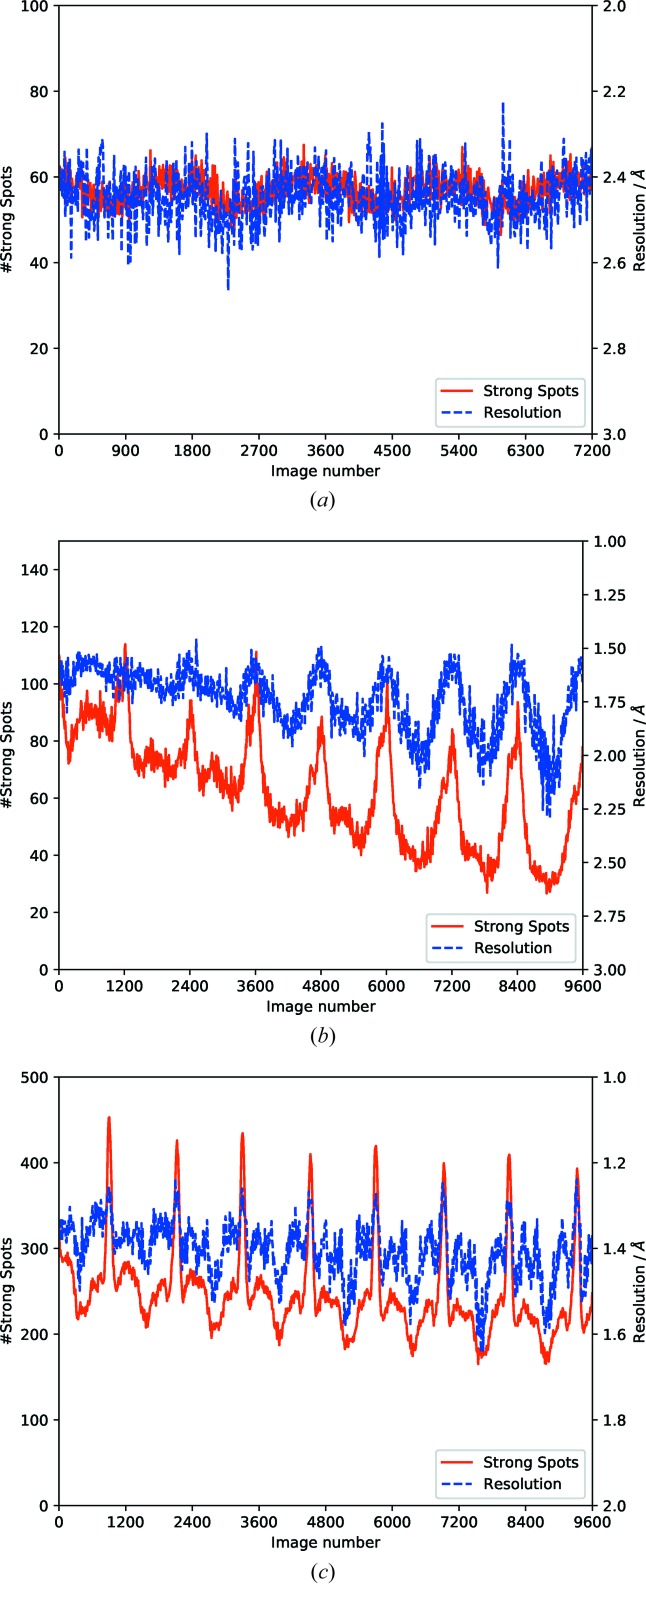
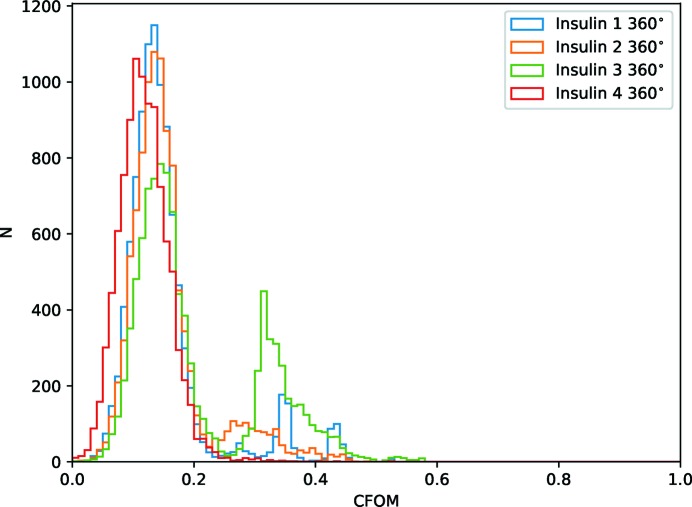
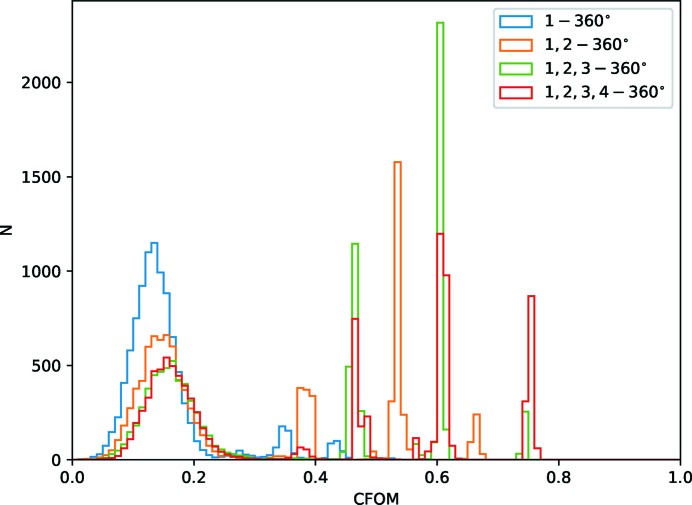
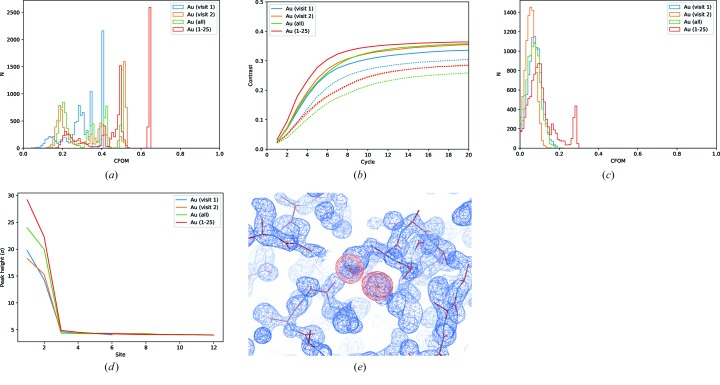
(i.e. equivalent photon flux from 3.1 × 1011 to 3.9 × 1010 photons s−1) and the total rotation included (i.e. all 720°, first 360°, 180° and 90° of the data). Data sets included in each plot are in principle comparable, as the product of the rotation and transmission factor is constant.
Figure 6
Figure 6
Histograms of combined figure of merit (CFOM = CCall + CCweak) from SHELXD for 10 000 trials for comparison data sets with formula image 
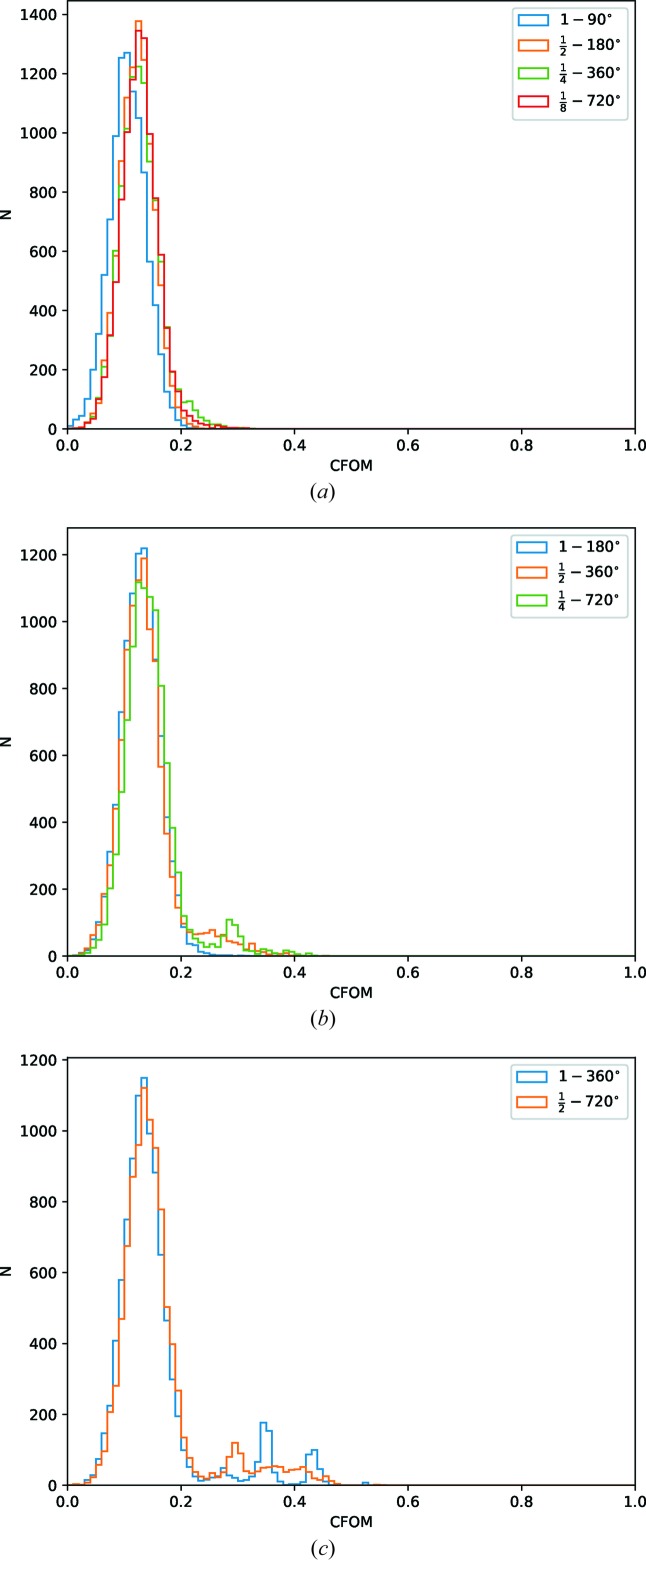
original total photon count (a) formula image (b) and formula image (c).
Figure 7
Figure 7
Resolution (derived from CC1/2 ≃ 0.5) versus total counts for digitally attenuated cubic insulin data, for attenuations in the range 0.0244% to 100%. The corresponding resolution limits increase from 2.15 to 1.29 Å.
Figure 8
Figure 8
Merging statistics for weak thermolysin data sets, for one, two, four and eight double rotations (i.e. 720° data sets) at very low transmission.
Figure 9
Figure 9
R merge versus frame number for 8 × 720° data sets, showing a steady increase in the statistic alongside a periodic variation due to illuminated volume.
Figure 10
Figure 10
Number of strong spots (red), and estimated resolution (blue), found per image for a number of different samples with varying degrees of radiation damage. (a) The first sweep of the weak thermolysin data; though there are some details resulting from the unit-cell dimensions and changes in illuminated volume, the overall trend is level. (b) A sample of BRD4, deliberately radiation damaged to indicate the fall off in resolution (blue) and number of strong spots (red). The sinusoidal pattern results from variations in illuminated volume. (c) A sample of CDK2, showing a less severe decrease in the strength of diffraction. Once again the ‘shape’ of the curve of strong spots depends on the sample morphology and unit cell.
Figure 11
Figure 11
R merge versus batch (top) and R d (bottom) for the CDK2 sample, showing clear signs of radiation damage though no suggestion of the point in the data set where this becomes significant.
Figure 12
Figure 12
R cp and completeness versus batch for the first sweep of weak thermolysin data from Section 4, showing that essentially complete data are present after about 1800 images, and no increase in R cp throughout the data set.
Figure 13
Figure 13
R cp and completeness versus batch for CDK2, showing complete data after around 1200 images but substantial increases in the R cp statistic after 2400 images (360°).
Figure 14
Figure 14
Histograms of combined figure of merit (CFOM = CCall + CCweak) from SHELXD for 10 000 trials for the first 360° from each of the four insulin crystals. Despite similar merging statistics, the trials for crystal 3 were much more successful than crystal 4.
Figure 15
Figure 15
Histograms of combined figure of merit (CFOM = CCall + CCweak) from SHELXD for 10 000 trials for the first 360° from crystal 1, 1 + 2, 1 + 2 + 3 and 1 + 2 + 3 + 4. As may be expected from the merging statistics, the data from two, three and four crystals give increasingly successful substructure determination.
Figure 16
Figure 16
R cp versus dose (image number) for Au derivatives of proteinase K, under the assumption that the dose per image is constant across all crystals. (a) Data from the first beamline visit display signs of radiation damage after around 25–30 images. (b) Data from the second beamline visit display no obvious signs of radiation damage in the plot of R cp versus dose (image number). (c) Combined data from both beamline visits. A plot of R cp versus dose (image number) indicates possible radiation damage after around 25 images. (d) Combined data from both beamline visits, using only the first 25 images from each data set. The plot of R cp versus dose (image number) displays no obvious sign of radiation damage.
Figure 17
Figure 17
Experimental phasing results for Au derivatives of proteinase K. (a) Histograms of combined figure of merit (CFOM = CCall + CCweak) from SIRAS substructure determination with SHELXD for 10 000 trials, with data from two separate visits individually and combined. (b) Map contrast versus cycle number for density modification with SHELXE. Solid lines indicate the best hand, while dashed lines correspond to the inverted hand. (c) Histograms of combined figure of merit (CFOM = CCall + CCweak) from SAD substructure determination with SHELXD for 10 000 trials, with data from two separate visits individually and combined. (d) Anomalous peak heights calculated with ANODE. (e) The density-modified (blue) and heavy-atom substructure (orange) phases, contoured at 3σ, and poly-Ala traced model output by SHELXE after substructure solution with SIRAS.

References

    1. Adams, P. D., Afonine, P. V., Bunkóczi, G., Chen, V. B., Davis, I. W., Echols, N., Headd, J. J., Hung, L.-W., Kapral, G. J., Grosse-Kunstleve, R. W., McCoy, A. J., Moriarty, N. W., Oeffner, R., Read, R. J., Richardson, D. C., Richardson, J. S., Terwilliger, T. C. & Zwart, P. H. (2010). Acta Cryst. D66, 213–221. - PMC - PubMed
    1. Assmann, G., Brehm, W. & Diederichs, K. (2016). J. Appl. Cryst. 49, 1021–1028. - PMC - PubMed
    1. Axford, D., Owen, R. L., Aishima, J., Foadi, J., Morgan, A. W., Robinson, J. I., Nettleship, J. E., Owens, R. J., Moraes, I., Fry, E. E., Grimes, J. M., Harlos, K., Kotecha, A., Ren, J., Sutton, G., Walter, T. S., Stuart, D. I. & Evans, G. (2012). Acta Cryst. D68, 592–600. - PMC - PubMed
    1. Barty, A., Kirian, R. A., Maia, F. R. N. C., Hantke, M., Yoon, C. H., White, T. A. & Chapman, H. (2014). J. Appl. Cryst. 47, 1118–1131. - PMC - PubMed
    1. Diederichs, K. (2006). Acta Cryst. D62, 96–101. - PubMed