. 2019 Mar 25;62(3):543-553.
doi: 10.1044/2018_JSLHR-S-ASTM-18-0283.

Functional Logistic Mixed-Effects Models for Learning Curves From Longitudinal Binary Data

Affiliations

Functional Logistic Mixed-Effects Models for Learning Curves From Longitudinal Binary Data

Giorgio Paulon et al. J Speech Lang Hear Res. .

Abstract

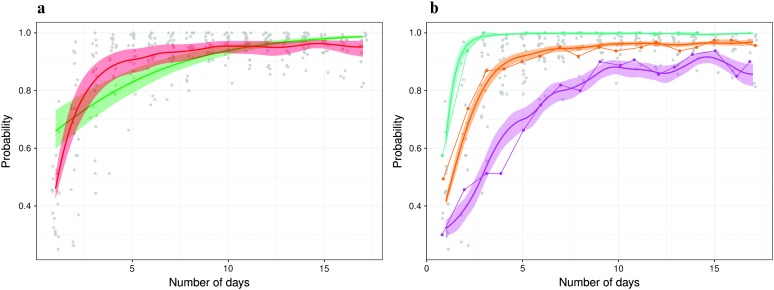
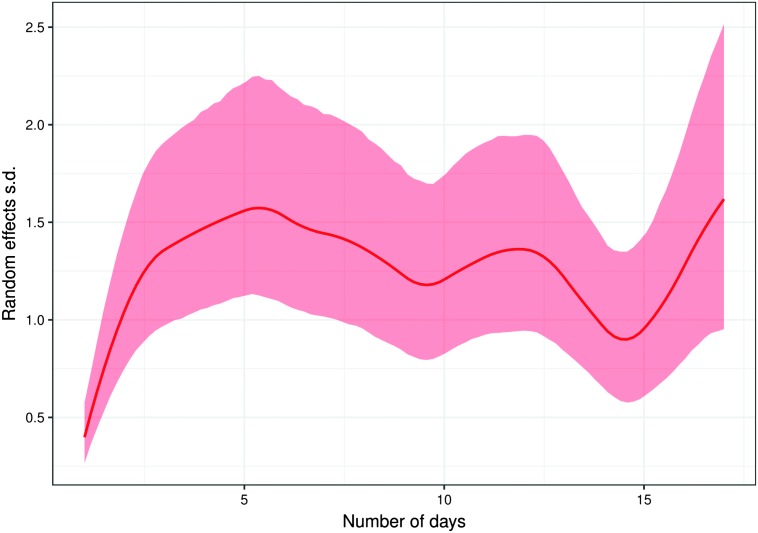
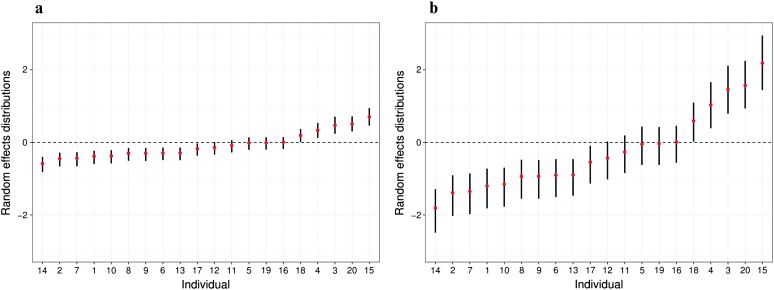
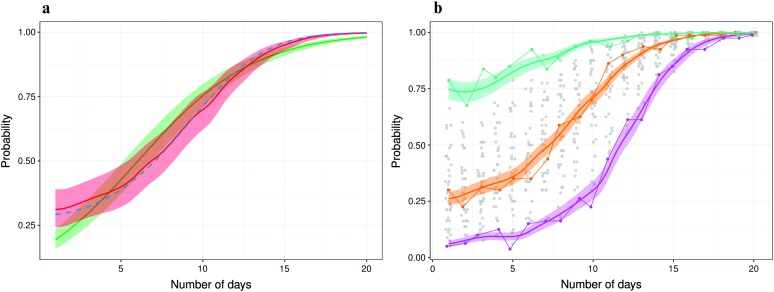
Purpose We present functional logistic mixed-effects models (FLMEMs) for estimating population and individual-level learning curves in longitudinal experiments. Method Using functional analysis tools in a Bayesian hierarchical framework, the FLMEM captures nonlinear, smoothly varying learning curves, appropriately accommodating uncertainty in various aspects of the analysis while also borrowing information across different model layers. An R package implementing our method is available as part of the Supplemental Materials . Results Application to speech learning data from Reetzke, Xie, Llanos, and Chandrasekaran (2018) and a simulation study demonstrate the utility of FLMEM and its many advantages over linear and logistic mixed-effects models. Conclusion The FLMEM is highly flexible and efficient in improving upon the practical limitations of linear models and logistic linear mixed-effects models. We expect the FLMEM to be a useful addition to the speech, language, and hearing scientist's toolkit. Supplemental Material https://doi.org/10.23641/asha.7822568.


Figures

Figure 1.
Figure 1.
A graphical illustration of the Bayesian inferential regime: the prior (blue), the likelihood (red), and the posterior (green). The dotted line marks the posterior mean. The shaded region shows a 95% credible interval.
Figure 2.
Figure 2.
Subject-by-day empirical learning curves (n = 20) from the speech training task. The gray region at the top shows the mean accuracy level, along with its standard error limits, for native Chinese participants (target criterion for learners); the dashed gray line at the bottom indicates accuracy of categorizing an input tone into one of four categories purely by random guess (25%). The emphasized black line shows the trajectory of a representative participant across time.
Figure 3.
Figure 3.
Population probability curve π(t) and its 95% confidence interval estimated by a linear mixed-effects model applied to the empirical success probabilities in the speech learning experiment (blue) superimposed over estimates obtained by fitting a logistic linear mixed-effects model (green).
Figure 4.
Figure 4.
(a) Estimated population probability curve π(t) by the logistic linear mixed-effects model (LMEM) method with (green) and without correction (blue). The shaded areas are the 95% confidence intervals for the mean function π(t). (b) Individual specific probability curves for three individuals and their 95% confidence intervals using the LMEM.
Figure 5.
Figure 5.
(a) Estimated population probability curves π(t). The solid lines represent the estimates according to the logistic linear mixed-effects model (green) and the functional logistic mixed-effects model (FLMEM; red). The shaded areas are the 95% credible/confidence intervals for the mean function π(t). (b) Individual specific probability curves for three individuals and their 95% credible intervals, obtained using the FLMEM.
Figure 6.
Figure 6.
The random effects standard deviation σu(t) and its 95% credible intervals.
Figure 7.
Figure 7.
Posterior means (red dots) and 95% credible intervals (black lines) of the random effects ui arranged in increasing order of magnitude at time t = 1 (a) and t = 10 (b).
Figure 8.
Figure 8.
Results for simulated data. (a) Estimated population probability curves π(t) superimposed over the truth (blue dashed line). The solid lines represent the estimates according to the logistic linear mixed-effects model (green) and the functional logistic mixed-effects model (FLMEM; red). The shaded areas are the 95% credible/confidence intervals for the mean function π(t). (b) Individual specific probability curves for three individuals and their 95% credible intervals, obtained using the FLMEM.
Figure 9.
Figure 9.
Results for simulated data. (a) Posterior means (red dots) and 95% credible intervals of the random effects ui at t = 1, arranged in increasing order of magnitude. (b) Marginal posterior distribution for the random effects standard deviation σu(t) and its credible intervals. The blue dashed line represents the true value.

References

    1. Agresti A. (2002). Categorical data analysis (2nd ed.). New York, NY: Wiley-Interscience.
    1. Anderson S., White-Schwoch T., Choi H. J., & Kraus N. (2014). Partial maintenance of auditory-based cognitive training benefits in older adults. Neuropsychologia, 62, 286–296. - PMC - PubMed
    1. Anderson S., White-Schwoch T., Parbery-Clark A., & Kraus N. (2013). Reversal of age-related neural timing delays with training. Proceedings of the National Academy of Sciences, 110(11), 4357–4362. - PMC - PubMed
    1. Bates D., Maechler M., Bolker B., & Walker S. (2014). Package lme4: Linear-mixed effects models using Eigen and S4. R Package Version 67.
    1. Berger J., & Delampady M. (1987). Testing precise hypotheses. Statistical Science, 3, 317–352.

Publication types

LinkOut - more resources