. 2019 Jan 1:2019:baz046.
doi: 10.1093/database/baz046.

PanglaoDB: a web server for exploration of mouse and human single-cell RNA sequencing data

Affiliations

PanglaoDB: a web server for exploration of mouse and human single-cell RNA sequencing data

Oscar Franzén et al. Database (Oxford). .

Abstract

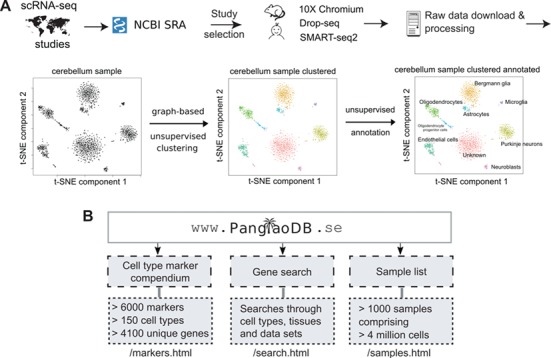
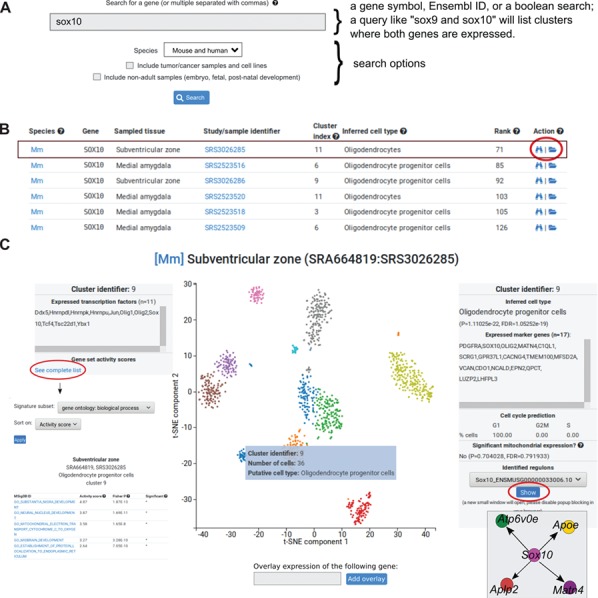
Single-cell RNA sequencing is an increasingly used method to measure gene expression at the single cell level and build cell-type atlases of tissues. Hundreds of single-cell sequencing datasets have already been published. However, studies are frequently deposited as raw data, a format difficult to access for biological researchers due to the need for data processing using complex computational pipelines. We have implemented an online database, PanglaoDB, accessible through a user-friendly interface that can be used to explore published mouse and human single cell RNA sequencing studies. PanglaoDB contains pre-processed and pre-computed analyses from more than 1054 single-cell experiments covering most major single cell platforms and protocols, based on more than 4 million cells from a wide range of tissues and organs. The online interface allows users to query and explore cell types, genetic pathways and regulatory networks. In addition, we have established a community-curated cell-type marker compendium, containing more than 6000 gene-cell-type associations, as a resource for automatic annotation of cell types.


Figures

Figure 1
Figure 1
Overview of the database and features. (A) Data from selected single cell RNA sequencing experiments were downloaded from NCBI SRA and filtered according to a number of different criteria. Only mouse and human data were included. The bulk of the data came from three scRNA-seq platforms/protocols (10X Chromium, Drop-seq and SMART-seq2). Data were processed in a standardized bioinformatics pipeline. The example shows the sample SRS3059959 from mouse cerebellum. Analyses were conducted on the final processed data, and files were uploaded to PanglaoDB. (B) The three entry points of PanglaoDB are (i) the cell marker compendium, (ii) the gene search function and (iii) the sample list.
Figure 2
Figure 2
Data analysis visualization interface. (A) The search window box is one of the primary entry points to the data. Genes are queried using their gene symbols. The search function also recognizes any non-ambiguous gene aliases. Multiple genes can be separated by commas. (B) Partial search results from a query for Sox10 (first six rows shown). Each row represents one cell cluster where the gene is expressed. Columns correspond to the following: species (Mm = mouse, Hs = human), gene symbol, sampled tissue, study/sample identifier, cluster index (each sample is clustered and clusters are identified by their corresponding 0-indexed identifier), the inferred cell type of the cluster, gene expression is shown as ranks, and actions. The folder icon (indicated with a red circle) will open a more detailed view of the dataset where the cell cluster is located. (C) The interactive view, showing the 2D projection from t-SNE of one dataset (SRS3026285) from the subventricular zone. Colors correspond to clusters. Hovering the mouse over a cluster will open a transient window (blue box) with three rows: cluster identifier, number of cells in the cluster and putative cell type. When clicking on the cluster, the left and right boxes will open. The left box shows the number of expressed transcription factors in the selected cluster (the example lists 11 transcription factors in cluster 9). To explore gene set activities, the blue link can be clicked and a separate window will open. The right boxes shows the inferred cell type of the cluster (in the example, Oligodendrocyte progenitor cells), a P value from a hypergeometric test and a computed false discovery rate. Expressed marker genes are indicated in the box. Below boxes indicate number of cells in three phases of the cell cycle. The final box can be used to explore regulons.

References

    1. Kolodziejczyk A.A., Kim J.K., Svensson V. et al. (2015) The technology and biology of single-cell RNA sequencing. Mol. Cell., 58, 610–620. - PubMed
    1. Islam S., Zeisel A., Joost S. et al. (2014) Quantitative single-cell RNA-seq with unique molecular identifiers. Nat. Methods, 11, 163–166. - PubMed
    1. Bacher R. and Kendziorski C. (2016) Design and computational analysis of single-cell RNA-sequencing experiments. Genome Biol., 17, 63. - PMC - PubMed
    1. Macosko E.Z., Basu A., Satija R. et al. (2015) Highly parallel genome-wide expression profiling of individual cells using Nanoliter droplets. Cell, 161, 1202–1214. - PMC - PubMed
    1. Picelli S., Faridani O.R., Björklund Å.K. et al. (2014) Full-length RNA-seq from single cells using smart-seq2. Nat. Protoc., 9, 171–181. - PubMed

Publication types

LinkOut - more resources