

Socioeconomic Gradients and Distribution of Diabetes, Hypertension, and Obesity in India
- PMID: 30951154
- PMCID: PMC6450330
- DOI: 10.1001/jamanetworkopen.2019.0411
Socioeconomic Gradients and Distribution of Diabetes, Hypertension, and Obesity in India
Abstract
Importance: Cardiovascular disease and risk factors represent a major and increasing burden of death and disability in India, although socioeconomic aspects have been debated in recent years.
Objective: To conduct a comprehensive equity analysis of the socioeconomic gradients and distribution of diabetes, hypertension, and obesity in India using the latest national data set.
Design, setting, and participants: Cross-sectional study of data originating from the fourth Indian National Family Health Survey collected from January 20, 2015, to December 4, 2016. The study population was based on a nationally representative cross-sectional sample of women aged 15 to 49 years and men aged 15 to 54 years in India, with a response rate of 97% and 92% among eligible women and men, respectively. Biomarker sampling of survey respondents captured height, weight, blood pressure, and random blood glucose levels. Markers of socioeconomic status (SES) were household wealth, education, and social caste. Descriptive analyses and logistic regression models that account for multistage survey design and sampling weights were estimated.
Main outcomes and measures: Diabetes, hypertension, and obesity assessed by predetermined thresholds based on biomarker sampling or current medication were the primary outcomes.
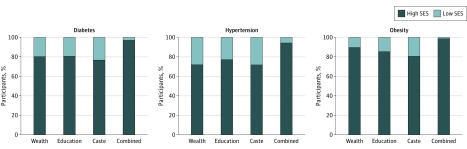
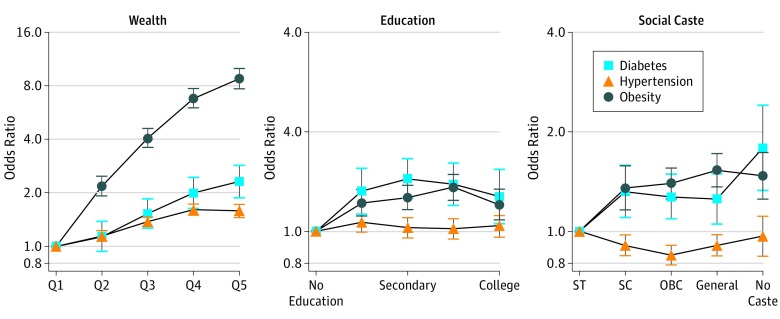
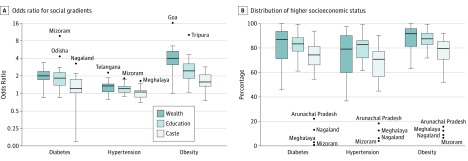
Results: The survey covered 757 958 individuals (weighted prevalence of 51.2% female). The overall prevalence of diabetes, hypertension, and obesity in the sample was 2.9%, 14.4% and 9.7%, respectively. Positive socioeconomic gradients were observed by household wealth, education, and social caste, and in a majority of states. The magnitude of the SES gradient was strongest for obesity (adjusted odds ratio for highest SES quintile vs lowest, 8.76; 95% CI, 7.70-9.95), followed by diabetes (adjusted odds ratio, 2.31; 95% CI, 1.88-2.85) and hypertension (adjusted odds ratio, 1.58; 95% CI, 1.45-1.72) (P < .001 for all associations). Analyses of the socioeconomic distribution indicated that between 70% and 90% of the population burden of diabetes, hypertension, and obesity was among the higher SES groups, and this figure was similar across states.
Conclusions and relevance: Cardiovascular risk factors have an uneven distribution in India. Prevention and treatment strategies should reflect the distribution of the risk factor burden.
Conflict of interest statement
Figures
Comment in
-
Chronic Diseases in India-Ubiquitous Across the Socioeconomic Spectrum.JAMA Netw Open. 2019 Apr 5;2(4):e190404. doi: 10.1001/jamanetworkopen.2019.0404. JAMA Netw Open. 2019. PMID: 30951150 No abstract available.
References
Publication types
MeSH terms
LinkOut - more resources
Full Text Sources
Medical
