. 2019 Apr 5;14(4):e0214110.
doi: 10.1371/journal.pone.0214110. eCollection 2019.

The Gag protein PEG10 binds to RNA and regulates trophoblast stem cell lineage specification

Affiliations

The Gag protein PEG10 binds to RNA and regulates trophoblast stem cell lineage specification

Mona Abed et al. PLoS One. .

Abstract

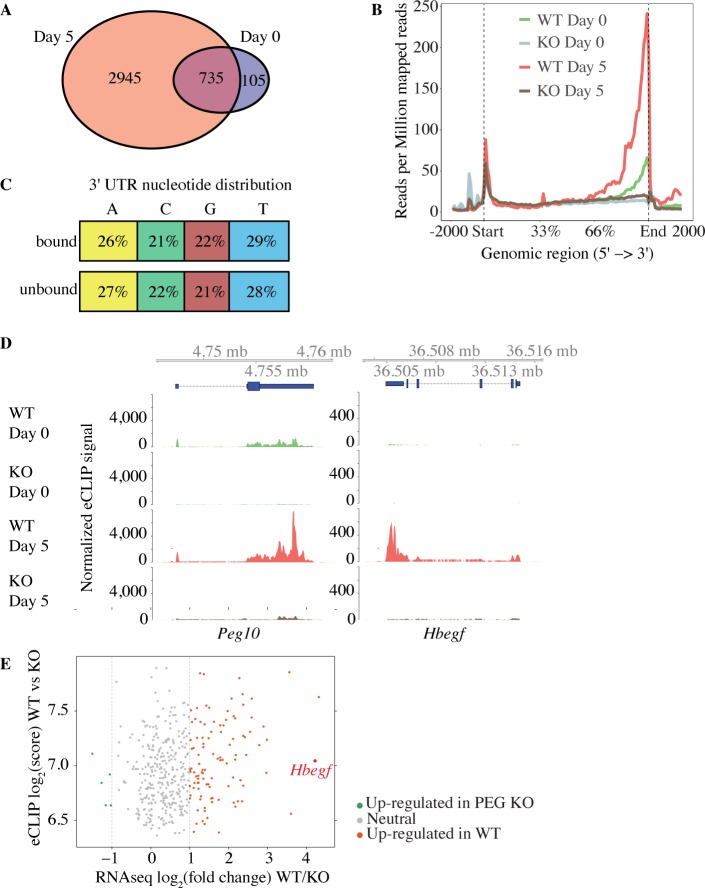
Peg10 (paternally expressed gene 10) is an imprinted gene that is essential for placental development. It is thought to derive from a Ty3-gyspy LTR (long terminal repeat) retrotransposon and retains Gag and Pol-like domains. Here we show that the Gag domain of PEG10 can promote vesicle budding similar to the HIV p24 Gag protein. Expressed in a subset of mouse endocrine organs in addition to the placenta, PEG10 was identified as a substrate of the deubiquitinating enzyme USP9X. Consistent with PEG10 having a critical role in placental development, PEG10-deficient trophoblast stem cells (TSCs) exhibited impaired differentiation into placental lineages. PEG10 expressed in wild-type, differentiating TSCs was bound to many cellular RNAs including Hbegf (Heparin-binding EGF-like growth factor), which is known to play an important role in placentation. Expression of Hbegf was reduced in PEG10-deficient TSCs suggesting that PEG10 might bind to and stabilize RNAs that are critical for normal placental development.


Conflict of interest statement

Authors MA, EV, HB, PL, DSK, RR, SK, JDW, SG, MR, KRA, RJN, MR-G, ZM, KN, and VMD were employees of Genentech. This does not alter our adherence to PLOS ONE policies on sharing data and materials. All reagents generated at Genentech will be available through the Genentech MTA program. There are no patents, products in development or marketed products to declare.

Figures

Fig 1
Fig 1. PEG10 is a substrate of USP9X.
(A) USP9X interaction network showing all high confidence binding partners connected by solid lines (Saint > 0.9, FDR < 0.05, Avg. Psms > 10). Dotted lines indicate interactions reported in the BioPlex network [42, 43]. Results are representative of 3 independent experiments. (B) Western blots of Peg103xf/+ Usp9Xfl/y Rosa26.CreERT2 ESCs after immunoprecipitation (IP) of USP9X. Epitope-tagged PEG10 was detected with anti-FLAG antibody. Where indicated, ESCs were treated with 4-hydroxytamoxifen (4-OHT) to delete Usp9x. Results are representative of 2 independent experiments. (C) Western blots of ESCs. (D) Geyser plot showing proteins differentially ubiquitinated in Usp9xC1566A/y ESCs versus control Usp9x+/y ESCs (p < 0.05, log2 fold change > 2). Results are representative of 2 independent experiments. (E) Line plot showing the fold-change in abundance of all ubiquitinated PEG10 peptides between Usp9x+/y and Usp9xC1566A/y ESCs. Each grey line corresponds to a unique KGG peptide spectral match peptide. The red line indicates a model-based protein abundance estimate. AUC, area under the curve. (F) Diagram indicating the position of the USP9X-regulated ubiquitination (Ub) sites in PEG10. Triangles depict ubiquitination sites identified only in Usp9xC1566A/y ESCs. Circles depict sites found in Usp9x+/y and Usp9xC1566A/y ESCs. Circle size indicates the extent to which ubiquitination was increased by USP9X inactivation. (G) Western blots of Peg10 3xf/+ Usp9xfl/y Rosa26.CreERT2 ESCs. Where indicated, cells were treated with 10 μM MG-132 for 4 h. Results are representative of 2 independent experiments.
Fig 2
Fig 2. The PEG10 Gag domain generates virus-like particles.
(A) Western blots of HEK293T cells or extracellular vesicles recovered from the culture medium after transfection with VSV-G and increasing amounts of Gag-Pol cDNA. Results are representative of 2 independent experiments. (B) Western blots of extracellular vesicles in panel A after sucrose gradient density centrifugation. The upper blot shows cells transfected with HIV-1 Gag, whereas the lower blot shows cells transfected with PEG10-RF1. We speculate that the faster migrating PEG10-RF1 species is a processed form of the protein. Results are representative of 2 independent experiments. (C) Western blots of VLPs. Results are representative of 3 independent experiments. (D) Electron micrographs of negatively stained VLPs. Scale bar, 20 nm. Results are representative of 2 independent experiments. (E) Western blots of wild-type ESCs and TSCs. Results are representative of 2 independent experiments. (F) Western blots of HEK293T cells ectopically expressing wild-type (WT) mouse PEG10 or a PEG10 frameshift (FS) mutant that can only make PEG10-RF1/2. Results are representative of 2 independent experiments. (G) Western blots of extracellular vesicles shed from WT or PEG10-deficient (KO) TSCs and enriched by differential centrifugation. Results are representative of 5 independent experiments. (H) Western blots of extracellular vesicles shed from WT TSCs and analyzed by sucrose gradient density centrifugation. Results are representative of 2 independent experiments. (I) Electron micrographs of TSC extracellular vesicles after immuno-gold labeling for PEG10. Scale bar, 50 nm.
Fig 3
Fig 3. Proteins interacting with PEG10 in ESCs and TSCs.
(A) PEG10 interaction network showing all high confidence binding partners connected by solid lines (Saint > 0.9, FDR < 0.05, Avg. Psms > 10). Dotted lines indicate interactions reported in the Bioplex interaction network. Proteins co-immunoprecipitated from both TSCs and ESCs are colored red, and those unique to ESCs are green. Results are representative of 3 independent experiments. (B) Western blots before and after immunoprecipitation (IP) of 3xFLAG.PEG10 from knock-in ESCs, or as a control, PEG10-deficient (KO) ESCs. Results are representative of 2 independent experiments.
Fig 4
Fig 4. Expression of PEG10 in mouse tissues.
(A) Western blots of C57BL/6 mouse tissues. Results are representative of 3 independent experiments. (B) Mouse tissue sections immunolabeled for PEG10 (brown). AC, adrenal cortex. AM, adrenal medulla. LN, Labyrinth. T, Trophoblast. DB, decidua basalis. ST, Sertoli cells. LC, Leydig cells. PN, pars nervosa. PI, pars intermedia. PD, pars distalis. Th, thalamus. Hyp, Hypothalamus. Scale bar, 100 μm. Results are representative of 3 independent experiments. (C) Immunofluorescence staining of PEG10 in ESCs or TSCs. Scale bar, 25 μm. Results are representative of 2 independent experiments. (D) Western blots of ESCs and TSCs that were fractionated into cytoplasmic (cyto) and nuclear (nuc) compartments. Results are representative of 3 independent experiments.
Fig 5
Fig 5. PEG10 regulates the differentiation of TSCs.
(A) Western blots of TSCs differentiated in 20% oxygen for the times indicated. Peg10 mRNA expression was determined by quantitative RT-PCR. (B) Micrographs of wild-type (WT) and PEG10-deficient (KO) TSCs. Results are representative of 5 independent experiments. (C) Principal Component Analysis (PCA) of TSC RNA-seq datasets using log2 RPKM values.
Fig 6
Fig 6. Proteomic analysis of wild-type and PEG10-deficient TSCs.
(A and B) Volcano plots of total protein levels (A) or phosphorylation levels at unique phosphosites (B) in wild-type (WT) versus PEG10-deficient (KO) TSCs after 0 and 5 days of differentiation. Results are representative of 3 independent experiments. (C) Venn diagram indicates the total number of proteins identified and quantified by global proteome profiling (GPP) and phosphoproteome profiling (pSTY). (D) Fraction of proteins (GPP) or phosphosites on Ser/Thr/Try (pSTY) with levels changing more than 2-fold (p-value < = 0.05) in PEG10 KO TSCs compared to WT TSCs after 0 and 5 days of differentiation. (E) Western blots of WT and PEG10 KO TSCs after 0 and 9 days of differentiation. (F) Pathways highlighted by the Broad Institute gene set enrichment analysis of proteins with significantly changing phosphorylation levels in PEG10 KO TSCs compared to WT TSCs. (G) Diagram indicates the position of phosphosites in PEG10.
Fig 7
Fig 7. PEG10 binds to RNA.
(A) Venn diagram showing RNA transcripts bound to PEG10 after 0 and 5 days of differentiation under normoxic conditions. (B) Graph indicates the distribution of 5'-end eCLIP reads after immunoprecipitating PEG10 from wild-type (WT) and PEG10-deficient (KO) TSCs. Reads are normalized to sequencing depth. (C) Diagram indicates the percentage distribution of nucleotides in PEG10-bound and unbound 3' UTRs. (D) eCLIP-seq data from WT and PEG10 KO TSCs. Blue boxes at the top indicate the location of the genes. (E) Scatter plot comparing RNA-seq and eCLIP peak scores from WT and PEG10 KO TSCs. Genes are shaded red if they are up-regulated in WT TSCs by RNA-seq (log2 fold change >1 and p-value <0.05), grey if they are unchanged (log2 fold change <1 or >-1), and green if they are down-regulated in WT TSCs (log2 fold change <-1 and p-value <0.05). Results are representative of 2 independent experiments.

References

    1. Platt RN 2nd, Vandewege MW, Ray DA. Mammalian transposable elements and their impacts on genome evolution. Chromosome Res. 2018;26: 25–43. 10.1007/s10577-017-9570-z - DOI - PMC - PubMed
    1. Konkel MK, Batzer MA. A mobile threat to genome stability: The impact of non-LTR retrotransposons upon the human genome. Semin Cancer Biol. 2010;20: 211–221. 10.1016/j.semcancer.2010.03.001 - DOI - PMC - PubMed
    1. Kidwell MG, Lisch D. Transposable elements as sources of variation in animals and plants. Proc Natl Acad Sci U S A. 1997;94: 7704–7711. - PMC - PubMed
    1. Le Rouzic A, Boutin TS, Capy P. Long-term evolution of transposable elements. Proc Natl Acad Sci U S A. 2007;104: 19375–19380. 10.1073/pnas.0705238104 - DOI - PMC - PubMed
    1. Yoder JA, Walsh CP, Bestor TH. Cytosine methylation and the ecology of intragenomic parasites. Trends Genet. 1997;13: 335–340. - PubMed

Publication types

MeSH terms