. 2019 Oct;61(4):512-524.
doi: 10.1165/rcmb.2018-0232OC.

Carbonic Anhydrase Inhibition Ameliorates Inflammation and Experimental Pulmonary Hypertension

Affiliations

Carbonic Anhydrase Inhibition Ameliorates Inflammation and Experimental Pulmonary Hypertension

Hannes Hudalla et al. Am J Respir Cell Mol Biol. 2019 Oct.

Abstract

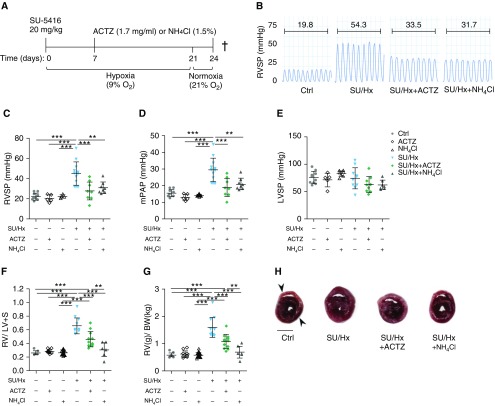
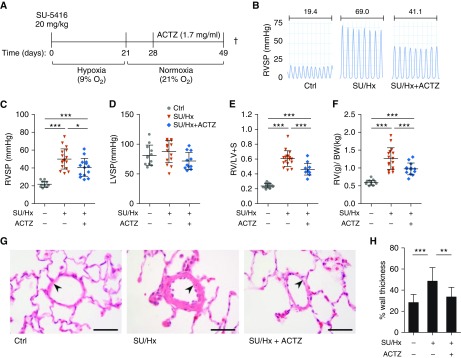
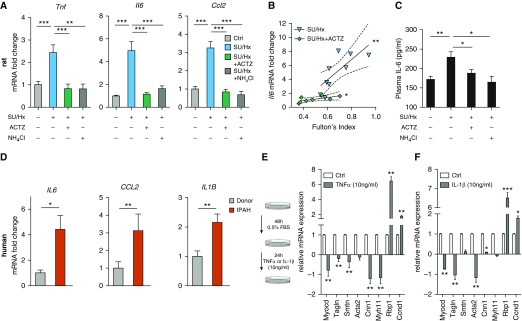
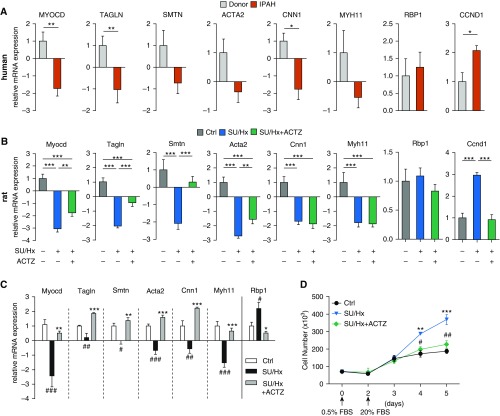
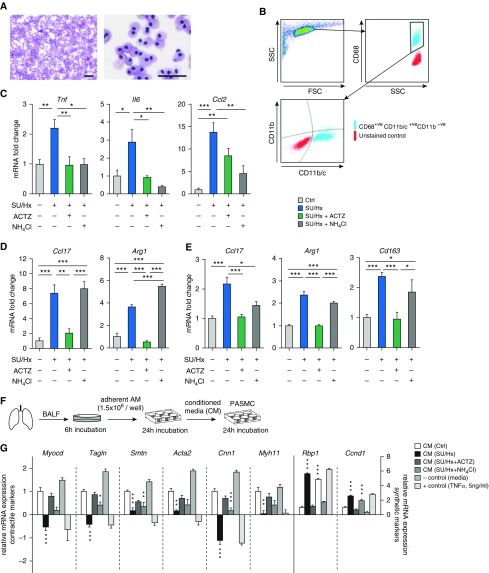
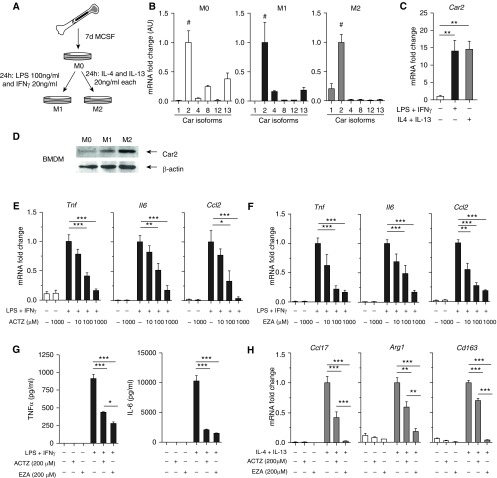
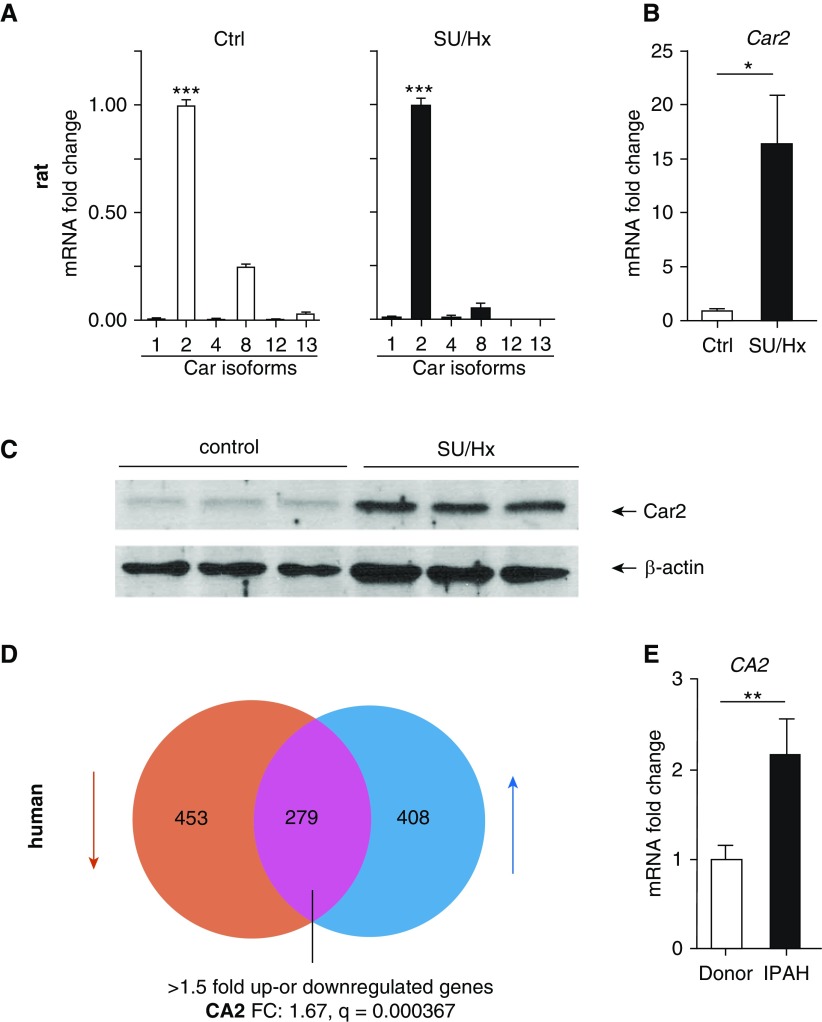
Inflammation and vascular smooth muscle cell (VSMC) phenotypic switching are causally linked to pulmonary arterial hypertension (PAH) pathogenesis. Carbonic anhydrase inhibition induces mild metabolic acidosis and exerts protective effects in hypoxic pulmonary hypertension. Carbonic anhydrases and metabolic acidosis are further known to modulate immune cell activation. To evaluate if carbonic anhydrase inhibition modulates macrophage activation, inflammation, and VSMC phenotypic switching in severe experimental pulmonary hypertension, pulmonary hypertension was assessed in Sugen 5416/hypoxia (SU/Hx) rats after treatment with acetazolamide or ammonium chloride (NH4Cl). We evaluated pulmonary and systemic inflammation and characterized the effect of carbonic anhydrase inhibition and metabolic acidosis in alveolar macrophages and bone marrow-derived macrophages (BMDMs). We further evaluated the treatment effects on VSMC phenotypic switching in pulmonary arteries and pulmonary artery smooth muscle cells (PASMCs) and corroborated some of our findings in lungs and pulmonary arteries of patients with PAH. Both patients with idiopathic PAH and SU/Hx rats had increased expression of lung inflammatory markers and signs of PASMC dedifferentiation in pulmonary arteries. Acetazolamide and NH4Cl ameliorated SU/Hx-induced pulmonary hypertension and blunted pulmonary and systemic inflammation. Expression of carbonic anhydrase isoform 2 was increased in alveolar macrophages from SU/Hx animals, classically (M1) and alternatively (M2) activated BMDMs, and lungs of patients with PAH. Carbonic anhydrase inhibition and acidosis had distinct effects on M1 and M2 markers in BMDMs. Inflammatory cytokines drove PASMC dedifferentiation, and this was inhibited by acetazolamide and acidosis. The protective antiinflammatory effect of acetazolamide in pulmonary hypertension is mediated by a dual mechanism of macrophage carbonic anhydrase inhibition and systemic metabolic acidosis.

Keywords: acetazolamide; acidosis; carbonic anhydrases; lung; macrophages.


Figures

Figure 1.
Figure 1.
Early treatment with acetazolamide (ACTZ) or ammonium chloride (NH4Cl) ameliorates Sugen 5416/hypoxia (SU/Hx)-induced pulmonary hypertension. (A) Experimental timeline, early intervention. Rats were administered an injection with Sugen 5416 (SU; 20 mg/kg s.c.) and housed under hypoxic condition (9% O2) for 3 weeks followed by 3 days under normoxic condition (21% O2). Treatment was administered with ACTZ (1.7 mg/ml) or NH4Cl (1.5%) ad libitum in the drinking water from Day 7 to Day 24. Control rats were treated with either ACTZ or NH4Cl in normoxia for the same time period. This represents the study endpoint when the animals were killed. (B) Representative right ventricular pressure tracings measured on Day 24 and corresponding mean right ventricular systolic pressure (RVSP) in millimeters of mercury. Experimental groups: vehicle-injected normoxic controls (Ctrl), ACTZ- or NH4Cl-treated normoxic controls (ACTZ or NH4Cl), SU/Hx and ACTZ- or NH4Cl-treated SU/Hx animals (SU/Hx + ACTZ and SU/Hx + NH4Cl). (C and D) ACTZ and NH4Cl treatment significantly decreased RVSP and mean pulmonary artery pressure (mPAP). n = 8–21 rats per group. (E) Both interventions had no significant effect on left ventricular systolic pressure (LVSP). n = 8–10 rats per group. (F and G) Right ventricular hypertrophy is significantly ameliorated by both interventions. Right ventricular hypertrophy was assessed by Fulton’s index (ratio of right ventricular weight to left ventricular + septal [S] weight) (F) and as the ratio of right ventricular weight to total body weight (RV/BW) (G). n = 7–23 per group. (H) Representative transverse cross-sections at midpapillary level from the four experimental groups. Right ventricle is indicated by upper arrowhead and left ventricle by lower arrowhead. Scale bar: 5 mm. Statistical analysis by one-way ANOVA and Tukey’s post hoc test. Error bars are mean ± SD (**P < 0.01 and ***P < 0.001). s.c. = subcutaneous.
Figure 2.
Figure 2.
Late treatment with ACTZ partially reverses SU/Hx-induced pulmonary hypertension. (A) Experimental timeline, reversal. Rats were administered injections with SU 5416 (20 mg/kg s.c.) and housed under hypoxic condition (9% O2) for 3 weeks followed by 4 weeks in normoxic condition (21% O2). Treatment was administered with ACTZ (1.7 mg/ml) ad libitum in the drinking water from Day 28 to Day 49. This represents the study endpoint when the animals were killed. (B) Representative right ventricular pressure tracings measured on Day 49 and corresponding mean RVSP in millimeters of mercury. Experimental groups: vehicle-injected normoxic controls (Ctrl), SU/Hx- and ACTZ-treated animals (SU/Hx + ACTZ). (C) ACTZ treatment partially reversed established elevation in RVSP. n = 10–18 rats per group. (D) ACTZ treatment had no significant effect on LVSP. n = 10–15 rats per group. (E and F) ACTZ treatment partially reversed right ventricular hypertrophy. Right ventricular hypertrophy was assessed by Fulton’s index (E) and ratio of RV/BW (F). n = 13–18 per group. (G) Pulmonary vascular remodeling is ameliorated by treatment with ACTZ. Representative images of pulmonary arterioles on hematoxylin and eosin–stained lung sections of Ctrl animals, SU/Hx animals, and SU/Hx animals treated with ACTZ (late intervention, Days 28–49). Scale bars: 50 μm. Arterioles are indicated by arrowheads. (H) Morphometric analysis of pulmonary vascular remodeling assessed by percentage wall thickness. n = 23–40 arterioles (diameter, 50–100 μm) from n = 5 animals per group. Data are presented as mean ± SD. Statistical analysis by Kruskal-Wallis test and Dunn’s post hoc test. (CF) Error bars are mean ± SD. Statistical analysis by one-way ANOVA and Tukey’s post hoc test (*P < 0.05, **P < 0.01, and ***P < 0.001).
Figure 3.
Figure 3.
Early treatment with ACTZ or NH4Cl dampens the pulmonary and systemic inflammatory response in SU/Hx-induced pulmonary hypertension. (A) Significantly increased mRNA levels of the proinflammatory mediators Tnf, Il6, and Ccl2 in whole lungs from SU/Hx animals were seen on Day 24, and treatment with ACTZ or NH4Cl significantly decreased their expression. Data are expressed as mRNA fold change with Ctrl set as 1. n = 5–12 animals per experimental group from the early intervention protocol. Data are presented as mean ± SEM. Statistical analysis by one-way ANOVA and Tukey’s post hoc test. (B) Pulmonary Il6 expression significantly correlated with right ventricular hypertrophy severity, expressed as Fulton’s index in SU/Hx (**) animals and in SU/Hx animals treated with ACTZ (*). Statistical analysis by Spearman’s test. The linear regressions between the two groups (SU/Hx, r2 = 0.56; SU/Hx + ACTZ, r2 = 0.51) differ significantly (*). Data are presented as mRNA fold change (from A) versus Fulton’s index with linear regression (solid line) and 95% confidence interval (dashed line). (C) Circulating plasma IL-6 is elevated in SU/Hx rats, and both ACTZ and NH4Cl treatments decrease IL-6 levels to baseline. IL-6 concentration in pg/ml was measured in plasma by ELISA. n = 3–8 animals per experimental group. Data are presented as mean ± SEM. Statistical analysis by one-way ANOVA and Tukey’s post hoc test. (D) Expression of proinflammatory mediators was upregulated in lungs from patients with idiopathic pulmonary arterial hypertension (IPAH) compared with failed donor lungs (Donor; set as 1). n = 12 patients per group (6 male and 6 female, age matched to ±1 yr). Statistical analysis by Mann-Whitney U test. (E and F) TNF-α treatment (E) and IL-1β treatment (F) lead to pulmonary artery smooth muscle cell (PASMC) dedifferentiation in vitro. Rat pulmonary artery smooth muscle cells were serum deprived (0.5% FBS) for 48 hours followed by stimulation with 10 ng/ml rat TNF-α or IL-1β for 24 hours. Relative mRNA expression of genes associated with the contractile apparatus of smooth muscle was compared with untreated controls set as 1. Markers were either regulatory (Myocd), contractile (Tagln, Smtn, Acta2, Cnn1, Myh11), synthetic (Rbp1), or proliferative (CCND1). Data represent mean ± SEM from n = 3–6 independent experiments. Statistical analysis by Student’s t test (*P < 0.05, **P < 0.01, and ***P < 0.001).
Figure 4.
Figure 4.
ACTZ treatment partially restores PASMC phenotype in the SU/Hx model. (A) Relative expression of PASMC markers representative of a contractile (MYOCD, TAGLN, SMTN, ACTA2, CNN1, MYH11), synthetic (RBP1), and proliferative (CCND1) phenotype in pulmonary arteries from patients with IPAH compared with failed donor control pulmonary arteries (Donor; set as 1). n = 13 donor samples (10 male, 3 female) and n = 10 IPAH samples (6 male, 4 female). Statistical analysis by Mann-Whitney U test. (B) Vascular smooth muscle cell markers in pulmonary artery samples from SU/Hx rats showed a similar pattern of dedifferentiation expression profiles seen in human IPAH. Significant reduction in all contractile markers in SU/Hx animals compared with Ctrl and partial reversal by ACTZ treatment. Upregulation of CCND1 is ameliorated by ACTZ treatment. n = 9–15 per experimental group. Statistical analysis by one-way ANOVA and Tukey’s post hoc test. (C) Primary PASMCs from control, SU/Hx, and SU/Hx + ACTZ animals retained their phenotype in vitro. PASMCs at passage 1 were grown to subconfluence and kept in 0.5% FBS for 48 hours. n = 3–8 cell cultures per group. Significant differences from control (#) and SU/Hx (*) are noted. (D) PASMCs from SU/Hx animals showed a higher rate of proliferation than PASMCs from control or SU/Hx + ACTZ animals. Proliferation was induced after 48 hours in 0.5% FBS by media supplemented with 20% FBS, and cell numbers were determined. n = 6 cell cultures per group. Significant differences on Days 4 and 5 between control and SU/Hx (*) and SU/Hx + ACTZ and SU/Hx (#) are indicated. (AD) Data are presented as mean ± SEM. (C and D) Statistical analysis by one-way ANOVA and Tukey’s post hoc test (*P < 0.05, **P < 0.01, ***P < 0.001, #P < 0.05, ##P < 0.01, and ###P < 0.001).
Figure 5.
Figure 5.
ACTZ alters the activation profile of alveolar macrophages (AMs) in the SU/Hx model. (A) Representative cytospin images of BAL after 6 hours of adherence to tissue culture dishes (>99% of cells are AMs). Scale bars: 50 μm. (B) Flow cytometric analysis of AM-enriched BAL showed a highly pure cell population positive for Cd68 and Cd11c (>99% Cd68+; >90% Cd11b/c+; <10% Cd11b+). (C and D) AMs from SU/Hx animals showed upregulated expression of markers associated with proinflammatory (Tnf, Il6, and Ccl2) (C) and alternatively activated (Ccl17 and Arg1) (D) macrophages. ACTZ and NH4Cl both suppress proinflammatory activation, but only ACTZ modulates markers of alternative activation. n = 4–7 animals per experimental group. (E) Whole-lung gene expression showed a similar pattern of suppression of markers associated with alternative macrophage activation by ACTZ but not by NH4Cl treatment. n = 5–11 animals per experimental group. (F and G) PASMCs were exposed to AM-conditioned media (CM) from the four experimental groups (as outlined in F). Effect of CM from SU/Hx animals on PASMC dedifferentiation as assessed by marker expression (black bars) and effect of in vivo treatment with ACTZ and NH4Cl. Asterisks indicate significant differences compared with control (white bar). Media alone served as a negative control (−control), and 5 ng/ml TNF-α served as a positive control (+control). n = 6 independent experiments. Data are presented as mean ± SEM. Statistical analysis by one-way ANOVA and Tukey’s post hoc test (*P < 0.05, **P < 0.01, and ***P < 0.001). BALF = BAL fluid; FSC = forward scatter; SSC = side scatter.
Figure 6.
Figure 6.
Carbonic anhydrase inhibition suppresses M1 and M2 activation of bone marrow–derived macrophages (BMDMs). (A) Rat bone marrow was harvested, and cells were grown in the presence of macrophage colony-stimulating factor for 7 days. BMDMs were polarized toward M1 with LPS and IFN-γ or M2 with IL-4 and IL-13 for 24 hours. Untreated BMDMs were considered M0. (B) Expression of different carbonic anhydrase isoforms was assessed by qPCR (Car2 expression is set as 1). Carbonic anhydrase 2 (Car2) was the most abundant isoform in M0, M1, and M2 BMDMs (indicated by #). (C and D) Car2 is significantly upregulated in both M1- and M2-polarized BMDMs compared with M0 at both mRNA (C) and protein levels (representative Western blot shown in D). Quantification of four independent experiments in Figure E3A. (E) ACTZ suppresses M1 activation (Tnf, Il6, and Ccl2) of BMDMs in a dose-dependent manner. (F) Ethoxzolamide (EZA) suppresses M1 activation (Tnf, Il6, and Ccl2) of BMDMs in a dose-dependent manner. (G) ACTZ and EZA significantly reduce TNF-α and IL-6 secretion by M1-polarized BMDMs, measured by ELISA in cell culture supernatants. No detectable TNF-α or IL-6 in M0 control macrophage supernatants. (H) ACTZ and EZA suppress M2 activation (Ccl17, Arg1, and Cd163) of BMDMs. (BH) Data represent mean ± SEM from three or four independent experiments. Statistical analysis by one-way ANOVA and Tukey’s post hoc test (*P < 0.05, **P < 0.01, and ***P < 0.001).
Figure 7.
Figure 7.
Car2 is upregulated in AMs of SU/Hx rats and in IPAH lungs. (A) Expression of different carbonic anhydrase isoforms was assessed in AMs from control and SU/Hx animals (Car2 expression is set as 1). Car2 was by far the most abundant isoform. Statistical analysis by one-way ANOVA and Tukey’s post hoc test. ***Significant difference from all other groups. (B) Car2 is upregulated in AMs from SU/Hx animals compared with control. n = 4 animals per group. Statistical analysis by Mann-Whitney U test. (C) Western blots show increased Car2 enzyme in AMs of SU/Hx animals. Each lane represents AMs from a different animal (quantification in Figure E3B). (D) Venn diagram of 1,140 genes that are differentially expressed between PAH and control (failed donor) lungs assessed by Affymetrix gene array (Affy Human Gene ST1.0). n = 58 PAH patient and n = 25 failed donor lungs. Upregulated genes are shown in blue and downregulated genes in red. Expression of 279 genes was greater than 1.5-fold different from donor controls. CA2 was significantly upregulated (1.67-fold) in patients with PAH (q = 0.000367). (E) CA2 upregulation in IPAH patient lungs was validated by qPCR (n = 12 IPAH and n = 12 donor lungs). Statistical analysis by Mann-Whitney U test. Data represent mean ± SEM (*P < 0.05, **P < 0.01, and ***P < 0.001).

Comment in

References

    1. Farber HW, Loscalzo J. Pulmonary arterial hypertension. N Engl J Med. 2004;351:1655–1665. - PubMed
    1. Pugliese SC, Poth JM, Fini MA, Olschewski A, El Kasmi KC, Stenmark KR. The role of inflammation in hypoxic pulmonary hypertension: from cellular mechanisms to clinical phenotypes. Am J Physiol Lung Cell Mol Physiol. 2015;308:L229–L252. - PMC - PubMed
    1. Rabinovitch M, Guignabert C, Humbert M, Nicolls MR. Inflammation and immunity in the pathogenesis of pulmonary arterial hypertension. Circ Res. 2014;115:165–175. - PMC - PubMed
    1. Savai R, Pullamsetti SS, Kolbe J, Bieniek E, Voswinckel R, Fink L, et al. Immune and inflammatory cell involvement in the pathology of idiopathic pulmonary arterial hypertension. Am J Respir Crit Care Med. 2012;186:897–908. - PubMed
    1. Soon E, Holmes AM, Treacy CM, Doughty NJ, Southgate L, Machado RD, et al. Elevated levels of inflammatory cytokines predict survival in idiopathic and familial pulmonary arterial hypertension. Circulation. 2010;122:920–927. - PubMed

Publication types

MeSH terms