. 2019 Apr 4;177(2):361-369.e10.
doi: 10.1016/j.cell.2019.03.029.

Structure of Microbial Nanowires Reveals Stacked Hemes that Transport Electrons over Micrometers

Affiliations

Structure of Microbial Nanowires Reveals Stacked Hemes that Transport Electrons over Micrometers

Fengbin Wang et al. Cell. .

Abstract

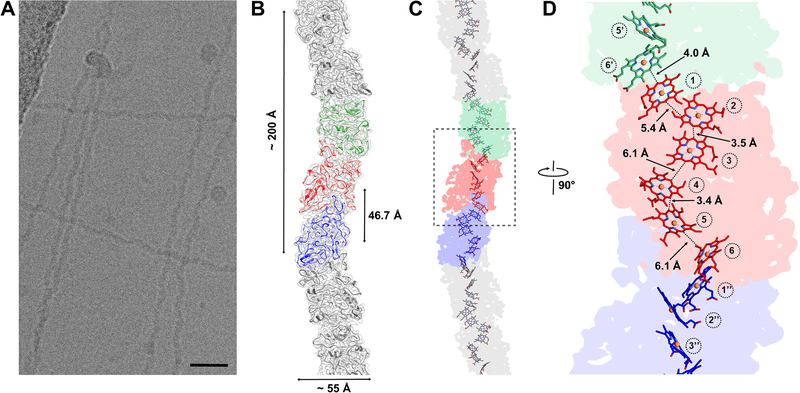
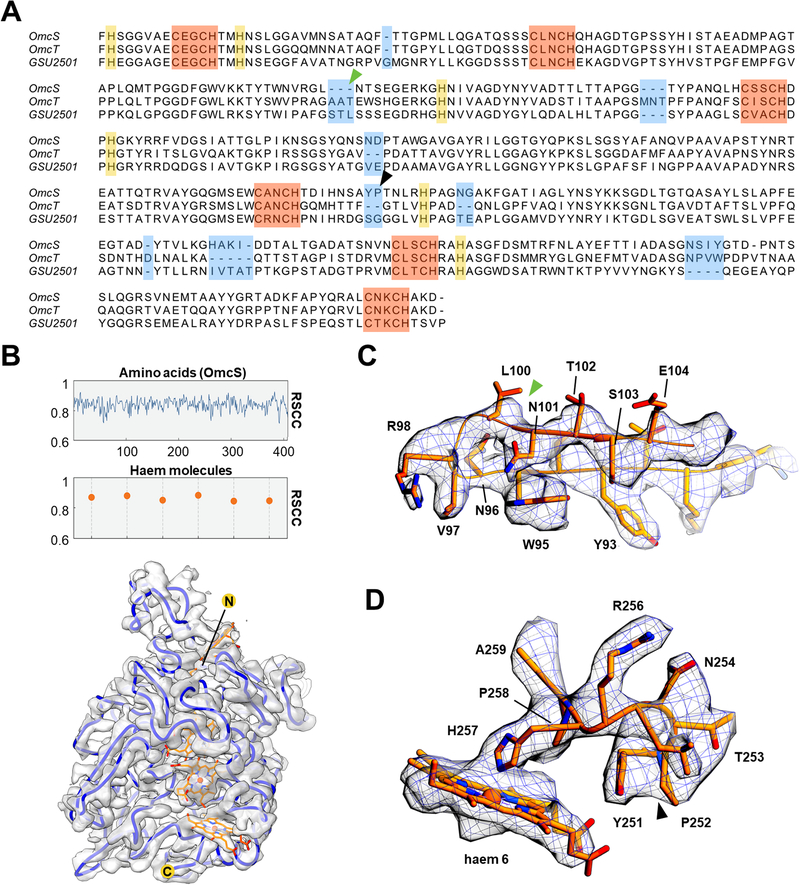
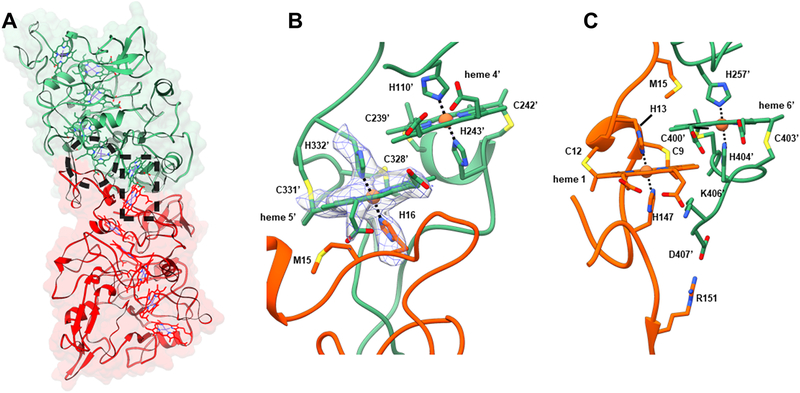
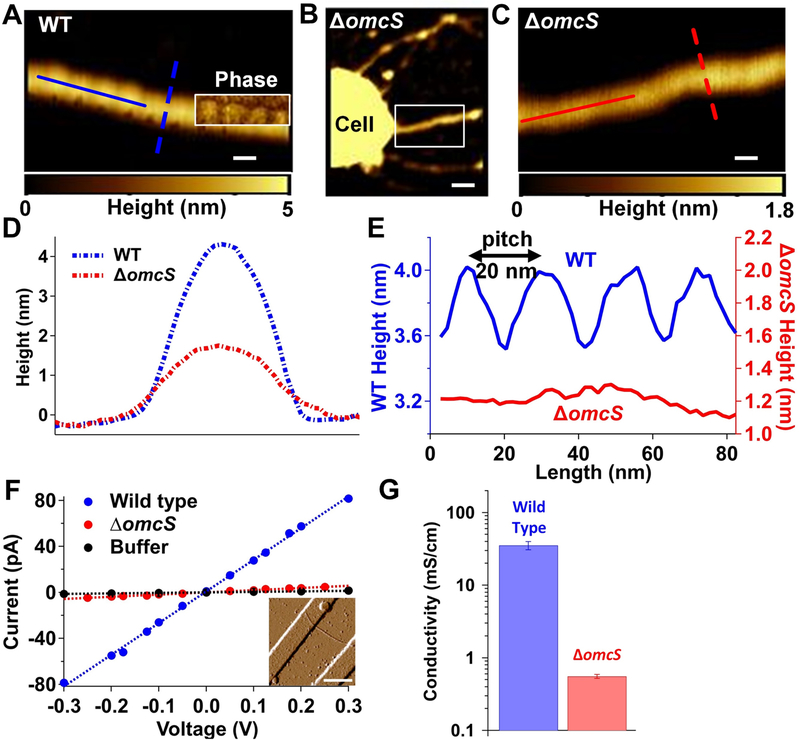
Long-range (>10 μm) transport of electrons along networks of Geobacter sulfurreducens protein filaments, known as microbial nanowires, has been invoked to explain a wide range of globally important redox phenomena. These nanowires were previously thought to be type IV pili composed of PilA protein. Here, we report a 3.7 Å resolution cryoelectron microscopy structure, which surprisingly reveals that, rather than PilA, G. sulfurreducens nanowires are assembled by micrometer-long polymerization of the hexaheme cytochrome OmcS, with hemes packed within ∼3.5-6 Å of each other. The inter-subunit interfaces show unique structural elements such as inter-subunit parallel-stacked hemes and axial coordination of heme by histidines from neighboring subunits. Wild-type OmcS filaments show 100-fold greater conductivity than other filaments from a ΔomcS strain, highlighting the importance of OmcS to conductivity in these nanowires. This structure explains the remarkable capacity of soil bacteria to transport electrons to remote electron acceptors for respiration and energy sharing.

Keywords: Geobacter; atomic force microscopy; bioelectronics; biomaterials; cryoelectron microscopy; cytochromes; electron conductivity; extracellular electron transport; microbial nanowires; protein structure.


Conflict of interest statement

Declaration of Interests

The authors declare no competing interests.

Figures

Fig. 1.
Fig. 1.. Structure of microbial nanowires reveals closely-stacked hemes in an OmcS filament.
(A) Cryo-EM image of the purified wild-type electrically-conductive filaments showing a sinusoidal undulation with a pitch of ~ 200 Å shown in (B). Scale bar for (A), 200 Å. (B) The surface of the reconstruction (transparent gray) with superimposed ribbon models of the OmcS subunits with three subunits in the center in three different colors. (C) Each subunit contains six hemes closely stacked over the micrometer-lengths of the filaments. (D) A zoomed region of the box shown in (C) with the minimum observed edge-to-edge distances indicated between hemes numbered in circles. The distance between two hemes in adjacent subunits (heme 1 and heme 6′) is comparable to the distances between parallel stacked hemes within a subunit (heme 2:heme 3 and heme 4:heme 5).
Fig. 2.
Fig. 2.. De novo atomic model building of OmcS filaments.
(A) Sequence-based alignment of OmcS and two other c-type cytochromes with similar molecular weight detected by mass spectroscopy (Fig. S1B). The six conserved CXXCH motifs responsible for heme binding are highlighted in red. The histidine residues paired with the CXXCH motifs in heme binding are highlighted in yellow. Regions with insertions or deletions compared to the OmcS sequence are highlighted in blue. (B) The per-residue real space correlation coefficient (RSCC) plot of the atomic model against the 3.7 Å cryo-EM map (top), with protein and ligand displayed separately. The protein Cα trace in blue with ligands (bottom), with N- and C-termini labeled. (C) and (D) Zoomed view of the regions indicated in (A) by green and black arrowheads, respectively, with the OmcS atomic model fit into the cryo-EM map. The green arrowhead in (C) indicates the location where the two other cytochromes (OmcT, GSU2501) show a three-residue insertion, not compatible with the map. The black arrowhead in (D) indicates a region where OmcT has a two-residue deletion, and GSU2501 has a serine and glycine rather than the tyrosine and proline found in OmcS. The map has extra density that could not be explained by a two-residue deletion or by serine and glycine.
Fig. 3.
Fig. 3.. Subunit interface interactions within OmcS filament.
(A) The large interface in the filament (~ 2,600 Å2 per subunit) is due to the complementarity between the upper portion of bottom subunit (red) and the lower portion of the top subunit (green). Residues in one subunit strongly interact via hemes shown in the dashed circle and rectangle and corresponding zoomed images are shown in (B) and (C) respectively. (B) Histidine 16 of the bottom subunit is coordinating the iron atom in heme 5′ of the top subunit. The cryo-EM densities corresponding to Histidine 16, Histidine 332’, and heme 5’ are shown in a mesh. (C) The stacking of heme 6′ from a top subunit with heme 1 from the subunit below.
Fig. 4.
Fig. 4.. Electrical measurements show that OmcS is required for filament conductivity.
AFM height image of filaments from (A) WT strain (B) ΔomcS strain and (C) zoomed image of region shown in B. Inset in A is the phase image overlaid on height image that shows the repeating pattern. Scale bars: A, C, 20 nm; B, 100 nm. (D) The height profile for filaments of WT and ΔomcS strains using lateral cross section [dashed lines in (A) and (C)]. (E) Longitudinal height profile for filaments of WT and ΔomcS strain [solid lines in (A) and (C)]. (F) Current-voltage profile for individual filaments of WT and ΔomcS strain compared to buffer alone. Inset: AFM images for filaments by ΔomcS strain across gold electrodes. Scale bar, 500 nm. (G) Comparison of DC conductivity (left) and carrier density (right) for filaments of WT and ΔomcS strains. Error bars represent S.E.M of three biological replicates.

References

    1. Adhikari R, Malvankar N, Tuominen M, and Lovley D (2016). Conductivity of individual Geobacter pili. RSC Advances 6, 8354–8357.
    1. Afkar E, Reguera G, Schiffer M, and Lovley DR (2005). A novel Geobacteraceae-specific outer membrane protein J (OmpJ) is essential for electron transport to Fe (III) and Mn (IV) oxides in Geobacter sulfurreducens. BMC microbiology 5, 41–41. - PMC - PubMed
    1. Ashkenazy H, Abadi S, Martz E, Chay O, Mayrose I, Pupko T, and Ben-Tal N (2016). ConSurf 2016: an improved methodology to estimate and visualize evolutionary conservation in macromolecules. Nucleic Acids Research 44, W344–W350. - PMC - PubMed
    1. Bertini I, Cavallaro G, and Rosato A (2006). Cytochrome c: occurrence and functions. Chemical Reviews 106, 90–115. - PubMed
    1. Cheung M, Kajimura N, Makino F, Ashihara M, Miyata T, Kato T, Namba K, and Blocker AJ (2013). A method to achieve homogeneous dispersion of large transmembrane complexes within the holes of carbon films for electron cryomicroscopy. Journal of Structural Biology 182, 51–56. - PMC - PubMed

Publication types

Supplementary concepts