. 2019 Apr 4;177(2):414-427.e13.
doi: 10.1016/j.cell.2019.02.016.

Suppression of Exosomal PD-L1 Induces Systemic Anti-tumor Immunity and Memory

Affiliations

Suppression of Exosomal PD-L1 Induces Systemic Anti-tumor Immunity and Memory

Mauro Poggio et al. Cell. .

Abstract

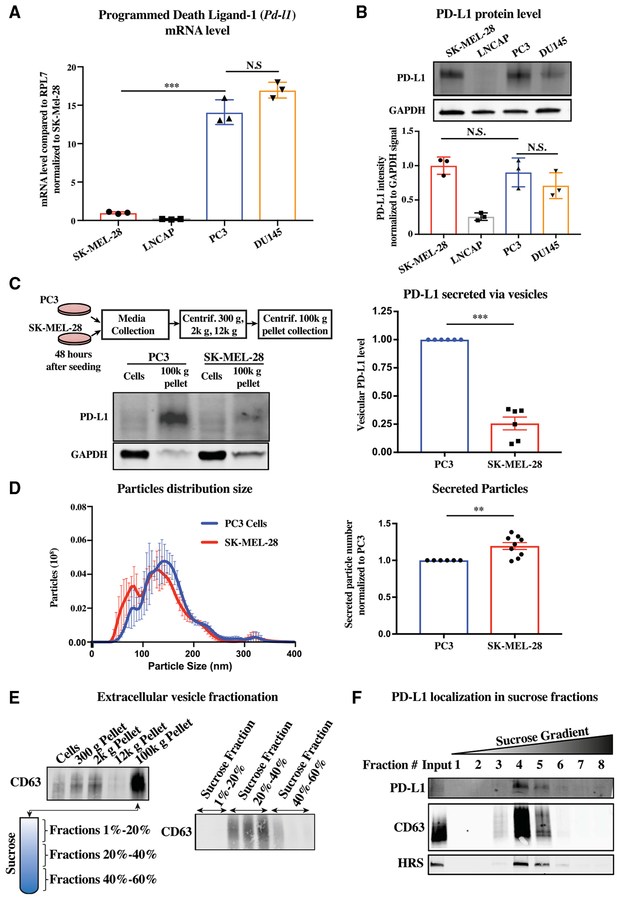
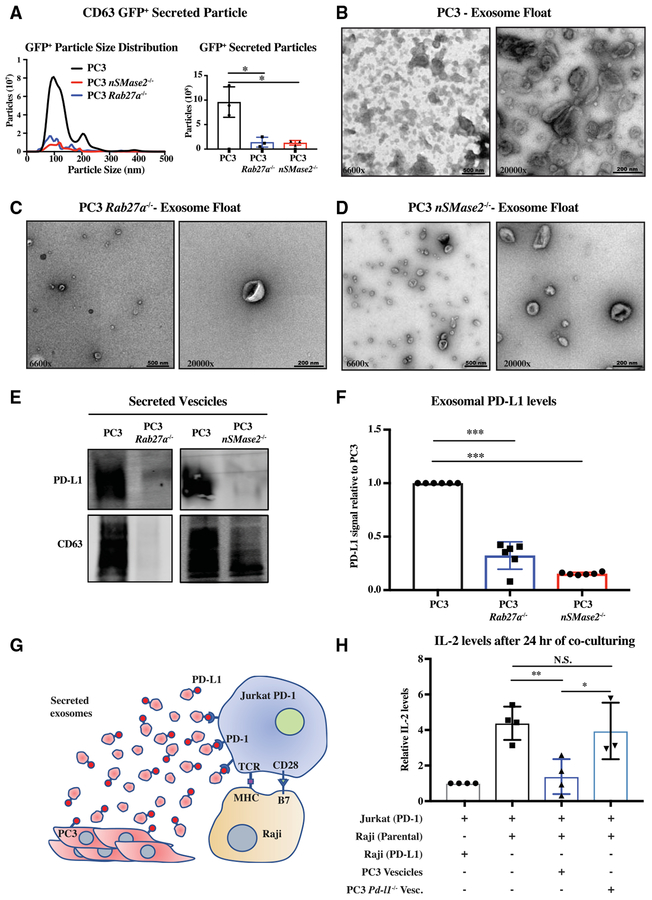
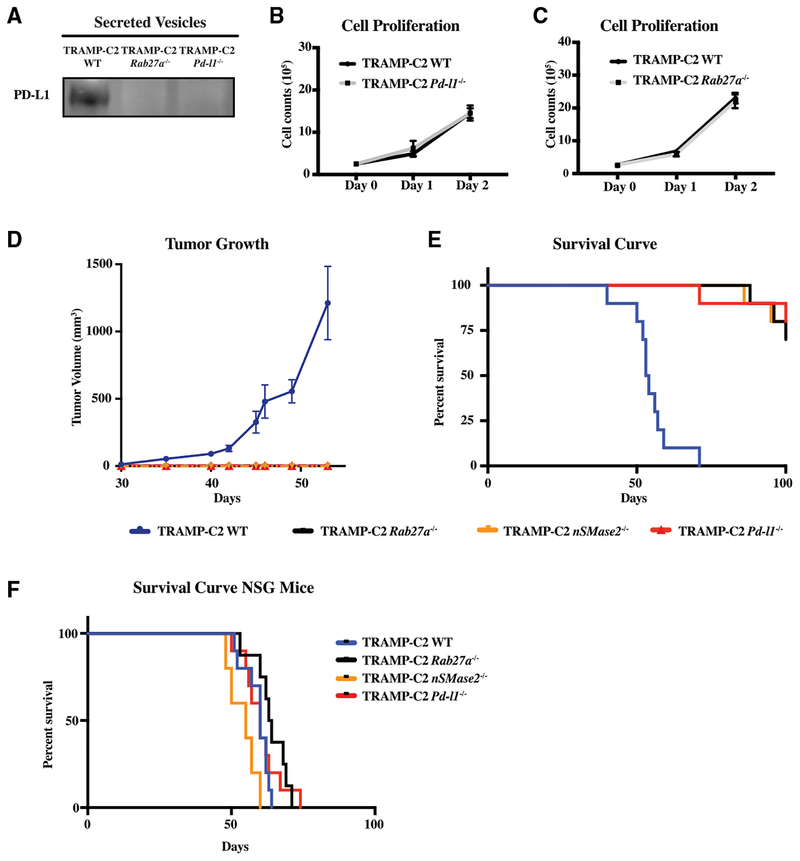
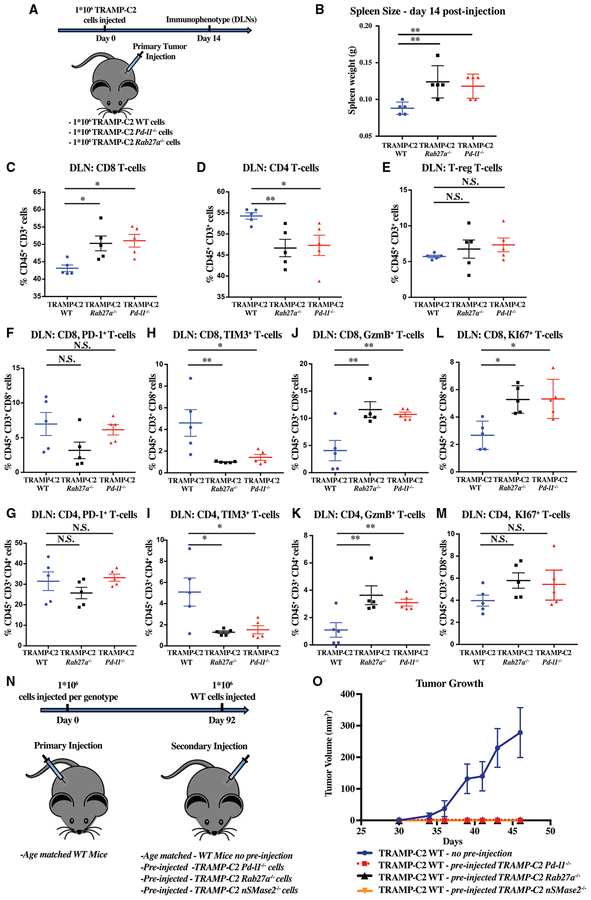
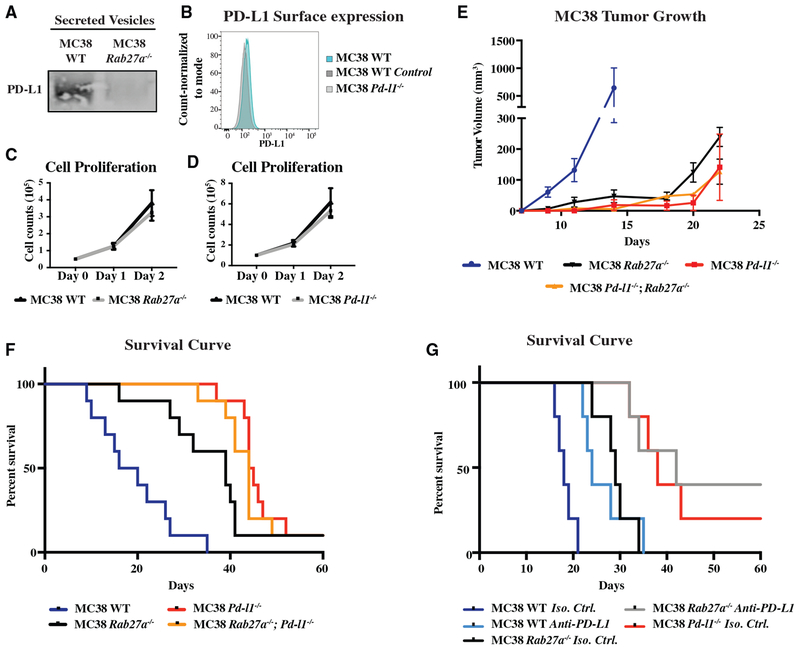
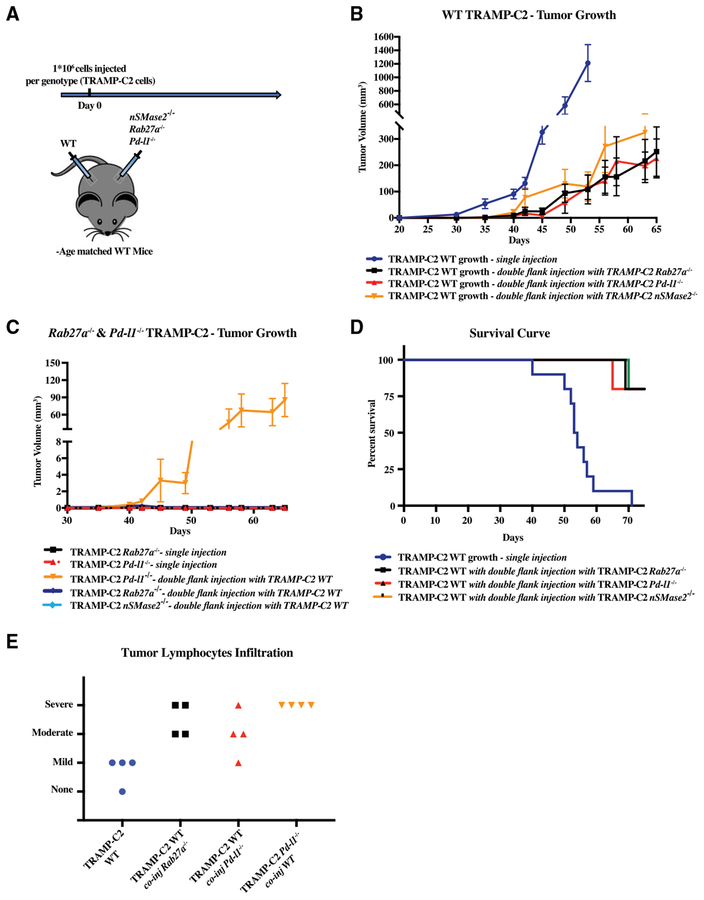
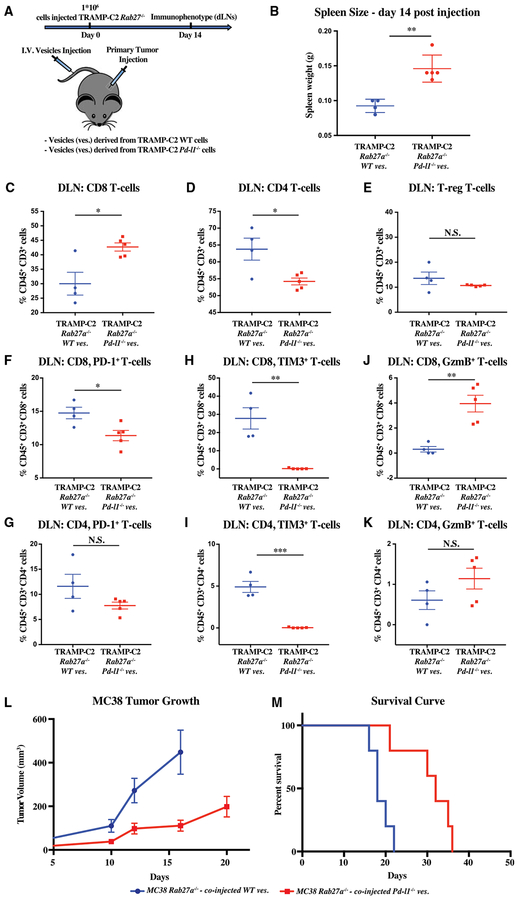
PD-L1 on the surface of tumor cells binds its receptor PD-1 on effector T cells, thereby suppressing their activity. Antibody blockade of PD-L1 can activate an anti-tumor immune response leading to durable remissions in a subset of cancer patients. Here, we describe an alternative mechanism of PD-L1 activity involving its secretion in tumor-derived exosomes. Removal of exosomal PD-L1 inhibits tumor growth, even in models resistant to anti-PD-L1 antibodies. Exosomal PD-L1 from the tumor suppresses T cell activation in the draining lymph node. Systemically introduced exosomal PD-L1 rescues growth of tumors unable to secrete their own. Exposure to exosomal PD-L1-deficient tumor cells suppresses growth of wild-type tumor cells injected at a distant site, simultaneously or months later. Anti-PD-L1 antibodies work additively, not redundantly, with exosomal PD-L1 blockade to suppress tumor growth. Together, these findings show that exosomal PD-L1 represents an unexplored therapeutic target, which could overcome resistance to current antibody approaches.

Keywords: CD274; NSMASE2; PD-L1; RAB27A; SMPD3; T cells; abscopal; cancer; exosomes; immune checkpoint.


Conflict of interest statement

DECLARATION OF INTERESTS

The authors declare no competing interests.

Figures

Figure 1.
Figure 1.. Differential Secretion of PD-L1 in PC3 versus SK-MEL-28 Cells
(A) qRT-PCR of Pd-l1 mRNA levels in one melanoma cell line (SK-MEL-28) and three prostate cancer cell lines (LNCAP, PC3, and DU145). n = 3. (B) Western analysis of cellular levels of PD-L1 in the same cells as (A). Top: Representative western blot. Bottom: Quantification of three independent western blots. (C) Top left: Schematic for crude isolation of secreted vesicles by sequential centrifugation of media through increasing centrifugal forces and finally pelleted at 100k g. Bottom left: Representative western blot of PD-L1 in cells versus secreted vesicles of either PC3 or SK-MEL-28 cells. Right: Quantification. n = 6. (D) Nanoparticle tracking of size and quantity of secreted vesicles produced by PC3 and SK-MEL-28 cells. Left: Density plot for size. Right: Total vesicle number based on integration under the curve. n = 9. (E) Schematic of steps involved in exosome purification including sequential centrifugations of supernatant at increasing gravitation force and then 100k g pellet run on sucrose gradient. Location of exosomes is followed by a western blot for CD63. (F) Western blot for PD-L1 and exosome markers CD63 and HRS in different sucrose gradient fractions. n = 3. (A and B) Error bars represent SD. (C and D) Error bars represent SEM. *p < 0.05; **p < 0.01; ***p < 0.001 (Student’s t test). See also Figures S1 and S2.
Figure 2.
Figure 2.. PD-L1 Is Secreted in the Form of Rab27a- and nSMase2-Dependent Exosomes
(A) Nanoparticle tracking of size and quantity of GFP+ vesicles from WT and Rab27a null PC3 cells expressing CD63-GFP. Left: Density trace. Right: Integration under curve for total particles. n = 3. (B–D) Electron microscopy images of WT (B), Rab27a null (C), and nSMase2 (D) null PC3 exosomes, respectively, purified on sucrose gradient. (E) Representative western for PD-L1 and CD63 in WT PC3, Rab27a null, and nSMase2 null PC3 cells. (F) Quantification of PD-L1 in WT PC3, Rab27a null, and nSMase2 null PC3 cells. n = 6. (G) Schematic of in vitro functional assay of exosomal PDL1. (H) Quantification of IL-2 released by Jurkat cells following Raji presentation of super-antigen. Jurkat (PD1), Jurkat T cells overexpressing PD1; Raji (Parental), Raji B cells expressing low levels of PD-L1; Raji (PD-L1), Raji B cells overexpressing PD-L1; PC3 vesicles, 100k g pellet from conditioned media of WT PC3 cells; PC3 Pd-l1/ Vesc, 100k g pellet from conditioned media of Pd-l1 null PC3 cells. n = 4. (A, F, and H) Error bars represent SD. *p < 0.05; **p < 0.01; ***p < 0.001 (Student’s t test). See also Figures S3 and S4.
Figure 3.
Figure 3.. Exosomal PD-L1 Suppresses Tumor Progression in Syngeneic Prostate Cancer Model
(A) Western blot for PD-L1 in WT, Rab27a null, and Pd-l1 null TRAMP-C2 100k g extracellular fraction. (B) Cell counts over time for Pd-l1 null versus WT TRAMP-C2 cells. n = 3. Error bars represent SD. (C) Cell counts over time for Rab27a null versus WT TRAMP-C2 cells. n = 3. Error bars represent SD. (D) Tumor growth volume over time following subcutaneous injection of 1 × 10⁶ WT, Rab27a null, or Pd-l1 null TRAMP-C2 cells into immuno-competent B6 mice. n = 5 for each genotype. Error bars represent SEM. Tramp WT versus TRAMP-C2 Rab27a null, p < 0.001. Tramp WT versus TRAMP-C2 Pd-l1 null, p < 0.0001. Tramp WT versus TRAMP-C2 nSMase2 null, p < 0.001 (twoway ANOVA test). (E) Mouse survival curve following injection of cells like in (D). n = 10 for each genotype. Tramp WT versus TRAMP-C2 Rab27a null, p < 0.001. Tramp WT versus TRAMP-C2 Pd-l1 null, p < 0.001. Tramp WT versus TRAMP-C2 nSMase2 null, p < 0.001 (log rank test). (F) Mouse survival curve following NOD-SCID IL2rg−/− (NSG) mice injected with 1 × 10⁶ WT, Rab27a null, and Pd-l1 null TRAMP-C2 cells. n = 10 for Pd-l1 null and WT genotypes, n = 8 for Rab27a null genotype, n = 5 for nSMase2 null genotype. See also Figure S5.
Figure 4.
Figure 4.. Immunophenotypes of Draining Lymph Node T Cells Predicts Immune Memory and Tumor Suppression
(A) Schematic of experimental design for (B)–(M). (B) Spleen weight in grams 14 days post-injection with 1 × 10⁶ WT, Pd-l1 null, and Rab27a null TRAMP-C2 cells. (C–E) Flow cytometric quantification of the percentage of CD8+ (C), CD4+ (D), and regulatory T cells (T-reg) (E), respectively, among CD45+, CD3+ cells in the draining lymph node (DLN) (n = 5 mice/genotype) 14 days post-tumor cell injection (1 × 10⁶ WT, Pd-l1 null, and Rab27a null TRAMP-C2 cells). (F and G) Quantification of PD-1+ cells among CD8 (F) and CD4 (G) T cells (n = 5 mice/genotype). (H and I) Quantification of Tim3+ in CD8 (H) and CD4 (I) cells (n = 5 mice/genotype). (J–M) Quantification of granzyme B (GzmB) (J and K) or Ki67 (L and M) CD8 (J and L) and CD4 (K and M) T cells (n = 5 mice/genotype). *p < 0.5; **p < 0.01 (Student’s t test). (N) Schematic of experimental design for (O). (O) Tumor growth volume over time following secondary subcutaneous injection of 1 × 10⁶ WT TRAMP-C2 cells into immunocompetent B6 mice previously sham treated or injected with Pd-l1, Rab27a, or nSMase2 null TRAMP-C2 cells. n = 5 for each condition. Tramp WT versus TRAMP-C2 WT pre-injected with TRAMP-C2 Rab27a null, p < 0.001. Tramp WT versus TRAMP-C2 WT pre-injected with TRAMP-C2 Pd-l1 null, p < 0.001. Tramp WT versus TRAMP-C2 WT pre-injected with TRAMP-C2 nSMase2 null, p < 0.001 (two-way ANOVA test). Error bars represent SEM. See also Figure S6.
Figure 5.
Figure 5.. Exosomal PD-L1 Suppresses Tumor Progression in Syngeneic Colorectal Cancer Model
(A) Western for PD-L1 in WT and Rab27a null MC38 100k g extracellular fraction. (B) Flow cytometry for surface PD-L1 on MC38 cells. (C) Cell counts over time for Rab27a null versus WT MC38 cells. n = 3. Error bars represent SD. (D) Cell counts over time for Pd-l1 null versus WT MC38 cells. n = 3. Error bars represent SD. (E) Tumor growth over time following subcutaneous injection of 1 × 10⁶ WT, Rab27a null, or Pd-l1 null MC38 cells into immunocompetent B6 mice. n = 5 for each genotype. Error bars represent SEM. MC38 WT versus MC38 Rab27a null, p < 0.05. MC38 WT versus MC38 Pd-l1 null, p < 0.05. MC38 WT versus MC38 Pd-l1 null; Rab27a null, p < 0.05 (two-way ANOVA test). (F) Mouse survival curve following injection of cells like in (D). n = 10 for each genotype. MC38 WT versus MC38 Rab27a null, p < 0.001. MC38 WT versus MC38 Pd-l1 null, p < 0.001. MC38 WT versus MC38 Pd-l1 null; Rab27a null, p < 0.001 (log rank test). (G) Survival curve for mice injected with WT, Rab27a null, or Pd-l1 null MC38 cells followed by treatment with either anti-PD-L1 or isotype control antibody. n = 5 for each condition. MC38 WT isotype versus MC38 WT anti-PD-L1, p < 0.01. MC38 Rab27a isotype versus MC38 Rab27a anti-PD-L1, p < 0.05. MC38 Pd-l1 isotype versus MC38 Rab27a anti-PD-L1, ns. (log rank test). See also Figure S7.
Figure 6.
Figure 6.. Cross-Communication between WT and Mutant TRAMP-C2 Cells at Distant Sites
(A) Schematic of the experiment: briefly, immuno-competent B6 mice were co-injected with 1 × 10⁶ mutant TRAMP-C2 cells in one flank and with 1 × 10⁶ WT TRAMP-C2 cells in the other flank. (B) Tumor growth of WT TRAMP-C2 cells in mice singly injected or co-injected with either Pd-l1 null or Rab27a null cells. n = 5 for each condition. Tramp WT versus TRAMP-C2 WT co-injected with TRAMP-C2 Rab27a null, p < 0.001. Tramp WT versus TRAMP-C2 WT co-injected with TRAMP-C2 Pd-l1 null, p < 0.001. Tramp WT versus TRAMP-C2 WT co-injected with TRAMP-C2 nSMase2 null, p < 0.01 (two-way ANOVA test). Error bars represent SEM. (C) Tumor growth of Pd-l1 null or Rab27a null TRAMP-C2 cells in mice singly injected or co-injected with WT TRAMP-C2 cells. n = 5 for each condition. Error bars represent SEM. (D) Mouse survival curve mice singly injected with WT TRAMP-C2 cells or doubly injected with WT and Pd-l1 null or Rab27a null cells. n = 5 for each genotype. (E) Histological analysis of lymphocyte infiltration of tumors under the noted conditions. Each symbol represents an individual mouse. Representative images for each state (severe, moderate, mild, and none) can be found in Figure S7E.
Figure 7.
Figure 7.. Exogenously Introduced Exosomal PD-L1 Rescues Immune Suppression and Tumor Growth of Rab27a Null Tumors
(A) Schematic of experimental design (B)–(K); briefly, mice were transplanted with 1 × 10⁶ Rab27a null TRAMP-C2 cells, followed by 3 times per week tail-vein injections of exosomes that were collected from either WT or Pd-l1 null TRAMP-C2 cells grown in vitro. Immune analysis was performed at 14 days. (B) Spleen weight in grams. (C–E) Flow cytometric quantification of the percentage of CD45+ CD3+ cells that are CD8 (C), CD4 (D), and regulatory T cells (T-reg) (E), respectively, in the draining lymph node (DLN). (F and G) Quantification of the percentage PD-1+ cells among the CD8 (F) and CD4 (G) T cell populations. (H and I) Quantification of the percentage of Tim3+ cells among the CD8 (H) and CD4 (I) T cell populations. (J and K) Quantification of the percentage of granzyme B (GzmB+) cells among the CD8 (J) and CD4 (K) T cell populations. (B–K) Each dot represents an individual mouse. Error bars represent mean and SD. *p < 0.05; **p < 0.01; ***p < 0.001 (Student’s t test). (L) Tumor growth over time following subcutaneous injection of 1 × 10⁶ MC38 Rab27a null cells followed by tail vein exosomes derived from MC38 WT and MC38 Pd-l1 null cells grown in vitro. MC38 Rab27a null treated with WT versus Pd-l1 null exosomes, p < 0.01 (two-way ANOVA test).(M) Survival curve following injection of cells as in (L). MC38 Rab27a null tumors treated with WT versus Pd-l1 null exosomes, p < 0.01 (log rank test). (L and M) Error bars represent SEM.

References

    1. Abusamra AJ, Zhong Z, Zheng X, Li M, Ichim TE, Chin JL, and Min WP (2005). Tumor exosomes expressing Fas ligand mediate CD8+ T-cell apoptosis. Blood Cells Mol. Dis 35, 169–173. - PubMed
    1. Burr ML, Sparbier CE, Chan YC, Williamson JC, Woods K, Beavis PA, Lam EYN, Henderson MA, Bell CC, Stolzenburg S, et al. (2017). CMTM6 maintains the expression of PD-L1 and regulates anti-tumour immunity. Nature 549, 101–105. - PMC - PubMed
    1. Carr B, and Warren J (2012). Company profile: NanoSight: delivering practical solutions for biological nanotechnology. Nanomedicine (Lond.) 7, 1129–1132. - PubMed
    1. Casey SC, Tong L, Li Y, Do R, Walz S, Fitzgerald KN, Gouw AM, Baylot V, Gütgemann I, Eilers M, and Felsher DW (2016). MYC regulates the antitumor immune response through CD47 and PD-L1. Science 352, 227–231. - PMC - PubMed
    1. Chassé H, Boulben S, Costache V, Cormier P, and Morales J (2017). Analysis of translation using polysome profiling. Nucleic Acids Res. 45, e15. - PMC - PubMed

Publication types