. 2019 Apr 4;177(2):428-445.e18.
doi: 10.1016/j.cell.2019.02.029.

Reassessment of Exosome Composition

Affiliations

Reassessment of Exosome Composition

Dennis K Jeppesen et al. Cell. .

Abstract

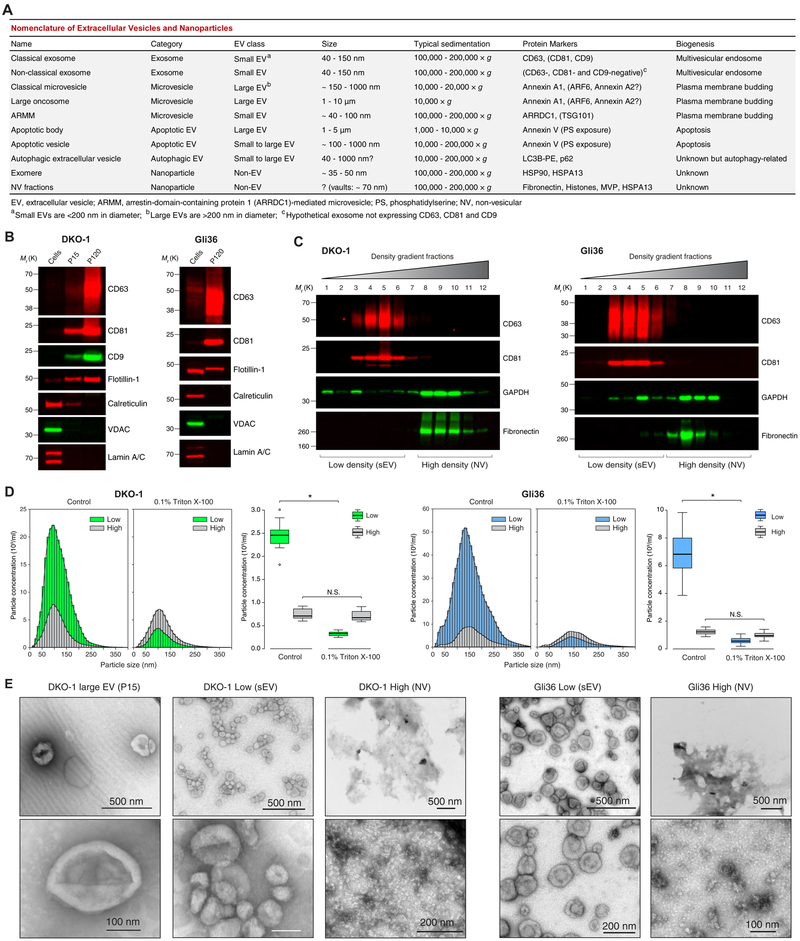
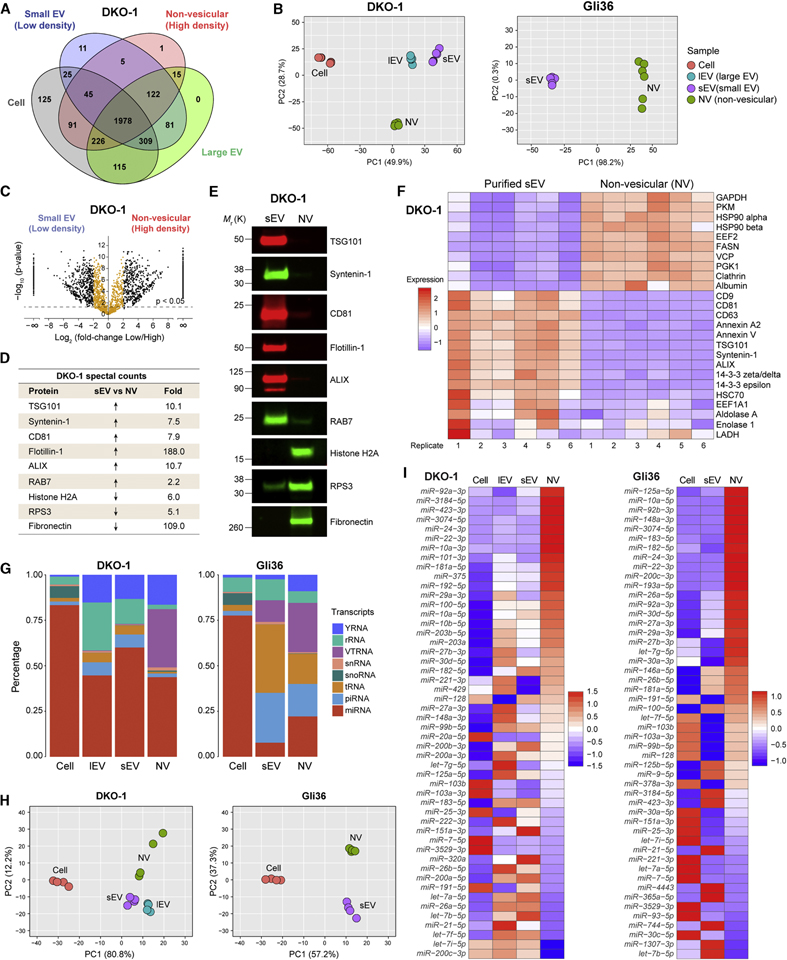
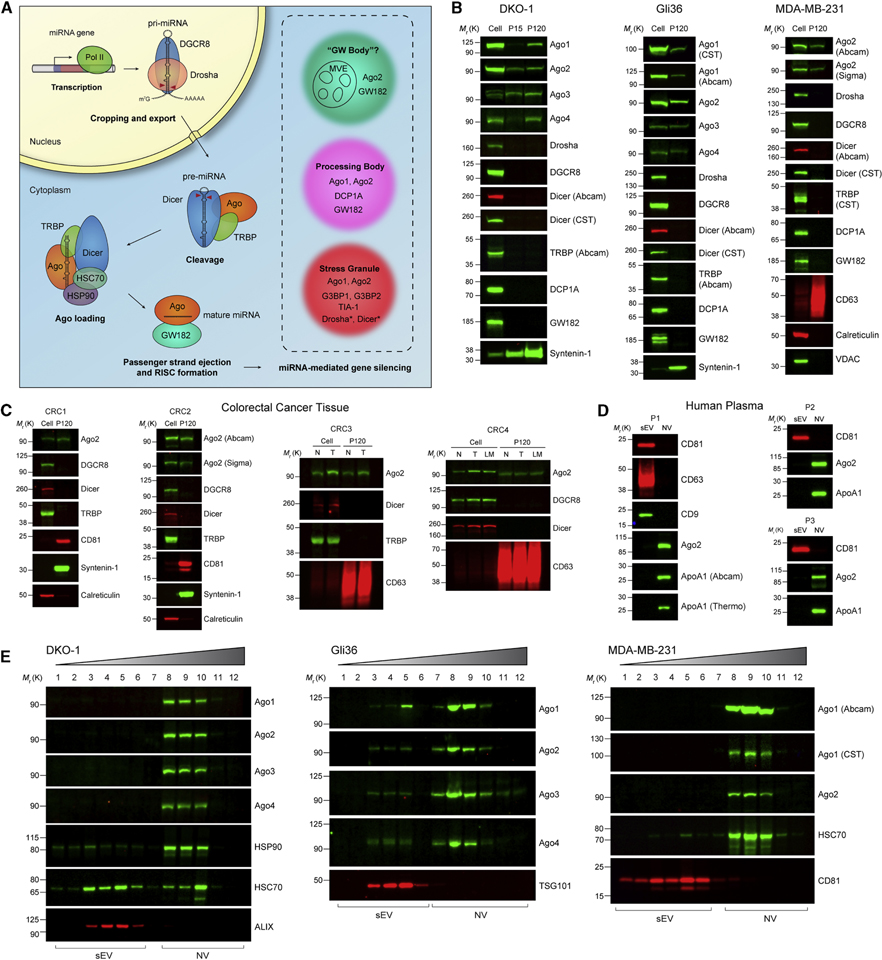
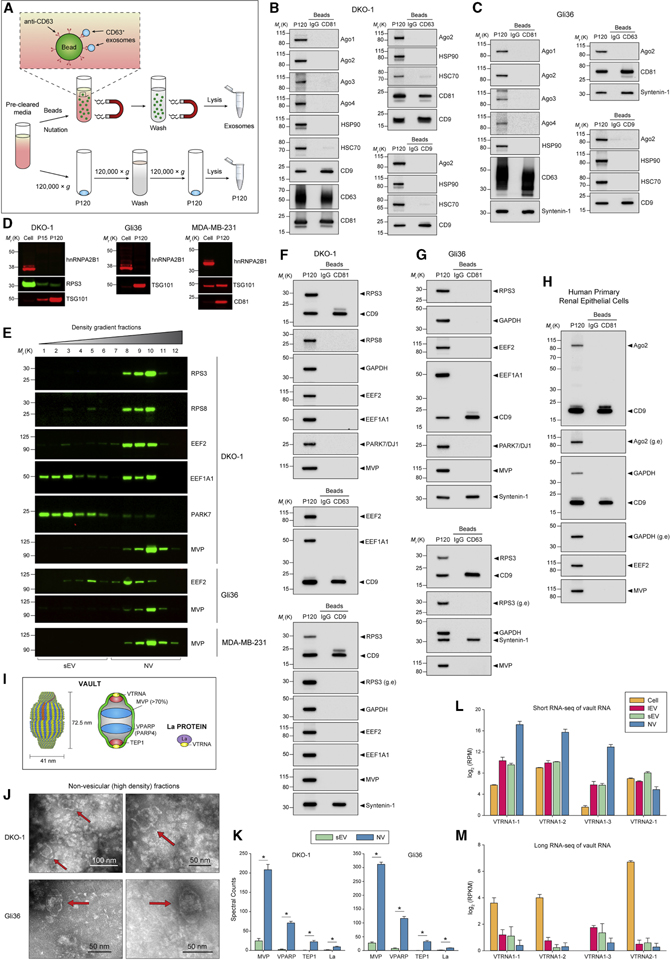
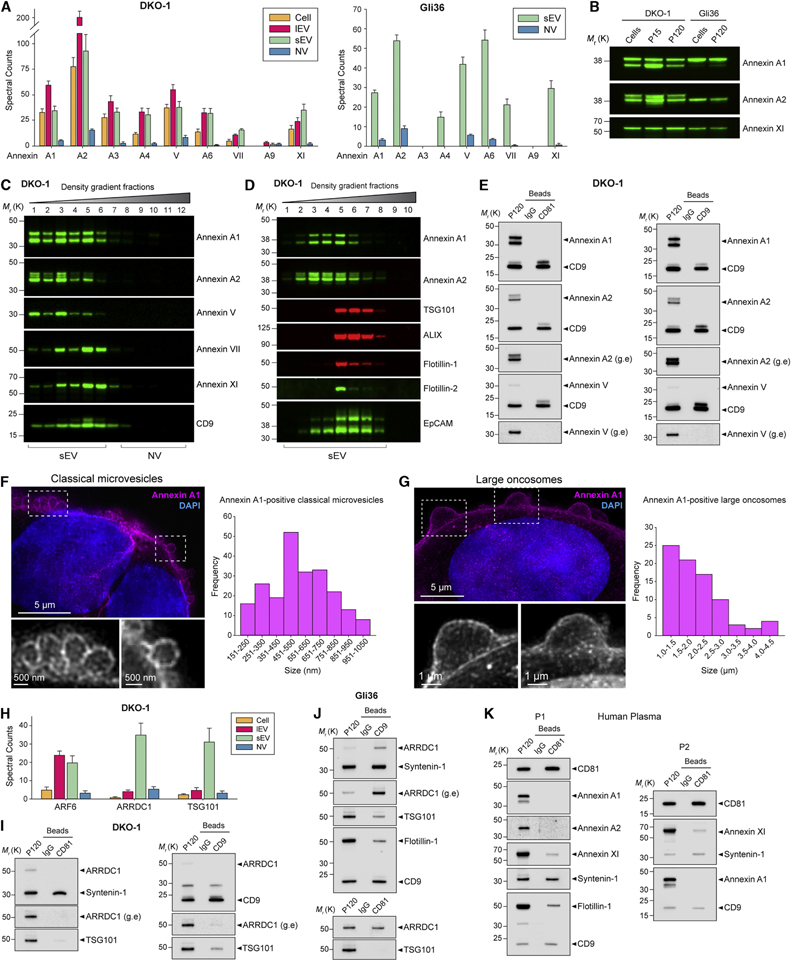
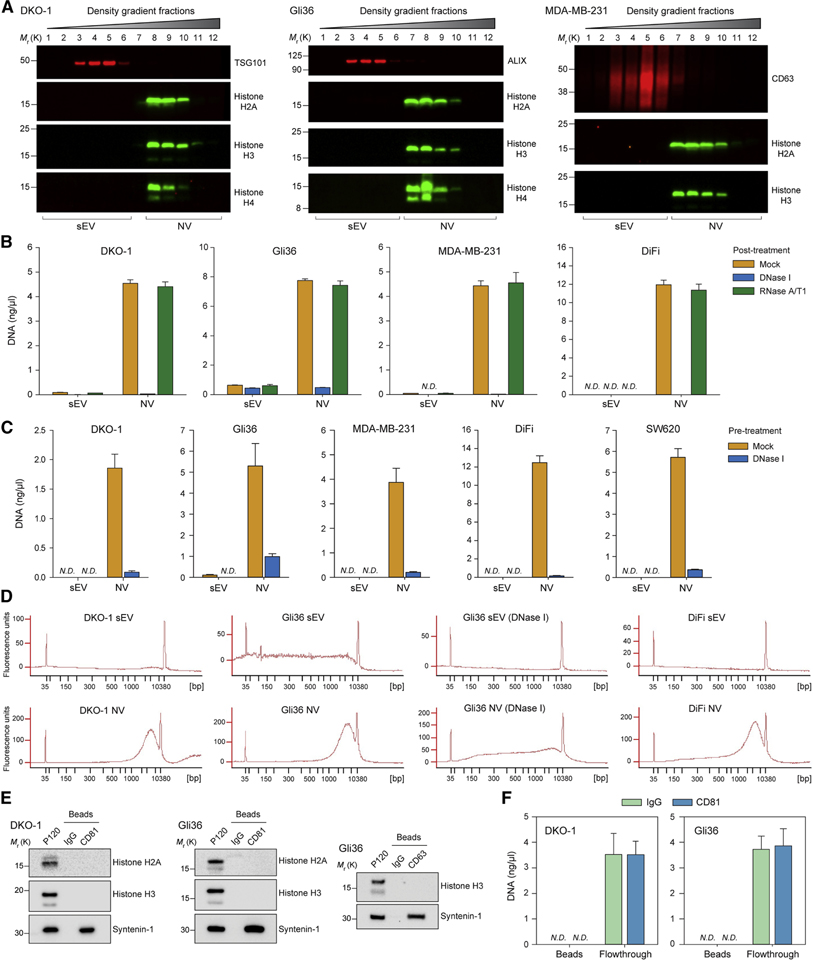
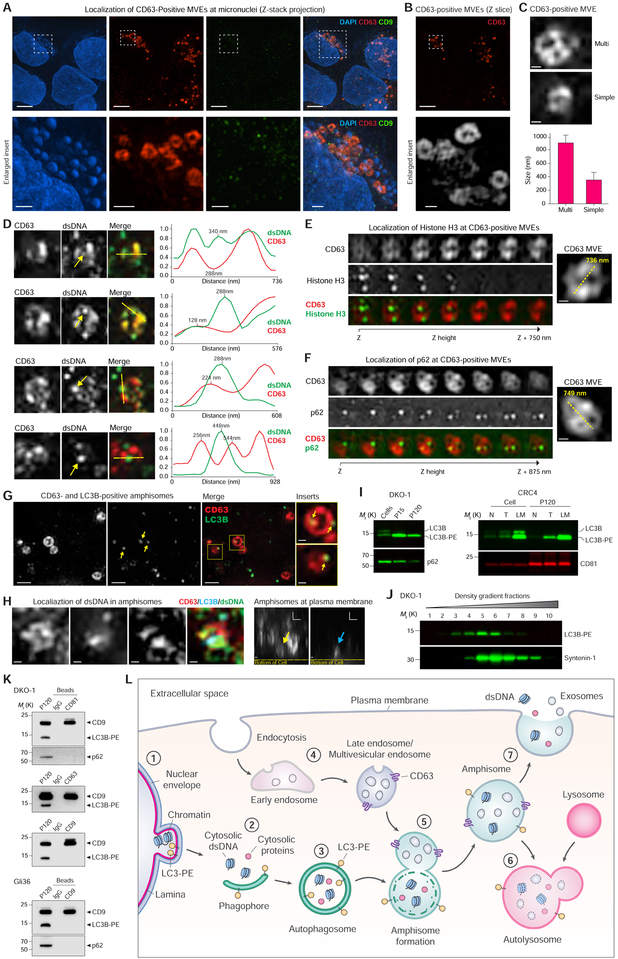
The heterogeneity of small extracellular vesicles and presence of non-vesicular extracellular matter have led to debate about contents and functional properties of exosomes. Here, we employ high-resolution density gradient fractionation and direct immunoaffinity capture to precisely characterize the RNA, DNA, and protein constituents of exosomes and other non-vesicle material. Extracellular RNA, RNA-binding proteins, and other cellular proteins are differentially expressed in exosomes and non-vesicle compartments. Argonaute 1-4, glycolytic enzymes, and cytoskeletal proteins were not detected in exosomes. We identify annexin A1 as a specific marker for microvesicles that are shed directly from the plasma membrane. We further show that small extracellular vesicles are not vehicles of active DNA release. Instead, we propose a new model for active secretion of extracellular DNA through an autophagy- and multivesicular-endosome-dependent but exosome-independent mechanism. This study demonstrates the need for a reassessment of exosome composition and offers a framework for a clearer understanding of extracellular vesicle heterogeneity.

Keywords: Argonaute; amphisomes; annexin; autophagy; exomeres; exosomes; extracellular DNA; extracellular RNA; extracellular vesicles; microvesicles.


Conflict of interest statement

DECLARATION OF INTERESTS

The authors declare no competing interests.

Figures

Figure 1.
Figure 1.. High-Resolution Density Gradient Fractionation Separates Small Extracellular Vesicles from Non-Vesicular Components
(A) Nomenclature of extracellular vesicles and particles employed in this study. (B) Immunoblots of DKO-1 and Gli36 whole cell lysates, large EVs (P15) and crude small EVs (P120) (STAR Methods). Equal quantities of protein were separated on SDS-PAGE gels, and membranes were blotted with indicated antibodies. (C) Density gradient fractionation of DKO-1 and Gli36 crude small EVs (P120). After flotation of sample in high-resolution iodixanol gradients (STAR Methods), equal volumes of each fraction were loaded on SDS-PAGE gels, and membranes were blotted with indicated antibodies. NV, non-vesicular; sEV, small EV. (D) Nanoparticle tracking analysis of pooled low (sEV) and high (non-vesicular) density fractions with or without pre-treatment with Triton X-100 detergent. For box plots the center lines mark the median; box limits indicate 25th and 75th percentiles; whiskers extend 1.5 times the interquartile range from 25th and 75th percentiles; n = 18 sample points; data from three independent experiments. Significant differences were assessed by one-way ANOVA and pairwise comparisons adjusted by the Holm-Bonferroni method; *p < 0.001; N.S., Not Significant. (E) Negative stain transmission electron microscopy (TEM) of DKO-1 large EVs (P15), and pooled low (sEV) and high (NV) fractions obtained from high-resolution density gradients. (F) Negative stain TEM of Gli36 pooled low (sEV) and high (NV) fractions. See also Figure S1 and Table S1.
Figure 2.
Figure 2.. Differential Expression of Protein and RNA in Small Extracellular Vesicles and Non-Vesicular Fractions
(A) Venn diagram representing the number of unique and overlapping proteins . (B) Principal Component Analysis of the quantitative differences in spectral counts. (C) Volcano plots of quantitative differences in proteins in sEV and NV fractions for DKO-1 samples. Black dots represent a four-fold or greater enrichment while orange dots represent less than four-fold enrichment. Dots above the dashed line represent proteins for which differences were significant (FDR < 0.05). (D) Table of fold-change in spectral counts from proteomic profiling between sEV and NV pooled fractions for selected proteins chosen for validation by immunoblotting. (E) Immunoblot validation of proteomic profiling. NV, non-vesicular; sEV, small EV. (F) Heatmap of the 25 most commonly identified exosomal proteins from the ExoCarta exosome database form proteomic profiling of sEV and NV from DKO-1. Scale indicates intensity, defined as Δ(spectral counts – mean spectral counts)/standard deviation. (G) Percentage of short RNA reads mapping to different types of small ncRNA for cellular and extracellular DKO-1 (left) and Gli36 (right) samples. (H) Principal Component Analysis based on quantitative miRNA profiles. (I) Heat map of the 50 most abundant miRNAs across all sample types. Scale indicates intensity, defined as Δ(read counts – mean read count)/standard deviation. See also Figure S2 and Tables S2–7.
Figure 3.
Figure 3.. Secretion of Human Argonaute and miRNA Biogenesis Machinery
(A) Schematic of human miRNA biogenesis. Pri-miRNA is transcribed by RNA polymerase II and cropped by the Drosha/DGCR8 microprocessor complex to generate pre-miRNA. After export to the cytoplasm, Dicer cleaves the stem loop supported by TRBP. The miRNA/miRNA duplex is then loaded into Ago in an HSP90/HSC70-dependent manner. The miRNA duplex is unwound and the passenger strand is ejected. Ago and GW182 form the mature RISC complex necessary for gene silencing. Insert shows common proteins found in “GW bodies”, processing bodies and stress granules with * denoting proteins with increased abundance in conditions of cellular stress. (B) Immunoblots of whole cell lysates, large EVs (P15) and crude small EVs (P120). (C) Immunoblots of cell lysates from four colorectal cancers (CRC), adjacent normal and lymph node metastasis, and crude small EVs (P120) isolated from matched tissue/interstitial fluid (STAR Methods). N, normal; T, tumor; LM, lymph node metastasis. (D) Immunoblots of high-resolution density gradient-purified sEV and NV samples isolated from plasma of three normal individuals (see Figure S3D). (E) Immunoblots of high-resolution density gradient fractionation of crude small EVs (P120). See also Figure S3.
Figure 4.
Figure 4.. Extracellular Release of RNA-Binding Protein and Vaults
(A) Schematic illustration of the direct immunoaffinity capture (DIC) procedure. Magnetic beads directly conjugated to anti-CD63, anti-CD81, anti-CD9 antibodies or IgG were added directly to pre-cleared cell culture medium (STAR Methods) without prior ultracentrifugation or concentration. In parallel, conventional crude sEVs (P120) were prepared form the same pre-cleared cell culture medium. (B-C) DIC of CD81-, CD63-and CD9-positive exosomes from (B) DKO-1 or (C) Gli36. Immunoblots of crude sEV pellet (P120) and bead-captured exosomes. (D) Immunoblots of whole cell lysates, large EVs (P15) and crude small EVs (P120) obtained by ultracentrifugation. (E) Immunoblots of high-resolution density gradient fractionation of crude small EVs (P120). (F-H) DIC of CD81-, CD63-and CD9-positive exosomes. Immunoblot of crude sEV pellet (P120) and bead-captured exosomes from (F) DKO-1, (G) Gli36, and (H) cultured primary human renal epithelial cells. g.e, greater exposure. (I) Structure and molecular composition of vaults. (J) Non-fixed negative stain TEM of DKO-1 and Gli36 NV fractions. Red arrows indicate vault structures. (K) Proteomic analysis of vault-associated proteins in purified sEV and NV generated by gradient density centrifugation. Data are mean ± SD. *p < 0.00001 for the quasiFDR. (L) Short RNA-seq data for vault RNA in DKO-1 cells, large EVs (lEV), sEV and NV pooled fractions. RPM, reads per million. (M) Long RNA-seq data for vault RNA in DKO-1 cells, large EVs (lEV), purified sEV and non-vesicular (NV) pooled fractions. FPKM, fragments per kilobase million. See also Figure S4.
Figure 5.
Figure 5.. Annexin A1 is a Novel and Specific Marker of Microvesicles Distinct from Exosomes and ARMMs
(A) Proteomic analysis of extracellular Annexins. (Left) Spectral counts for Annexins for cells, lEVs (P15) and gradient-purified sEV and NV samples for DKO-1, and (Right) for gradient-purified sEV and NV samples for Gli36. Data represent mean ± SD. n = 6. (B) Immunoblot analysis of Annexin expression in cells, lEVs (P15), and crude sEVs (P120). (C) High-resolution (12–36%) density fractionation of crude DKO-1 sEVs (P120). (D) Gradient (6–30%) density fractionation of crude DKO-1 sEVs (P120). (E) DIC of CD81-and CD9-positive exosomes from DKO-1 cells. Immunoblots of crude sEV pellet (P120) and bead-captured exosomes. g.e, greater exposure. (F) Annexin A1-positive classical microvesicles. (Left) 3D Structured Illumination Microscopy (SIM) of DKO-1 cells stained for Annexin A1 and DAPI. Enlarged inserts displayed in greyscale at the bottom. (Right) Size distribution of Annexin A1-positive classical microvesicles imaged by 3D SIM of DKO-1 cells. Histogram of maximum width of vesicles shed at the plasma membrane. n = 221; data from four independent experiments. (G) Annexin A1-positive large oncosomes. (Left) 3D SIM of DKO-1 cells stained for Annexin A1 and DAPI. Enlarged inserts displayed in greyscale at the bottom. (Right) Size distribution of Annexin A1-positive classical large oncosomes imaged by 3D SIM of DKO-1 cells. Histogram of maximum width of large oncosomes blebbing at the plasma membrane. n = 82; data from four independent experiments. (H) Proteomic analysis of ARF6, ARRDC1 and TSG101 present in DKO-1 cells, lEV (P15), density gradient-purified sEV and NV fraction pools. Data are mean ± SD. n = 6. (I-K) DIC of CD81-and CD9-positive exosomes from (I) DKO-1, (J) Gli36, and (K) human plasma. g.e, greater exposure. See also Figure S5.
Figure 6.
Figure 6.. Release of Extracellular dsDNA and Histones from Human Cells is Independent of Exosomes and Small Extracellular Vesicles
(A) Immunoblots of high-resolution density gradient fractionation of crude small EVs (P120). (B) Quantification of DNA from gradient-fractionated sEV and NV pools extracted for DNA, and treated post-extraction with DNase I or RNase A/T1 to confirm identity as DNA. Data are mean ± SD. N.D., Not Detected; NV, non-vesicular; sEV, small EV. (C) Quantification of DNA from samples pre-treated with DNase I (to eliminate unprotected DNA) before density gradient fractionation and extraction of DNA. Data are mean ± SD. N.D., Not Detected. (D) Bioanalyzer electropherograms of size distribution of purified DNA in base pairs (bp) from DNase I pre-treated density gradient purified sEV and NV. DNA marker peaks at 35 bp and 10,380 bp. FU: fluorescence units. (E) DIC of CD81-and CD63-positive exosomes. (F) DIC of CD81-positive exosomes. DNA was extracted from bead-captured material and flowthrough material pelleted at 120,000 × g (P120). Data are mean ± SD. See also Figure S6.
Figure 7.
Figure 7.. Active Secretion of DNA and Histones through an Amphisome-Dependent Mechanism
(A) DKO-1 cells stained for DAPI, and endogenous CD63 and CD9, and imaged with 3D SIM. (Top) Z-stack projections. (Bottom) Enlarged inserts. See also Figure S7A. (B) Z-slice image from (A), and greyscale enlarged insert. (C) Size and structure of CD63-positive multivesicular endosomes (MVEs) by 3D SIM. (Top) Two types of CD63-positive MVE structure. Cropped images of DKO-1 cells stained for CD63. (Bottom) Data are mean ± SD. n = 57, data from five independent experiments. (D) Cropped images of DKO-1 cells localized for CD63 and double-stranded DNA (dsDNA). (Left) Greyscale CD63 and dsDNA, and colorized merge. Yellow arrows in dsDNA channel indicate dsDNA peak intensity in line scans. Line scans were performed at yellow dotted lines in colorized merge. (Right) Line scans indicate drop of CD63 signal at dsDNA peak intensity. For line scan graphs, individual channels were normalized to display on graph. Scale bars, 250 nm. (E) Cropped images of DKO-1 cells localized for CD63 and Histone H3 by 3D SIM. (Left) Greyscale CD63 and Histone H3, and colorized merge. Displayed are sequential image slices (125 nm) through the Z-stack. (Right) Enlarged image of the CD63-positive MVE with yellow line indicating longest axis. Scale bar, 200 nm. (F) Cropped images of DKO-1 cells localized for CD63 and p62 by 3D SIM. (Left) Greyscale CD63 and p62, and colorized merge. Displayed are sequential image slices (125 nm) through the Z-stack. (Right) Enlarged image of the CD63-positive MVE with yellow line indicating longest axis. Scale bar, 200 nm. (G) CD63-and LC3B-positive amphisomes in DKO-1 cells. Cells were stained for endogenous CD63 and LC3B. Greyscale CD63 and LC3B, colorized merge, and enlarged inserts. Yellow arrows in LC3B channel and enlarged inserts indicate LC3B localized to CD63-positive compartments. Scale bars for enlarged inserts, 200 nm. (H) Localization of dsDNA in CD63-, LC3B-positive amphisomes in DKO-1 cells. (Left) Cropped images of cells localized for endogenous CD63, LC3B and dsDNA and imaged by three-color 3D SIM. X-Y axis “top-down view” of greyscale CD63, LC3B and dsDNA, and colorized merge. (Right) X-Z axis “side view”. Yellow arrow indicates CD63-positive compartment, and blue arrow indicates LC3B-positive compartments, both co-localized at the plasma membrane. Scale bars, 200 nm. (I) Detection LC3B-PE positive EVs. (Left) Immunoblots of DKO-1 whole cell lysates, large EVs (P15) and crude small EVs (P120). (Right) Immunoblots of whole cell lysates and crude small EVs (P120) isolated from matched tissue/interstitial fluid of a colorectal cancer (CRC), adjacent normal and lymph node metastasis. N, normal; T, tumor; LM, lymph node metastasis. (J) Gradient (6–30%) density fractionation of crude DKO-1 sEVs (P120). (K) DIC of CD81-, CD63-and CD9-positive exosomes. Immunoblots of crude sEV pellet (P120) and bead-captured exosomes from DKO-1 (top) and Gli36 cells (bottom). (L) Model of amphisome-dependent, exosome-independent secretion. For autophagy, cytosolic LC3 is lipidated by conjugation with phosphatidylethanolamine to form LC3-PE. 1) Nuclear membranes can bleb in a process dependent on LC3B and the nuclear lamina protein Lamin B1, causing the appearance of cytoplasmic chromatin fragments. 2) During autophagy, cytoplasmic components are sequestered as a phagophore begins to engulf material. 3) Continued expansion of autophagic membranes requires LC3-PE and results in formation of the double-membrane autophagosome. 4) As early endosomes develop to late endosomes, the pH decreases and continued invagination of limiting membranes generates intraluminal vesicles (ILVs). A fully developed CD63-positive multivesicular endosome (MVE) contains numerous ILVs. 5) Fusion of the autophagosome with a MVE causes degradation of the inner autophagosome membrane generating an amphisome, a single-membrane hybrid compartment. 6) The amphisome fuses with a lysosomal compartment to form the autolysosome followed by degradation of cargo, or alternatively, 7) the amphisome fuses with the plasma membrane causing extracellular release of dsDNA and histones, and separately, the ILVs as exosomes. See also Figure S7.

Comment in

References

    1. Arroyo JD, Chevillet JR, Kroh EM, Ruf IK, Pritchard CC, Gibson DF, Mitchell PS, Bennett CF, Pogosova-Agadjanyan EL, Stirewalt DL, et al. (2011). Argonaute2 complexes carry a population of circulating microRNAs independent of vesicles in human plasma. Proc Natl Acad Sci U S A 108, 5003–5008. - PMC - PubMed
    1. Asai H, Ikezu S, Tsunoda S, Medalla M, Luebke J, Haydar T, Wolozin B, Butovsky O, Kugler S, and Ikezu T (2015). Depletion of microglia and inhibition of exosome synthesis halt tau propagation. Nat Neurosci 18, 1584–1593. - PMC - PubMed
    1. Bakhoum SF, Ngo B, Laughney AM, Cavallo JA, Murphy CJ, Ly P, Shah P, Sriram RK, Watkins TBK, Taunk NK, et al. (2018). Chromosomal instability drives metastasis through a cytosolic DNA response. Nature 553, 467–472. - PMC - PubMed
    1. Berg TO, Fengsrud M, Stromhaug PE, Berg T, and Seglen PO (1998). Isolation and characterization of rat liver amphisomes. Evidence for fusion of autophagosomes with both early and late endosomes. J Biol Chem 273, 21883–21892. - PubMed
    1. Chakrabortty SK, Prakash A, Nechooshtan G, Hearn S, and Gingeras TR (2015). Extracellular vesicle-mediated transfer of processed and functional RNY5 RNA. RNA 21, 1966–1979. - PMC - PubMed

Publication types