. 2019 Apr 4;177(2):446-462.e16.
doi: 10.1016/j.cell.2019.03.024.

Small RNA Sequencing across Diverse Biofluids Identifies Optimal Methods for exRNA Isolation

Affiliations

Small RNA Sequencing across Diverse Biofluids Identifies Optimal Methods for exRNA Isolation

Srimeenakshi Srinivasan et al. Cell. .

Abstract

Poor reproducibility within and across studies arising from lack of knowledge regarding the performance of extracellular RNA (exRNA) isolation methods has hindered progress in the exRNA field. A systematic comparison of 10 exRNA isolation methods across 5 biofluids revealed marked differences in the complexity and reproducibility of the resulting small RNA-seq profiles. The relative efficiency with which each method accessed different exRNA carrier subclasses was determined by estimating the proportions of extracellular vesicle (EV)-, ribonucleoprotein (RNP)-, and high-density lipoprotein (HDL)-specific miRNA signatures in each profile. An interactive web-based application (miRDaR) was developed to help investigators select the optimal exRNA isolation method for their studies. miRDar provides comparative statistics for all expressed miRNAs or a selected subset of miRNAs in the desired biofluid for each exRNA isolation method and returns a ranked list of exRNA isolation methods prioritized by complexity, expression level, and reproducibility. These results will improve reproducibility and stimulate further progress in exRNA biomarker development.

Keywords: extracellular RNA; extracellular vesicles; lipoprotein; ribonucleoprotein.


Conflict of interest statement

Declaration of Interests. SD is a founding member of Dyrnamix, which did not play any role in this study and has a patent on extracellular RNA biomarkers for cardiac remodeling. Over the past 12 months, RS has received funds from Amgen (scientific advisory board), Myokardia (consulting), and Best Doctors (consulting). RS is a co-inventor on a patent for ex-RNAs signatures of cardiac remodeling. RG has been employed by Sanofi Genzyme since September 2017, working on a multiple sclerosis treatment. AKS has the following interests: Advisory board member for Kiyatec and Merck; research funding from M-Trap; stock holder for Biopath; patents for EGFL6 antibodies and siRNA delivery systems.

Figures

Figure 1
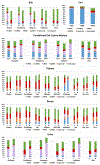
Figure 1. Distribution of RNA biotypes.
Distributions of rRNA, miRNA, tRNA, piRNA, other Gencode transcripts, and unmapped reads are shown for libraries in the “miRNA_AllBiofluid_TMR” dataset. Values are averaged across all pass-filter replicate libraries.
Figure 2
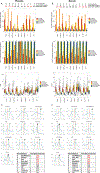
Figure 2. Scatterplots illustrating relationship between small RNA sequencing library complexity (y-axis) and sequencing depth (x-axis).
Complexity for each library was calculated as the number of miRNAs present at ten or more raw read counts in the “miRNA_AllBiofluid_RawData” dataset. Sequencing depth was measured as Total miRNA Reads. Data for libraries from the different biofluids are shown: bile (A), CCCM (B), plasma (C), serum (D), and urine (E). Libraries prepared from samples isolated using each method are color coded according to the legends. For each graph, the best-fit log curve is shown in blue, and the slope of the flatter portion of the log curve is indicated with a dashed red line. The estimated point of diminishing returns for each graph is indicated by the red arrow.
Figure 3
Figure 3. Complexity and reproducibility of exRNA isolation methods for plasma (A, C, E, G) and serum (B, D, F, H).
For A-F, values are given for each RNA isolation method for each expression windows. A-B. Average number of miRNAs expressed. C-D. Mean % of replicates in which the miRNAs with the indicated mean expression level were detected. E-F. Boxplots indicating the %CV as a function of mean expression level. For plasma, no CV data are shown for the miRCURY Exosome kit, as only 1 sample passed filter. G-H. Plots indicating the distribution of IQS scores across individual miRNAs, comprised of the sum of the mean expression quantile (1 for lowest expression; 5 for highest expression) and %CV quantile (1 for highest %CV, 5 for lowest %CV), for each exRNA isolation method. The 25th, 50th, and 75th percentile IQS values are indicated by the vertical dashed lines. Table: The 75th percentile IQS (IQS75) is highlighted in green if it is the top value (IQS75max) or IQS75max-1, the complexity is highlighted in red if it is within 10% of the highest value among all methods, and methods that meet both of these criteria are bolded; the methods are sorted first by IQS75 and then by complexity.
Figure 4
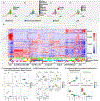
Figure 4. PCA and hierarchical clustering analysis of miRNA data from “miRNA_AllBiofluid_Scaled_Filtered” dataset.
PCA plots with samples color coded by Biological Group (P1 and P2 for bile; hESC, KMBC, and NRVM cell lines for CCCM; and Female (F) and Male (M) for plasma and serum) (A), exRNA isolation method (B), biofluid type (C), and Lab (D). E. Heatmap showing biclustering of miRNAs and samples by Euclidean distance with average linkage. The BioGroup, exRNA isolation Method, Biofluid, and Lab for each sample are color coded above the heatmap using the same color scheme as in Panels A-D.
Figure 5
Figure 5. Analysis of Plasma and Serum miRNA data.
PCA plots with samples color coded by BioGroup (Female and Male, A), exRNA isolation method (B), biofluid type (C), and Lab number (D). E. Heatmap showing biclustering of miRNAs and samples. The BioGroup, Biofluid, Lab, and exRNA isolation method for each sample is color coded below the heatmap using the same color schemes as in Panels A-D. Groups 1–4, indicated to the right of the heatmap, are sets of miRNAs preferentially isolated by specific exRNA isolation methods. F. Deconvolution results for exRNA samples extracted from purified carrier subclasses. Box- and-whisker plots showing proportions of CD63+, CD81+, CD9+, AGO2+, HDL, and LFF fractions for each sample. G. Deconvolution results for exRNA samples from the tested exRNA isolation methods. ExRNA samples isolated from Female Serum Pool using the indicated exRNA isolation methods were analyzed. H. Deconvolution results for exRNA samples isolated from iodixanol density gradients. ExRNA samples isolated from the Female Serum Pool before and after fractionation on an iodixanol gradient were analyzed.
Figure 6
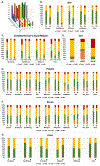
Figure 6. tRNA Analysis.
A. Distribution of tRNA amino acid distributions. Bar plots representing the percentage of tRF reads mapping to each amino acid. The top five amino acids are plotted for each biofluid type. The remaining amino acids were combined into the “Other” category. The most abundant amino acids differ between the biofluids. B-G. Distribution of tRNA fragment types. The distributions of 3´-half, 3´-tRF, 5´-half, 5´-tRF, and i-tRF are shown for each library. The y-axis is the percentage of tRF type relative to total reads present within the ‘tRNA space’ only and not relative to all sequence reads generated. Values are averaged across all pass-filter replicate libraries.
Figure 7
Figure 7. Hierarchical clustering analysis of mRNA data.
Each heatmap shows biclustering of mRNAs and samples. A. Hierarchical clustering analysis of mRNA data from “mRNA_bile_filtsc” dataset. The donor and exRNA isolation method for each sample are color coded below the heatmap. B. Hierarchical clustering analysis of miRNA data from “mRNA_CellCCCM_filtsc” dataset. The sample type (Cell or CCCM), cell line, and exRNA isolation method for each sample are color coded below the heatmap. C. Hierarchical clustering analysis of mRNA data from “mRNA_plasmaserum_filtsc” dataset. The BioGroup, Biofluid, Lab, and exRNA isolation method for each sample are color coded below the heatmap. Groups 1–4, indicated to the right of the heatmap, are sets of mRNAs that are preferentially isolated by specific exRNA isolation methods. D. Hierarchical clustering analysis of mRNA data from “mRNA_urine_filtsc” dataset. Upper panel: Heatmap showing biclustering of mRNAs and samples. The BioGroup and exRNA isolation method for each sample are color coded below the heatmap. Lower panel: Heatmap showing hierarchical clustering of mRNAs that are differentially expressed between the female and male urine samples (q-value ≤0.01).

Comment in

References

    1. Antoury L, Hu N, Balaj L, Das S, Georghiou S, Darras B, Clark T, Breakefield XO, and Wheeler TM (2018). Analysis of extracellular mRNA in human urine reveals splice variant biomarkers of muscular dystrophies. Nat Commun 9, 3906. - PMC - PubMed
    1. Beltrami C, Besnier M, Shantikumar S, Shearn AI, Rajakaruna C, Laftah A, Sessa F, Spinetti G, Petretto E, Angelini GD, et al. (2017). Human Pericardial Fluid Contains Exosomes Enriched with Cardiovascular-Expressed MicroRNAs and Promotes Therapeutic Angiogenesis. Mol Ther 25, 679–693. - PMC - PubMed
    1. Burgos KL, Javaherian A, Bomprezzi R, Ghaffari L, Rhodes S, Courtright A, Tembe W, Kim S, Metpally R, and Van Keuren-Jensen K (2013). Identification of extracellular miRNA in human cerebrospinal fluid by next-generation sequencing. Rna 19, 712–722. - PMC - PubMed
    1. Cheng L, Sharples RA, Scicluna BJ, and Hill AF (2014). Exosomes provide a protective and enriched source of miRNA for biomarker profiling compared to intracellular and cell-free blood. J Extracell Vesicles 3. - PMC - PubMed
    1. Chevillet JR, Kang Q, Ruf IK, Briggs HA, Vojtech LN, Hughes SM, Cheng HH, Arroyo JD, Meredith EK, Gallichotte EN, et al. (2014). Quantitative and stoichiometric analysis of the microRNA content of exosomes. Proc Natl Acad Sci U S A 111, 14888–14893. - PMC - PubMed

Publication types