. 2019 May 16;74(4):801-815.e6.
doi: 10.1016/j.molcel.2019.02.038. Epub 2019 Apr 2.

Interleukin-1β Induces mtDNA Release to Activate Innate Immune Signaling via cGAS-STING

Affiliations

Interleukin-1β Induces mtDNA Release to Activate Innate Immune Signaling via cGAS-STING

Lauren D Aarreberg et al. Mol Cell. .

Abstract

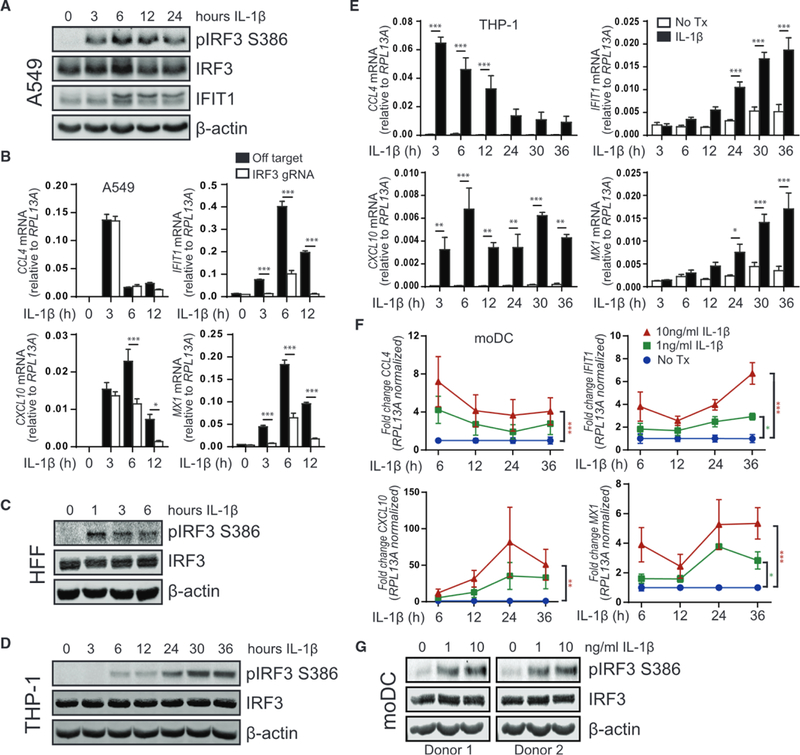
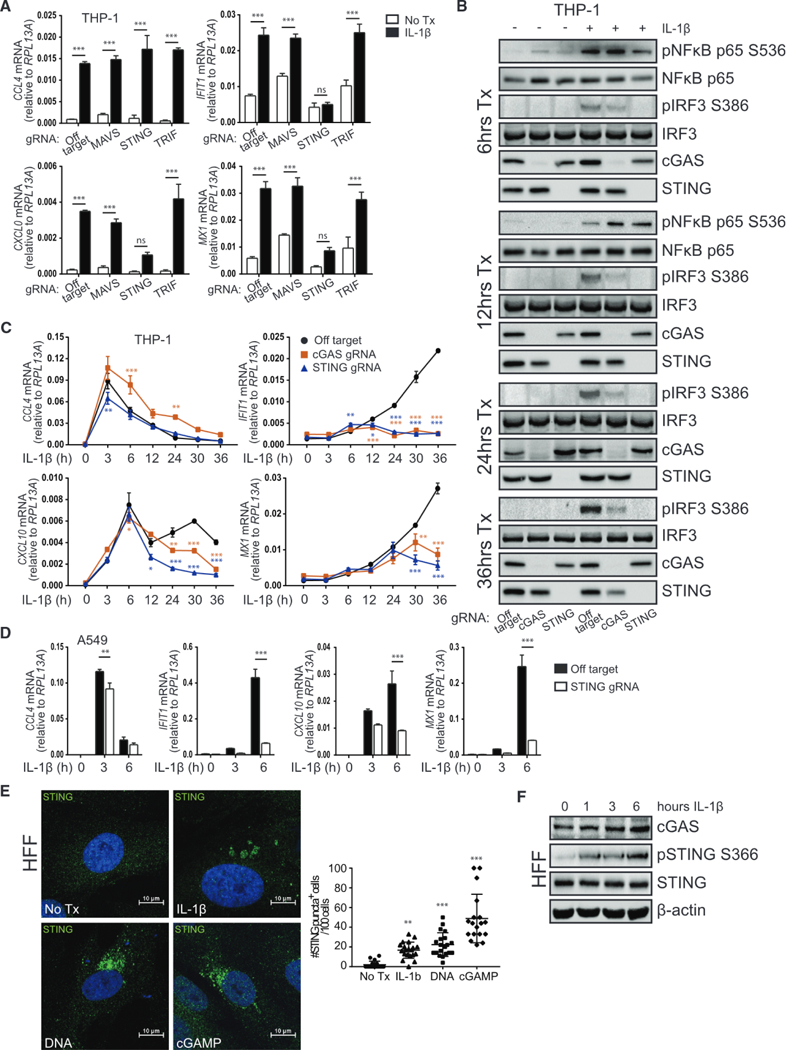
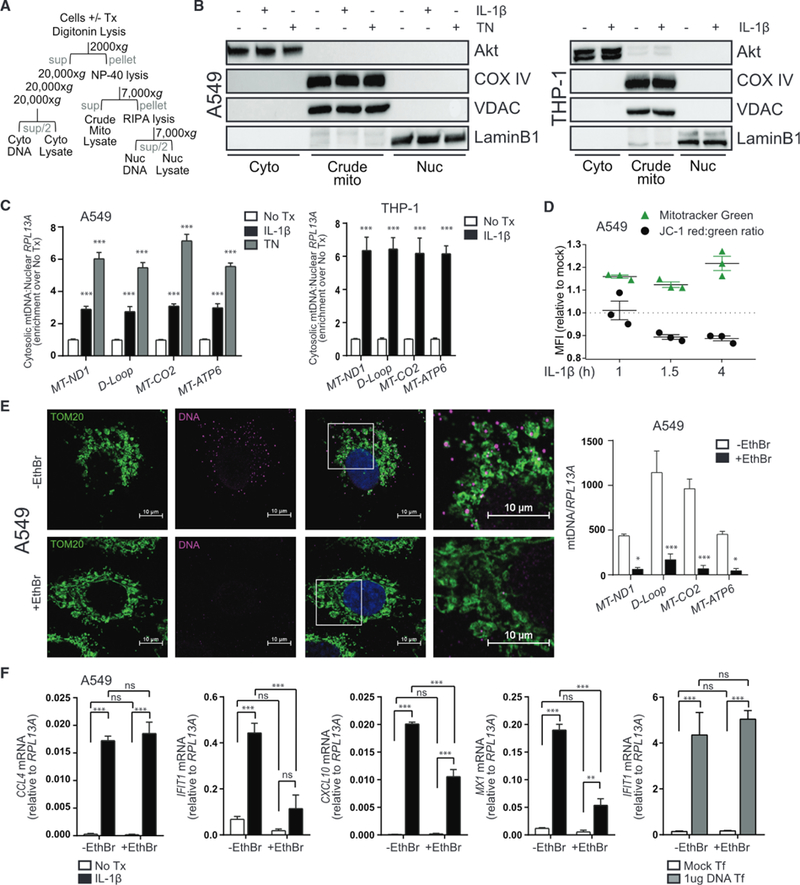
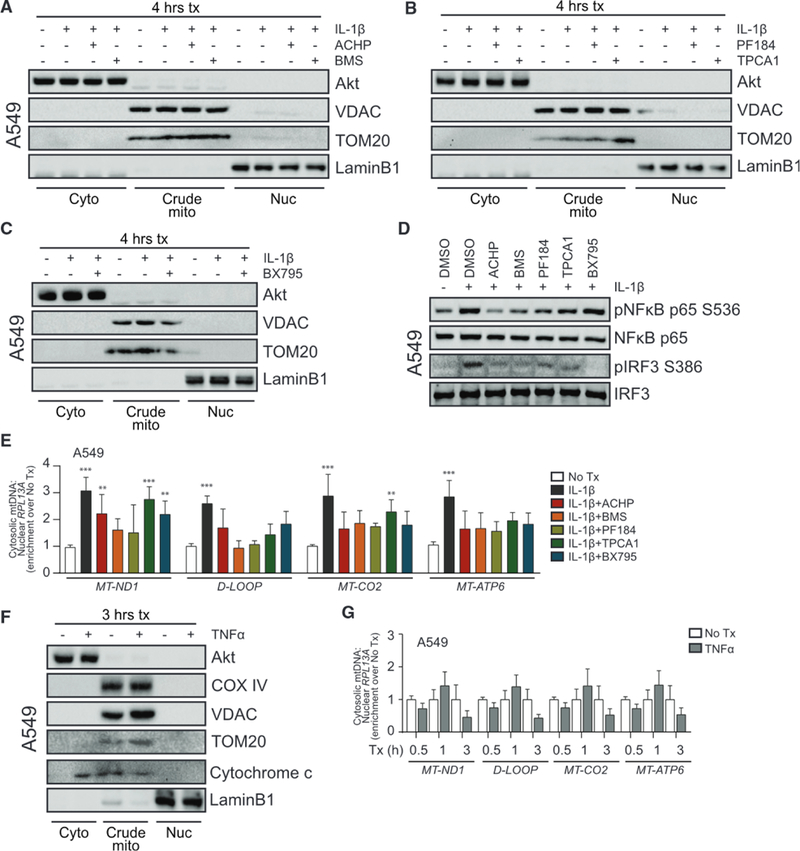
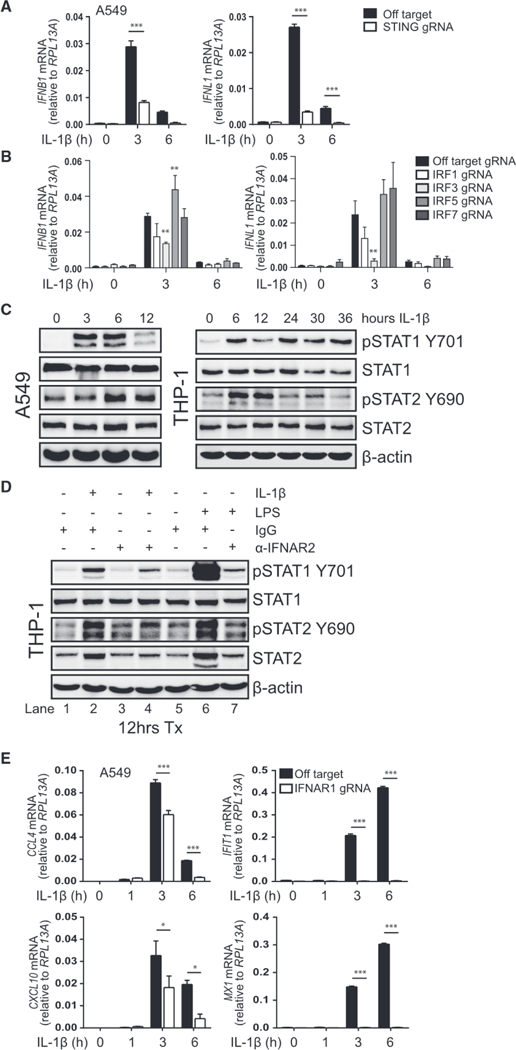
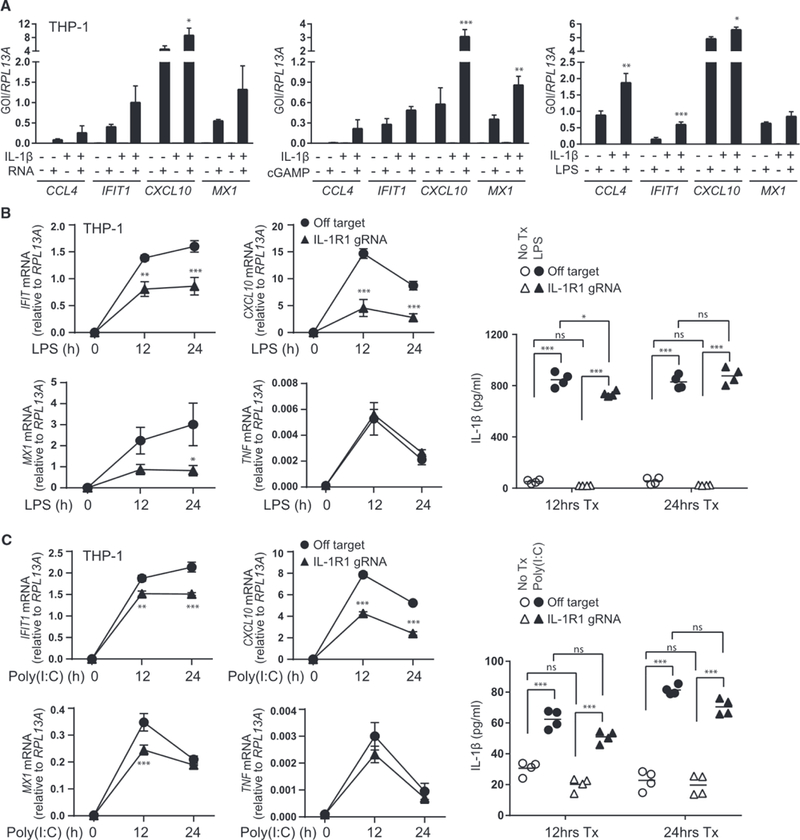
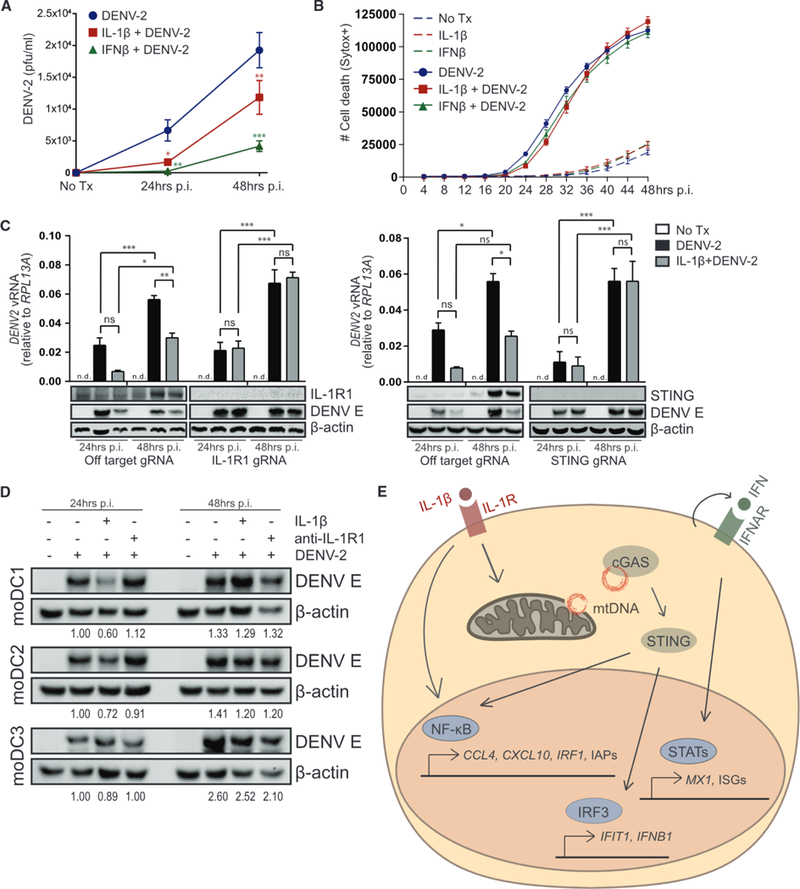
Interleukin-1 beta (IL-1β) is a pleiotropic mediator of inflammation and is produced in response to a wide range of stimuli. During infection, IL-1β production occurs in parallel with the onset of innate antimicrobial defenses, but the contribution of IL-1β signaling to cell-intrinsic immunity is not defined. Here, we report that exogenous IL-1β induces interferon regulatory factor 3 (IRF3) activation in human myeloid, fibroblast, and epithelial cells. IRF3 activation by IL-1β is dependent upon the DNA-sensing pathway adaptor, stimulator of interferon genes (STING), through the recognition of cytosolic mtDNA by cyclic guanosine monophosphate (GMP)-AMP synthase (cGAS). IL-1β treatment results in interferon (IFN) production and activation of IFN signaling to direct a potent innate immune response that restricts dengue virus infection. This study identifies a new function for IL-1β in the onset or enhancement of cell-intrinsic immunity, with important implications for cGAS-STING in integrating inflammatory and microbial cues for host defense.

Keywords: IFN; IL-1; IRF1; IRF3; STING; dengue virus; innate immunity; mitochondria.


Figures

Figure 1.
Figure 1.. Exogenous IL-1β Activates IRF3
(A) A549 was treated with media (0, denoting non-treated control) or 10 ng/mL IL-1β for 3–24 h before protein analysis by immunoblot, n = 4. (B) A549 transduced with lentiCRISPR/Cas9 and off-target gRNA or IRF3-gRNA was treated with media (0) or 10 ng/mL IL-1β for 3–12 h before qRT-PCR analysis. Statistical analysis was performed using Student’s t test and Holm-Sidak to compare genotypes; n = 6 with mean ± SEM. (C) Human foreskin fibroblasts were treated with media (0) or 10 ng/mL IL-1β for 1–6 h before protein analysis by immunoblot, n = 3. (D) THP-1 was treated with media (0) or 10 ng/mL IL-1β for 3–36 h before protein analysis by immunoblot, n = 4. (E) THP-1 was treated with media or 10 ng/mL IL-1β for 3–36 h before qRT-PCR analysis. Statistical analysis was performed using Student’s t test and Holm-Sidak to compare treatments; n = 3 with mean ± SEM. (F) Primary human-monocyte-derived dendritic cells (moDCs) were treated with media or the indicated concentrations of IL-1β for 6–36 h before qRT-PCR analysis. Statistical analysis was performed using two-way ANOVA and Dunnett’s to compare mock to IL-1β treatments; n = 3 with mean ± SEM. (G) moDCs were treated with media or the indicated concentrations of IL-1 β for 36 h before protein analysis by immunoblot, n = 2. *p < 0.05; **p < 0.01; ***p < 0.001. See also Figures S1, S2, and S3 and Table S1.
Figure 2.
Figure 2.. IRF3 Activation in Response to IL-1β Is cGAS and STING Dependent
(A) THP-1 transduced with lentiCRISPR/Cas9 and off-target gRNA or MAVS-, STING-or TRIF-gRNA was treated with media or 10 ng/mL IL-1β for 30 h before qRT-PCR analysis. Statistical analysis was performed using two-way ANOVA and Bonferroni’s to compare treatments; n = 3 with mean ± SEM. (B) THP-1 transduced with lentiCRISPR/Cas9 and off-target gRNA or cGAS-or STING-gRNA was treated with media or 10 ng/mL IL-1β for 6–36 h before protein analysis by immunoblot, n = 2. (C) THP-1 transduced with lentiCRISPR/Cas9 and off-target gRNA or cGAS-or STING-gRNA was treated with media (0) or 10 ng/mL IL-1β for 3–36 h before qRT-PCR analysis. Statistical analysis was performed using two-way ANOVA with Bonferroni’s to compare knockouts to control cells; n = 4 with mean ± SEM. (D) A549 transduced with lentiCRISPR/Cas9 and off-target gRNA or STING-gRNA was treated with media (0) or 10 ng/mL IL-1β for 3–6 h before qRT-PCR analysis. Statistical analysis was performed using Student’s t test and Holm-Sidak to compare genotypes; n = 3 with mean ± SEM. (E) Left: HFFs were treated with media or 10 ng/mL IL-1β, transfected with 1 μg/mL calf thymus DNA, or transfected with 10 μg/mL cGAMP for 3 h on coverslips. Cells were fixed and stained for confocal imaging of STING (green). Nuclei were counterstained with DAPI (blue). Right: quantification of cells positive for STING puncta where each dot represents one field of view. Statistical analysis was performed using one-way ANOVA and Holm-Sidak; n = 4 with mean ± SD. (F) HFF were treated with media (0) or 10 ng/mL IL-1β for 1–6 h before protein analysis by immunoblot, n = 2. *p < 0.05; **p < 0.01; ***p < 0.001. See also Figures S4 and S5.
Figure 3.
Figure 3.. IL-1R Signaling Induces Release of mtDNA to Initiate Innate Immune Activation
(A) Schematic of cell lysis and centrifugation for subcellular fractionation. (B) Left: A549 was treated with media, 10 ng/mL IL-1β, or 4 μg/mL tunicamycin (TN) for 3 h before fractionation and protein analysis by immunoblot. Right: THP-1 was treated with media or 10 ng/mL IL-1β for 36 h before fractionation and protein analysis by immunoblot. (C) Total DNA was harvested from cytosolic and nuclear fractions of A549 (left) or THP-1 (right) treated as in (B) and analyzed by qPCR. Cytosolic mtDNA genes were normalized to respective nuclear RPL13A and presented as fold enrichment over media-treated controls. Statistical analysis was performed using Student’s t test and Holm-Sidak to compare treatments; n = 3 with mean ± SEM. (D) A549 was treated with media or 10 ng/mL IL-1β for 0.5,1, or 3.5 h before incubation with Mitotracker Green or JC-1 dye for an additional 0.5 h. Cells were analyzed by flow cytometry to determine median fluorescence intensity (MFI) of the indicated dyes; n = 3 with mean ± SEM. (E) A549 was cultured for 4 days ± ethidium bromide (EthBr) to deplete mtDNA. Left: untreated and treated cells were fixed on coverslips and stained for confocal imaging of mitochondria (TOM20, green) or DNA (magenta). Nuclei were counterstained with DAPI (blue). Right: treated and untreated cells were subjected to total DNA extraction followed by qPCR analysis for quantification of mtDNA genes. Statistical analysis was performed using Student’s t test and Holm-Sidak to compare treatments; n = 4 with mean ± SEM. (F) EthBr-treated and untreated A549 were exposed to media or 10 ng/mL IL-1β or transfected with 1 μg/mL calf thymus DNA for 6 h before qRT-PCR analysis. Statistical analysis was performed using two-way ANOVA and Bonferroni’s to compare the indicated treatments; n = 4 with mean ± SEM. Cyto, cytoplasm; Mito, mitochondria; Nuc, nucleus; Sup, supernatant; Tf, transfection; *p < 0.05; **p < 0.01; ***p < 0.001. See also Figures S6 and S7.
Figure 4.
Figure 4.. IL-1β-Induced mtDNA Release Is NF-κB Dependent
(A) A549 was treated with media (0) or 10 ng/mL IL-1β for 3 h ± 1 h pretreatment with DMSO or 10 μM IKKα/β inhibitor (2-amino-6-[2-(cyclopropylmethoxy)-6-hydroxyphenyl]-4-piperidin-4-yl nicotinonitrile [ACHP] from Bristol-Meyers Squibb [BMS]) before fractionation and protein analysis by immunoblot. (B) A549 was treated as in (A) with 500 nM IKKβ inhibitor (PF184 and TPCA1). (C) A549 was treated as in (A) with 1 μM TBK1/IKKε inhibitor (BX795). (D) A549 was treated with media or 10 ng/mL IL-1β for 3 h ± 1 h pretreatment with DMSO or the indicated inhibitors before protein analysis by immunoblot. (E) Total DNA was harvested from cytosolic and nuclear fractions of A549 treated as in (A)–(C) and analyzed by qPCR. Cytosolic mtDNA genes were normalized to respective nuclear RPL13A and presented as fold enrichment over media-treated controls. Statistical analysis was performed using two-way ANOVA with Bonferroni’s to compare each treatment to mock; n = 3 with mean ± SEM. (F) A549 was treated with media or 10 ng/mL TNF-α for 3 h before fractionation and protein analysis by immunoblot. (G) Total DNA was harvested from cytosolic and nuclear fractions of A549 treated as in (F) and analyzed by qPCR. Statistical analysis was performed using Student’s t test and Holm-Sidak to compare treatments; n = 3 with mean ± SEM. **p < 0.01; ***p < 0.001.
Figure 5.
Figure 5.. IL-1β Treatment Drives IFN Production and ISG Expression
(A) A549 transduced with lentiCRISPR/Cas9 and off-target gRNA or STING-gRNA was treated with media (0) or 10 ng/mL IL-1β for 3–6 h before qRT-PCR analysis. Statistical analysis was performed using Student’s t test and Holm-Sidak to compare genotypes; n = 3 with mean ± SEM. (B) A549 transduced with lentiCRISPR/Cas9 and off-target gRNA or IRF1-, IRF3-, IRF5-, or IRF7-gRNA was treated with media (0) or 10 ng/mL IL-1β for 3–6 h before qRT-PCR analysis. Statistical analysis was performed using two-way ANOVA with Dunnett’s to compare knockouts to control cells; n = 3 with mean ± SEM. (C) A549 (left) or THP-1 (right) was treated with media (0) or 10 ng/mL IL-1β for the indicated time before protein analysis by immunoblot; n = 2 (A549) or n = 3 (THP-1). (D) THP-1 was treated with media, 10 ng/mL IL-1β, or 0.5 μg/mL LPS in the presence of 0.5 μg/mL immunoglobulin G (IgG) control or 0.5 μg/mL anti-IFNAR2 for 12 h before protein analysis by immunoblot, n = 2. Lanes 1 and 5 are redundant. (E) A549 transfected with CRISPR/Cas9 and off-target gRNA or IFNAR1-gRNA was treated with media (0) or 10 ng/mL IL-1β for 1–6 h before qRT-PCR analysis. Statistical analysis was performed using Student’s t test and Holm-Sidak to compare genotypes; n = 3 with mean ± SEM. *p < 0.05; **p < 0.01; ***p < 0.001.
Figure 6.
Figure 6.. Synergistic Response to IL-1β and PAMPs
(A) THP-1 was treated with media or 10 ng/mL IL-1β for 30 h before the addition of media or 0.1 μg/mL PAMP RNA (left, transfected), 25 μg/mL cGAMP (middle, exogenous), or 0.5 μg/mL LPS (right) for 6 h followed by qRT-PCR analysis. Statistical analysis was performed using one-way ANOVA and Holm-Sidak to compare the sum of monotreatments to cotreatment; n = 4 (PAMP RNA) or n = 3 (cGAMP and LPS) with mean ± SEM. (B and C) THP-1 transduced with lentiCRISPR/Cas9 and off-target gRNA or IL-1R1-gRNA was treated with media (0) or 0.5 μg/mL LPS (B) or transfected with 1 μg/mL poly(l:C) (C) for 12–24 h. Left: the indicated transcripts were analyzed by qRT-PCR. Statistical analysis was performed using Student’s t test and Holm-Sidak to compare genotypes, n = 4 with mean ± SEM. Right: cell-free supernatants were analyzed for IL-1β secretion by ELISA. Statistical analysis was performed using two-way ANOVA and Bonferroni’s to compare the indicated treatments; n = 4 with mean indicated. GOI, gene of interest; *p < 0.05; **p < 0.01; ***p < 0.001.
Figure 7.
Figure 7.. IL-1 β-cGAS-STING-IRF3 Axis Restricts Dengue Virus Infection
(A) Analysis of DENV-2 infectious virus by plaque assay using cell-free supernatants from A549 pretreated with media, 10 ng/mL IL-1β, or 50 lU/mL IFNβ for 6 h before DENV-2 infection for 24–48 h (MOI = 0.5). Statistical analysis was performed using two-way ANOVA and Bonferroni’s to compare media to cytokine pretreatment; n = 3 with mean ± SEM. (B) A549 pretreated with media, 10 ng/mL IL-1β, or 50 lU/mL IFNβ for 6 h were mock or DENV-2 infected (MOI = 0.5) and imaged by IncuCyte live-cell imaging to quantify cell death over 48 h. Data represent technical triplicates with mean ± SEM. (C) A549 transduced with lentiCRISPR/Cas9 and off-target gRNA or IL-1R1-gRNA (left) or STING-gRNA (right) was pretreated with media or 10 ng/mL IL-1β for 6 h before DENV-2 infection for 24–48 h (MOI = 0.5). (Upper) Viral RNA was analyzed by qRT-PCR. Statistical analysis was performed using two-way ANOVA and Bonferroni’s to compare the indicated treatments; n = 5 (IL-1R1) or n = 3 (STING) with mean ± SEM. (Lower) Protein analysis by immunoblot is shown; n = 3 (IL-1 R1) or n = 2 (STING). (D) Primary human moDCs were pretreated with media or 10 ng/mL IL-1β for 6 h before DENV-2 infection (MOI = 1). 2 h post-adsorption, media were replaced ±1 μg/mL anti-IL-1R1. Protein analysis by immunoblot 24–48 h p.i. DENV E was normalized to actin and quantified relative to 24 h DENV-2 infection; n = 3. (E) Model of IL-1β-cGAS-STING-IRF3 axis in which IL-1R signaling leads to the cytosolic release and detection of mtDNA, activation of STING and IRF3, and downstream production and response to IFN. pfu, plaque forming unit; p.i., post-infection; vRNA, viral RNA; *p < 0.05; **p < 0.01; ***p < 0.001.

References

    1. Aarreberg LD, Wilkins C, Ramos HJ, Green R, Davis MA, Chow K, and Gale M Jr. (2018). Interleukin-1β signaling in dendritic cells induces antiviral interferon responses. MBio 9, e00342–18. - PMC - PubMed
    1. Aguirre S, and Fernandez-Sesma A (2017). Collateral damage during dengue virus infection: making sense of DNA by cGAS. J. Virol. 91, e01081–16. - PMC - PubMed
    1. Aguirre S, Luthra P, Sanchez-Aparicio MT, Maestre AM, Patel J, Lamothe F, Fredericks AC, Tripathi S, Zhu T, Pintado-Silva J, et al. (2017). Dengue virus NS2B protein targets cGAS for degradation and prevents mitochondrial DNA sensing during infection. Nat. Microbiol. 2, 17037. - PMC - PubMed
    1. Ahn J, Gutman D, Saijo S, and Barber GN (2012). STING manifests self DNA-dependent inflammatory disease. Proc. Natl. Acad. Sci. USA 109, 19386–19391. - PMC - PubMed
    1. Brierley MM, and Fish EN (2002). Review: IFN-alpha/beta receptor interactions to biologic outcomes: understanding the circuitry. J. Interferon Cytokine Res. 22, 835–845. - PubMed

Publication types

MeSH terms