. 2019 Apr:42:252-269.
doi: 10.1016/j.ebiom.2019.03.064. Epub 2019 Apr 3.

Gene signatures of quiescent glioblastoma cells reveal mesenchymal shift and interactions with niche microenvironment

Affiliations

Gene signatures of quiescent glioblastoma cells reveal mesenchymal shift and interactions with niche microenvironment

Rut Tejero et al. EBioMedicine. 2019 Apr.

Abstract

Background: Glioblastoma (GBM), a highly malignant brain tumor, invariably recurs after therapy. Quiescent GBM cells represent a potential source of tumor recurrence, but little is known about their molecular underpinnings.

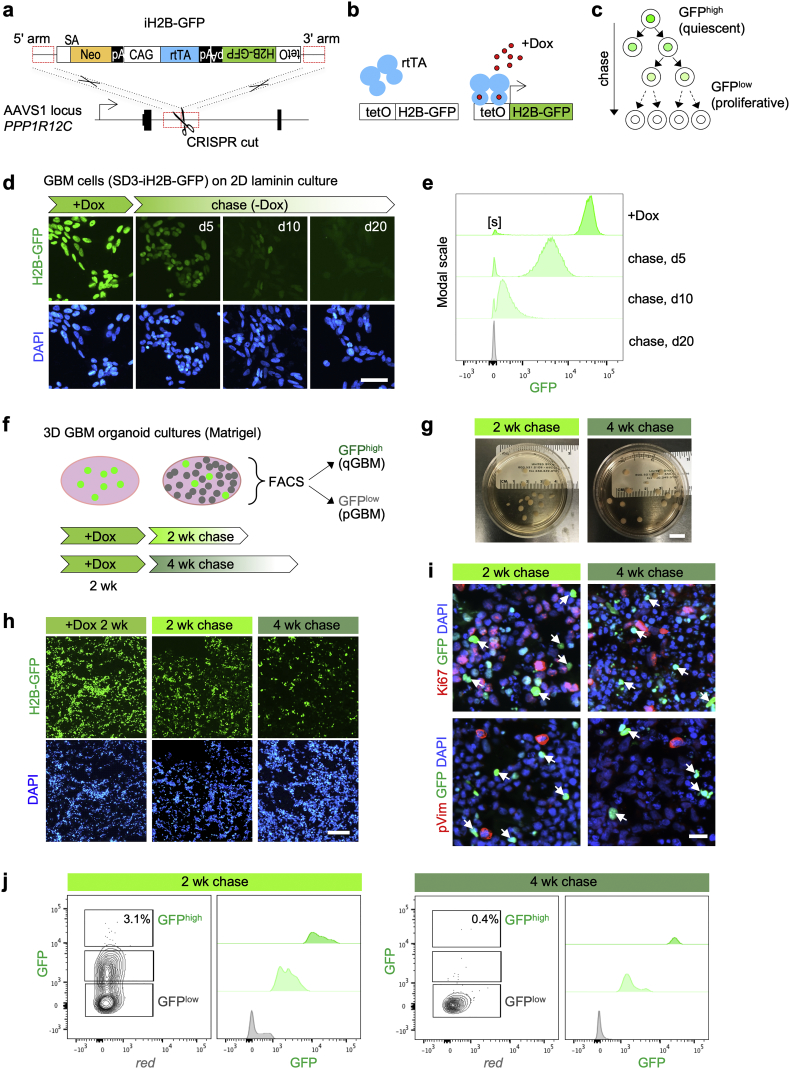
Methods: Patient-derived GBM cells were engineered by CRISPR/Cas9-assisted knock-in of an inducible histone2B-GFP (iH2B-GFP) reporter to track cell division history. We utilized an in vitro 3D GBM organoid approach to isolate live quiescent GBM (qGBM) cells and their proliferative counterparts (pGBM) to compare stem cell properties and therapy resistance. Gene expression programs of qGBM and pGBM cells were analyzed by RNA-Seq and NanoString platforms.

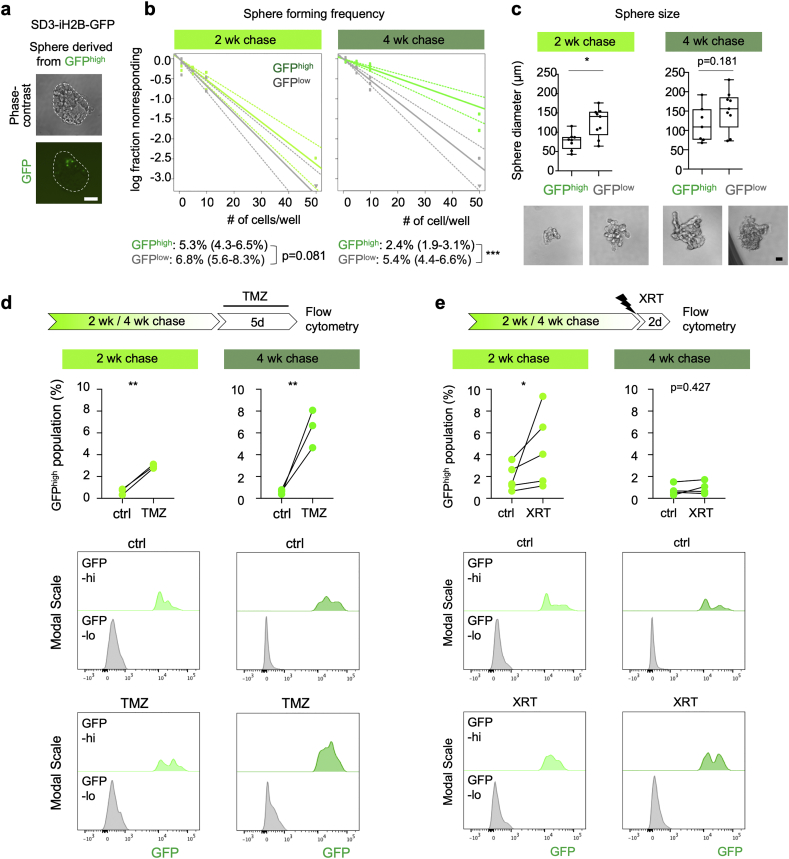
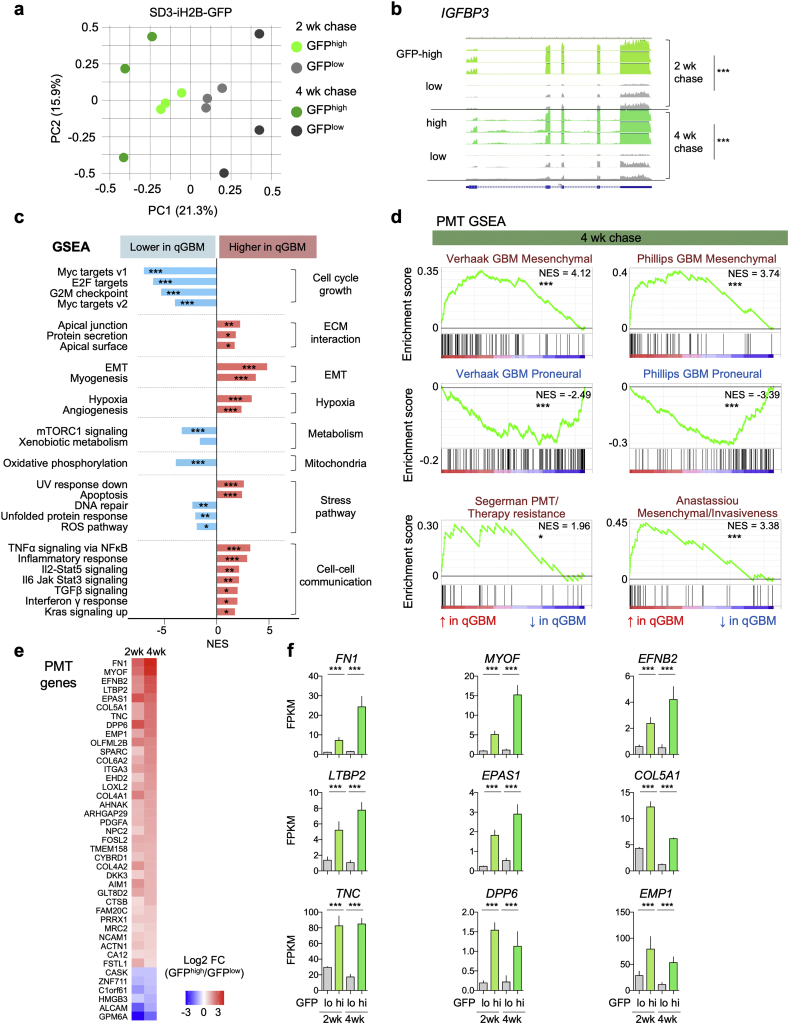
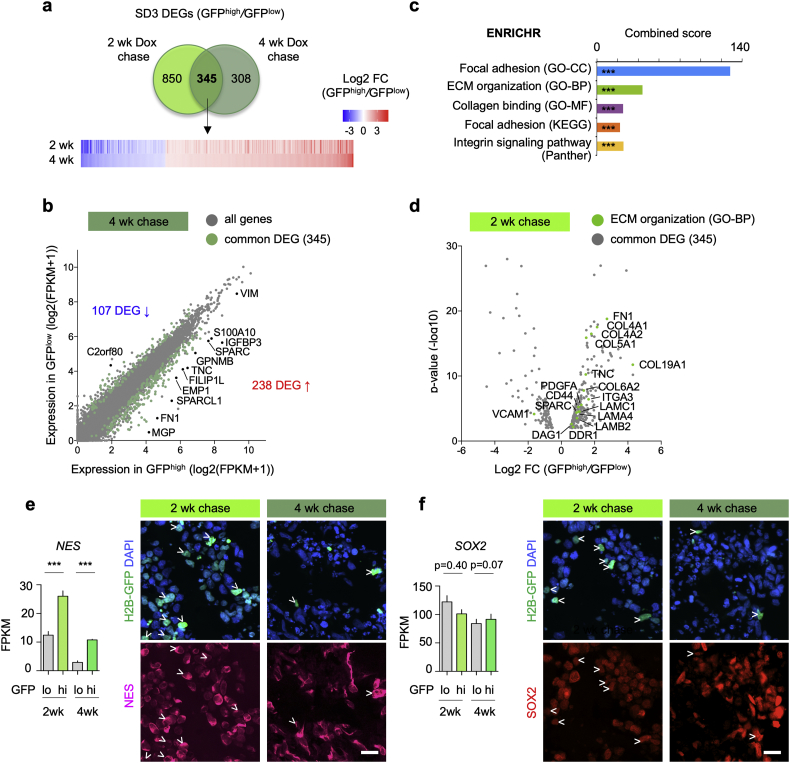
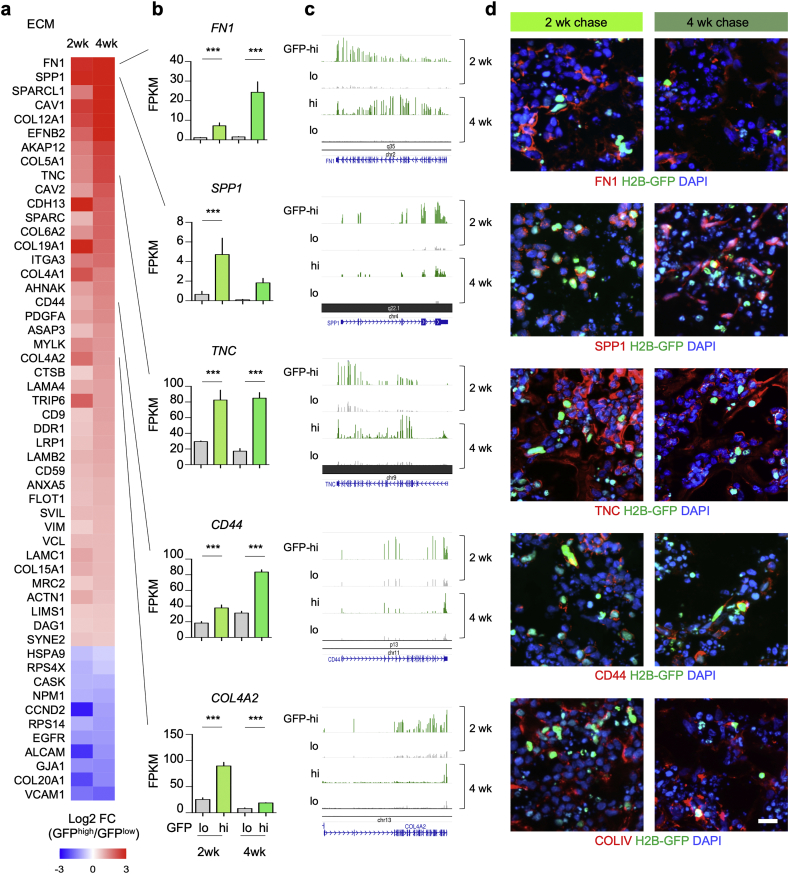
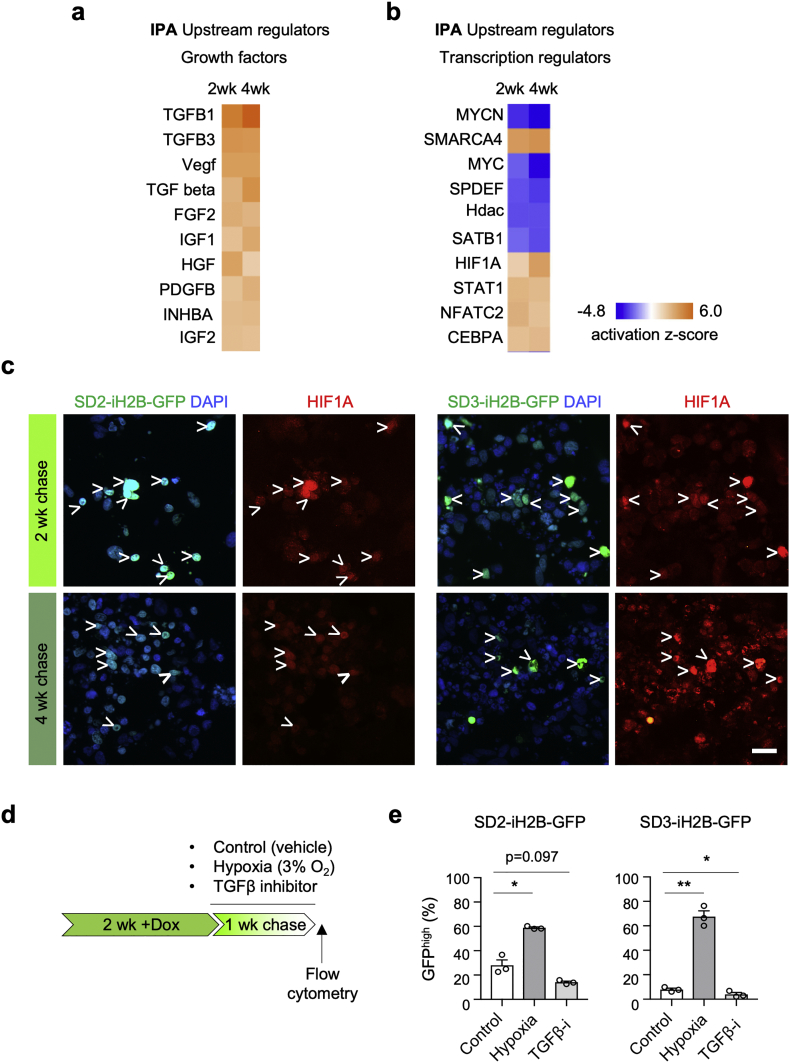
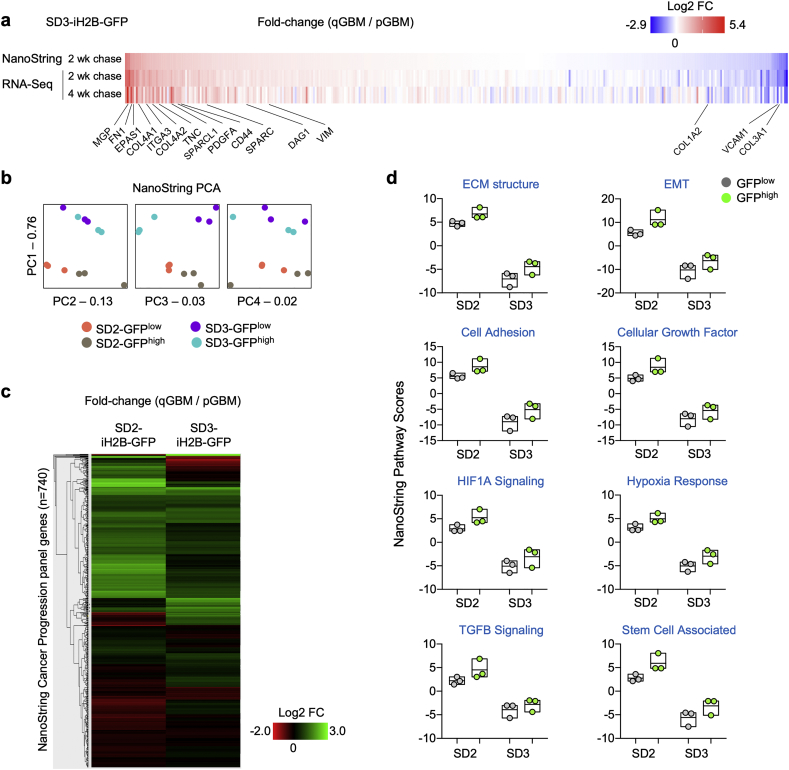
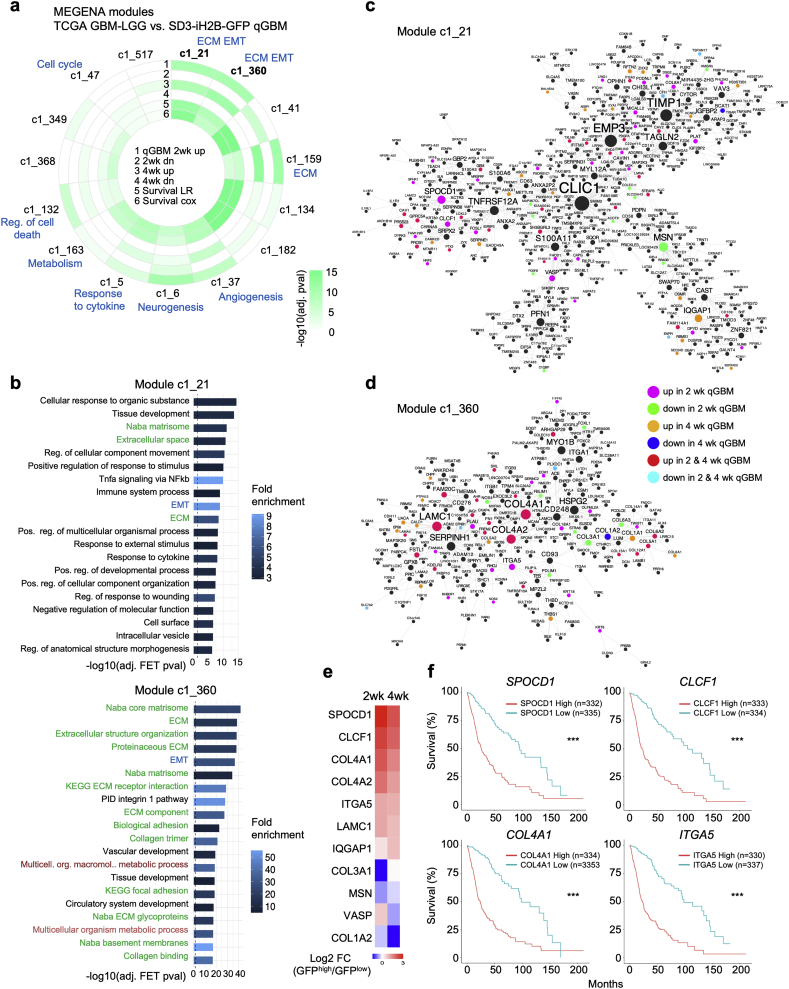
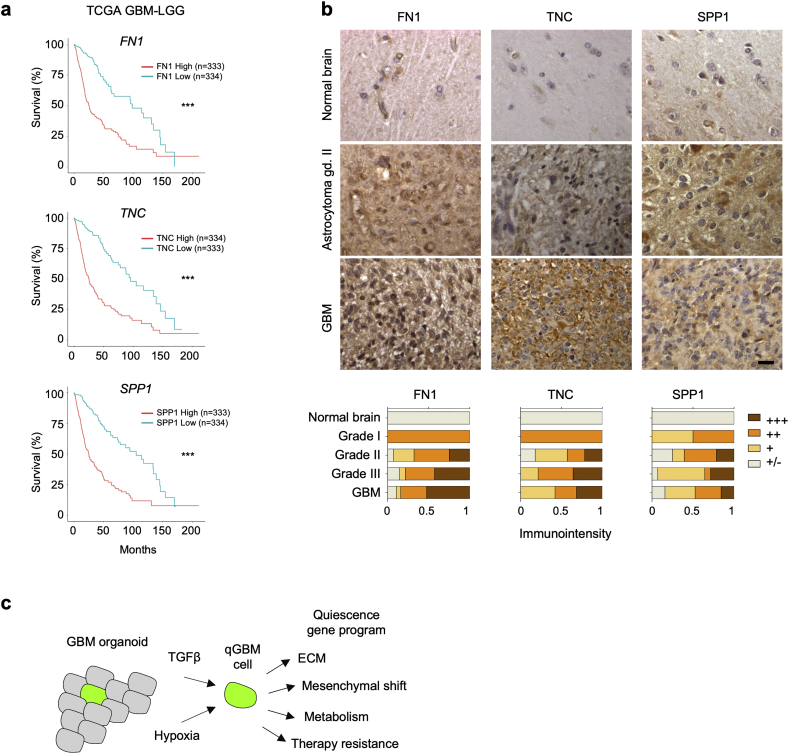
Findings: H2B-GFP-retaining qGBM cells exhibited comparable self-renewal capacity but higher therapy resistance relative to pGBM. Quiescent GBM cells expressed distinct gene programs that affect cell cycle control, metabolic adaptation, and extracellular matrix (ECM) interactions. Transcriptome analysis also revealed a mesenchymal shift in qGBM cells of both proneural and mesenchymal GBM subtypes. Bioinformatic analyses and functional assays in GBM organoids established hypoxia and TGFβ signaling as potential niche factors that promote quiescence in GBM. Finally, network co-expression analysis of TCGA glioma patient data identified gene modules that are enriched for qGBM signatures and also associated with survival rate.

Interpretation: Our in vitro study in 3D GBM organoids supports the presence of a quiescent cell population that displays self-renewal capacity, high therapy resistance, and mesenchymal gene signatures. It also sheds light on how GBM cells may acquire and maintain quiescence through ECM organization and interaction with niche factors such as TGFβ and hypoxia. Our findings provide a starting point for developing strategies to tackle the quiescent population of GBM. FUND: National Institutes of Health (NIH) and Deutsche Forschungsgemeinschaft (DFG).

Keywords: GBM organoid; Glioblastoma; H2B-GFP; Proneural-mesenchymal transition; Stem cell niche; Tumor quiescence.


Figures

Fig. 1
Fig. 1
Tracking cell division with iH2B-GFP reporter identifies quiescent population in GBM organoids. a) Targeting strategy for iH2B-GFP reporter knock-in by CRISPR-assisted homologous recombination into AAVS1 locus (gene symbol PPP1R12C). SA: splice acceptor; Neo: Neomycin resistance gene; pA: poly-adenylation signal; CAG: CAG promoter; rtTA: reverse tetracycline-controlled transactivator; H2B-GFP: histone2B-green fluorescent protein; tetO: tet operator. b) Principle of doxycyline (Dox)-inducible expression of H2B-GFP. c) Schematic depiction of divisional dilution of H2B-GFP label during -Dox chase period. Quiescent cells retain H2B-GFP label (GFPhigh), while proliferative cells dilute the label (GFPlow). d) GBM cell line SD3-iH2B-GFP grown as proliferative culture on 2D laminin-coated dishes. In the presence of doxycycline (+Dox), nuclei are uniformly labeled with H2B-GFP. Cells dilute H2B-GFP label during -Dox chase periods (5, 10, and 20 days shown) by cell division. DAPI is used for nuclear counter staining. e) Flow cytometry analysis of SD3-iH2B-GFP cells grown on 2D laminin for the indicated -Dox chase periods. A small fraction of SD3-iH2B-GFP cells remained GFP-negative even in +Dox conditions (denoted as “[s]”), possibly due to sporadic silencing of transgene. Histograms are normalized on y-axis to modal scale (FlowJo). f) Experimental design for isolation of quiescent GBM cells from 3D GBM organoids. GBM organoids are generated by seeding cells in Matrigel droplets and expanding them as floating cultures. After growth for 2 weeks with +Dox pulse, organoids are chased for 2 or 4 weeks in -Dox conditions. Dissociated cells are separated into GFPhigh and GFPlow populations by FACS. g) Images of GBM organoids in culture dishes, after 2 or 4 week -Dox chase periods. h) Fluorescence images of sections of 3D GBM organoids show a declining number of label-retaining GFPhigh cells during organoid expansion. i) Immunofluorescence images show absence of proliferation markers Ki67 and phospho-Vimentin (pVim) in GFPhigh cells (arrows), confirming slow dividing nature of GFPhigh cells. Notice debris from dead cells accumulates during organoid culture, which is more prominent after 4 week chase. j) Representative FACS results of GBM organoids analyzed after 2 or 4 week -Dox chase. After 2 week -Dox chase, 3·1% of cells remained GFPhigh; after 4 week chase, only 0·4% of cells remained GFPhigh. Three independent experiments (10–12 pooled organoids per experiment) yielded similar results. X-axis in left histograms shows red auto-fluorescence of cells. Histograms are normalized on y-axis to modal scale (FlowJo). Scale bars: 50 μm (d), 10 mm (g), 200 μm (h), 20 μm (i).(For interpretation of the references to colour in this figure legend, the reader is referred to the web version of this article.).
Fig. 2
Fig. 2
Quiescent GBM cells exhibit self-renewal capacity and enhanced therapy resistance. a) Phase-contrast and fluorescence images of a representative gliomasphere derived from GFPhigh cells after 10 day culture show that most previously GFPhigh cells have diluted their H2B-GFP label by cell divisions. b) Limiting dilution sphere formation assay with GFPhigh and GFPlow cells. FACS-sorted cells from GBM organoids after 2 or 4 week -Dox chase were seeded in limiting dilutions in 96 well plates. Sphere forming frequency was quantified after 10 days by ELDA software. Results were generated from three independent experiments. Numbers in parenthesis represent 95% confidence interval. Statistical analysis was performed with ELDA software. ***, p < 0·001. c) Sphere sizes and representative images of gliomaspheres derived from GFPhigh or GFPlow cells after 10 days of culture, with 10 cells seeded per well. Ten spheres per group were measured. Boxplots show 25th, 50th, and 75th percentiles of sphere diameters and whiskers represent minimum and maximum values. Statistical analysis was performed using Mann-Whitney test. *, p < 0·05. d) Drug sensitivity assay for temozolomide (TMZ). Organoids after 2 or 4 week of –Dox chase were treated for 5 days with vehicle or 250 μM TMZ, and the fraction of live GFPhigh cells in organoids was quantified by flow cytometry. Quantification (middle panel) and flow cytometry histograms (bottom panels, y-axis normalized to modal scale) show that a higher proportion of surviving cells were GFPhigh in TMZ-treated organoids as compared to vehicle treatment (ctrl). Data were obtained from three independent experiments (10–12 pooled organoids per experiment). Significance was evaluated by binomial generalized linear mixed effect models. **, p < 0·01. e) Radiation sensitivity assay. Organoids after 2 or 4 wk. chase were irradiated with one dose of 5 Gy, and 2 days later the fraction of live GFPhigh cells in organoids was quantified. Quantification (middle panel) and flow cytometry histogram (bottom panels) show a larger fraction of GFPhigh cells after XRT-treatment as compared to control (ctrl) in the 2 week chase paradigm, and a trend in the 4 week chase paradigm. Data represents five and four independent experiments for 2 week and 4 week chase, respectively. Significance was evaluated with binomial generalized linear mixed effect models. *, p < 0·05. Scale bars: 50 μm (a, c).
Fig. 3
Fig. 3
Quiescent GBM cells express unique gene signature with proneural-mesenchymal shift. a) Principal component analysis (PCA) of RNA-Seq gene expression profiles from SD3 GFPhigh or GFPlow populations after 2 or 4 week -Dox chases. Each paradigm was replicated with three independent experimental samples. b) RNA-Seq coverage tracks for differentially expressed gene IGFBP3 in GFPhigh and GFPlow populations after the indicated -Dox chases (track scales normalized by GAPDH expression). Statistical analysis was conducted with edgeR analysis of read counts, with Benjamini-Hochberg correction. *** indicates p < 0·001. c) Gene set enrichment analysis (GSEA; Hallmark gene sets) of gene expression changes in SD3 GFPhigh vs. GFPlow populations (data from 4 week chase organoids shown). NES, normalized enrichment score. Significance calculated by GSEA for False discovery rate (FDR)-adjusted q-value. *, ** and *** indicate q < 0·05, q < 0·01 and q < 0·001, respectively. d) GSEA results of the gene sets that are related to GBM transcriptional subtypes suggest proneural-mesenchymal transition (PMT) in SD3 GFPhigh cells (data from 4 week chase organoids shown). NES, normalized enrichment score. *, and *** indicate FDR-adjusted q < 0·05, and q < 0·001, respectively. e) Heatmap of expression changes of PMT genes that are differentially expressed in SD3 GFPhigh cells relative to GFPlow cells from 2 wk and 4 wk chase organoids. f) Absolute expression levels of the top differentially regulated PMT genes in SD3 GFPhigh or GFPlow populations in 2 and 4 week -Dox chase organoids. Data obtained from three independent experiments. Bars represent mean FPKM values and error bars represent standard error of the mean. Significance was evaluated using edgeR analysis of read counts, with Benjamini-Hochberg correction. *** indicates p < 0·001.
Fig. 4
Fig. 4
qGBM cells engage ECM interaction. a) Venn diagram illustrates overlap of differentially expressed genes (DEGs; significance cut-off of adjusted p < 0·01; filtered for protein-coding genes) in GFPhigh relative to GFPlow cells from SD3-iH2B-GFP GBM organoids at 2 and 4 week -Dox chase stages. Data were obtained from three independent experiments for each paradigm. Bottom, heatmap depicts fold-changes of transcription of 345 common DEG at 2 and 4 week -Dox chase stages. b) Dot plot of genes by absolute expression levels in GFPhigh (x-axis) and GFPlow cells (y-axis; 4 week chase paradigm). DEGs shared by GFPhigh cells at 2 and 4 wk chase are marked by green dots. About twice as many DEGs were upregulated than downregulated in GFPhigh cells. Selected DEGs are labeled. c) ENRICHR gene ontology (GO) and pathway analysis of common DEGs of SD3 qGBM cells reveals highest enrichment for ontologies/pathways associated with ECM interaction and ECM components (CC, Cellular Component; BP, Biological Pathway; MF, Molecular Function). Top result of each category is shown. X-axis indicates combined score as calculated by ENRICHR (adjusted p-value multiplied by z-score). *** indicates p < 0·001. d) Volcano plot showing significantly regulated genes of GO term ECM organization (marked by green dots) among common DEGs (2 week chase organoid). e, f) Gene expression graphs and immunofluorescence images of 3D GBM organoids for neural stem cell markers Nestin and SOX2. While Nestin (e) was upregulated in qGBM (GFPhigh) cells (arrowheads), SOX2 (f) was not significantly changed. Data were combined from three independent experiments per paradigm. Statistical analysis was performed using edgeR analysis of read counts, with Benjamini-Hochberg correction. *** indicates p < 0·001. Scale bars: 20 μm (e, f). (For interpretation of the references to colour in this figure legend, the reader is referred to the web version of this article.)
Fig. 5
Fig. 5
Expression of ECM associated genes in GBM organoids. a) Heatmap of expression changes of DEGs associated with ECM interaction in SD3 qGBM relative to pGBM cells from 2 and 4 week -Dox chase organoids. b-d) Selected qGBM DEGs associated with ECM interaction denoted in (a) are shown by absolute transcription levels (b), RNA-Seq read coverage tracks (c), and immunofluorescence images in GBM organoids at 2 or 4 week -Dox chase (d). Data were combined from three independent experiments per paradigm. Statistical analysis was performed using edgeR analysis of read counts, with Benjamini-Hochberg correction. SPP1 gene expression was not detectable in GFPlow cells at 4 week -Dox chase, hence no p-value could be calculated. Scale bar: 20 μm (d).
Fig. 6
Fig. 6
Functional assays confirm role of TGFβ and hypoxia in promoting GBM cell quiescence. a, b) Upstream regulator analysis of common DEGs in SD3 qGBM cells with Ingenuity pathway analysis (IPA), filtered for growth factors (a) or transcriptional regulators (b). TGFβ family members were top candidate upstream growth factors for quiescence gene program. The terms Vegf, Tgf beta, and Hdac denote gene families with multiple members. MYC and MYCN were top transcriptional regulators with negative activation z-score. c) Immunofluorescence staining for hypoxia-induced factor 1α (HIF1A) demonstrates hypoxia signaling in quiescent GBM cells (H2B-GFP+; arrowheads) of SD2- and SD3-iH2B-GFP organoids. d) Experimental paradigm for functional intervention on GBM organoids during one week chase period. e) Quantification of GFPhigh cells in SD2- or SD3-iH2B-GFP organoids after 1 week chase revealed that hypoxia (3% O2) increased ratio of qGBM cells. In contrast, treatment with TGFβ inhibitor SB-431542 (TGFβ-i) reduced ratio of qGBM cells. Data were combined from three independent experiments (10–12 pooled organoids per experiment). Significance was evaluated by paired t-test. * and ** indicate p < 0·05 and p < 0·01, respectively. Scale bar: 20 μm (c).
Fig. 7
Fig. 7
Gene expression analysis of qGBM cells from different GBM subtype confirms mesenchymal shift in quiescent GBM cells of 3D organoids. a) Heatmaps of gene expression changes of qGBM relative to pGBM cells in 3D organoids as measured by NanoString and RNA-Seq verified reliability of Nanostring platform as compared to RNA-Seq approach to measure gene expression changes. Selected common DEGs are labeled. b) Principal component analysis (PCA) of NanoString gene expression profiles from SD2- and SD3-iH2B-GFP GFPhigh or GFPlow populations after 2 or 4 week -Dox chases (three independent experiments per paradigm). c) Heatmap of gene expression changes of qGBM relative to pGBM cells in SD2 and SD3 organoids shows largely common patterns, with some differences between the two cell lines (note: SD2 cells are classified as mesenchymal GBM subtype, SD3 cells as proneural GBM subtype). d) NanoString pathway score analysis of gene expression changes in SD2 and SD3 qGBM relative to pGBM cells reveals a common pattern of increased pathway scores for pathways associated with ECM, EMT, hypoxia, and TGFβ signaling. Each data point represents an independent experiment with 10–12 pooled organoids.
Fig. 8
Fig. 8
Analysis of TCGA glioma patient data for gene co-expression modules that are enriched for qGBM signatures and associated with survival. a) MEGENA gene co-expression modules from TCGA glioma patient data that show enrichment for genes up or downregulated in qGBM cells at 2 or 4 weeks chase. Modules are ranked by their enrichment for qGBM genes and association with patient survival. Tracks, starting from outermost: enrichment for genes up- or downregulated at 2 (tracks 1 and 2, respectively) or 4 weeks (tracks 3 and 4, respectively); log-rank (track 5) and Cox regression (track 6) p-values of association of module first principal component (PC1) with survival in TCGA patient cohort. Selected enriched functions of the modules are indicated in blue. b) Functional annotation terms (MSigDB, WikiPathways) that are enriched in the two highest ranked modules c1_21 and c1_360. Top 20 significant terms shown (Fisher's Exact Test for overrepresentation, Benjamini-Hochberg-adjusted p ≤ 0·05). Up to 20 top enriched terms in all modules that are significantly enriched for qGBM signature are provided in Supplemental Table S3. Green text font highlights ECM associated functions, blue EMT program, and dark red metabolism-associated functions. c, d) Network visualization of gene connectivity and hub genes of modules c1_21 (c) and c1_360 (d). Node size is proportional to number of neighboring genes. Colour legend indicates if a network gene is also a DEG in qGBM at 2 or 4 week -Dox chase stages. e) Heatmap depicting expression changes of hub genes identified by network analysis (c, d) that are differentially expressed in qGBM relative to pGBM cells. Colour key represents log2 fold change (FC). f) Kaplan-Meier survival graphs of glioma patients stratified by high or low expression of the indicated hub genes (TCGA GBM-LGG dataset; split by median gene expression; web platform GlioVis (http://gliovis.bioinfo.cnio.es/)). Horizontal axis indicates duration (months) since initial diagnosis. Statistical analysis was carried out by log-rank test. *** indicates p < 0·001. (For interpretation of the references to colour in this figure legend, the reader is referred to the web version of this article.)
Fig. 9
Fig. 9
Expression of ECM-associated quiescence genes correlates with glioma grade and patient survival. a) Kaplan-Meier survival graphs of glioma patients stratified by high or low expression of selected ECM-associated DEG of qGBM cells (TCGA GBM-LGG dataset; split by median gene expression; web platform GlioVis (http://gliovis.bioinfo.cnio.es/)). Horizontal axis indicates duration (months) since initial diagnosis. Statistical analysis was carried out by log-rank test. *** indicates p < 0·001. b) Immunohistochemistry images of glioma samples on tissue microarray for ECM components show increased protein expression of SPP1, FN1, and TNC in high grade gliomas. Bottom panels show quantification of staining intensities in different samples (arbitrary scale). c) Model of quiescence gene programs and niche factors for quiescent GBM cells, derived from our in vitro GBM organoid studies. Scale bar: 20 μm (b).

References

    1. Kleinhues P., Barnholtz-Sloan J., Ohgaki H. World Cancer report 2014. International Agency for Research on Cancer; Lyon: 2014. Tumours of the nervous system.
    1. Ostrom Q.T., Gittleman H., Xu J., Kromer C., Wolinsky Y., Kruchko C. CBTRUS statistical report: primary brain and other central nervous system tumors diagnosed in the United States in 2009-2013. Neuro Oncol. 2016;18(suppl_5):v1–v75. - PMC - PubMed
    1. Huse J.T., Holland E.C. Targeting brain cancer: advances in the molecular pathology of malignant glioma and medulloblastoma. Nat Rev Cancer. 2010;10(5):319–331. - PubMed
    1. Chen J., McKay R.M., Parada L.F. Malignant glioma: lessons from genomics, mouse models, and stem cells. Cell. 2012;149(1):36–47. - PMC - PubMed
    1. Visvader J.E. Cells of origin in cancer. Nature. 2011;469:314–322. - PubMed

MeSH terms