. 2019 Jul 1;25(13):4155-4167.
doi: 10.1158/1078-0432.CCR-18-3517. Epub 2019 Apr 5.

Targeting High Mobility Group Box-1 (HMGB1) Promotes Cell Death in Myelodysplastic Syndrome

Affiliations

Targeting High Mobility Group Box-1 (HMGB1) Promotes Cell Death in Myelodysplastic Syndrome

Angel Y F Kam et al. Clin Cancer Res. .

Abstract

Purpose: Myelodysplastic syndrome (MDS) is associated with a dysregulated innate immune system. The purpose of this study was to determine whether modulation of the innate immune system via high mobility group box-1 (HMGB1) could reduce cell viability in MDS.

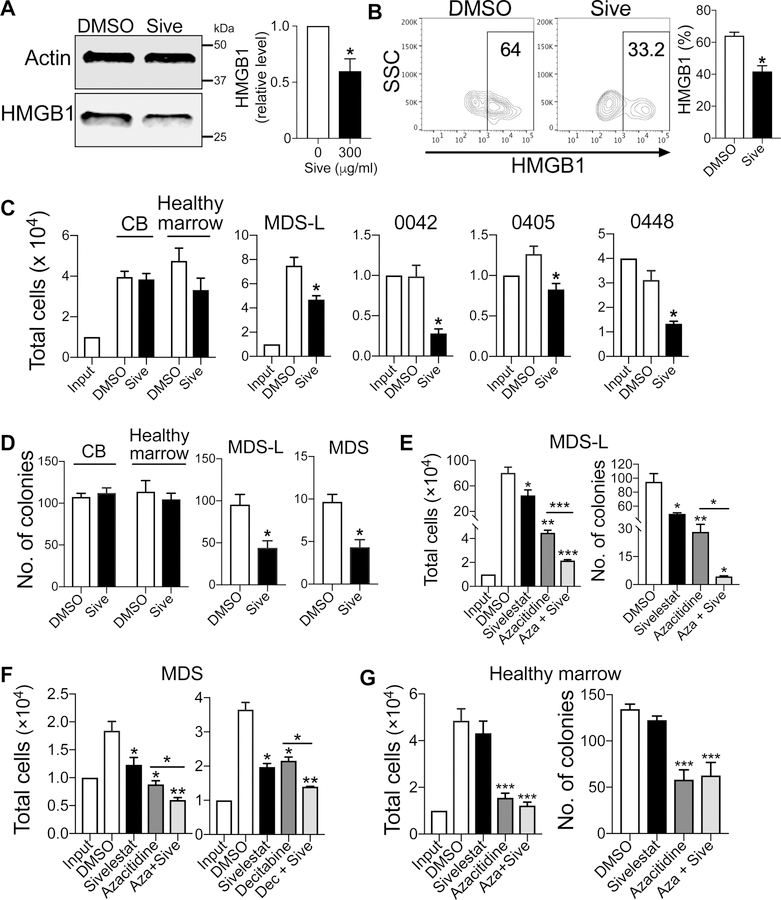
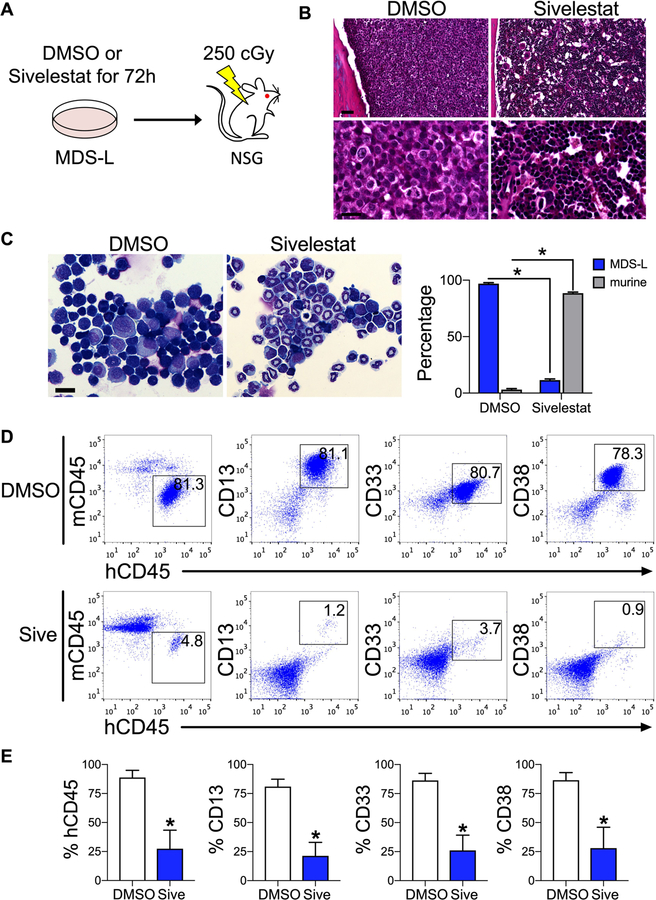
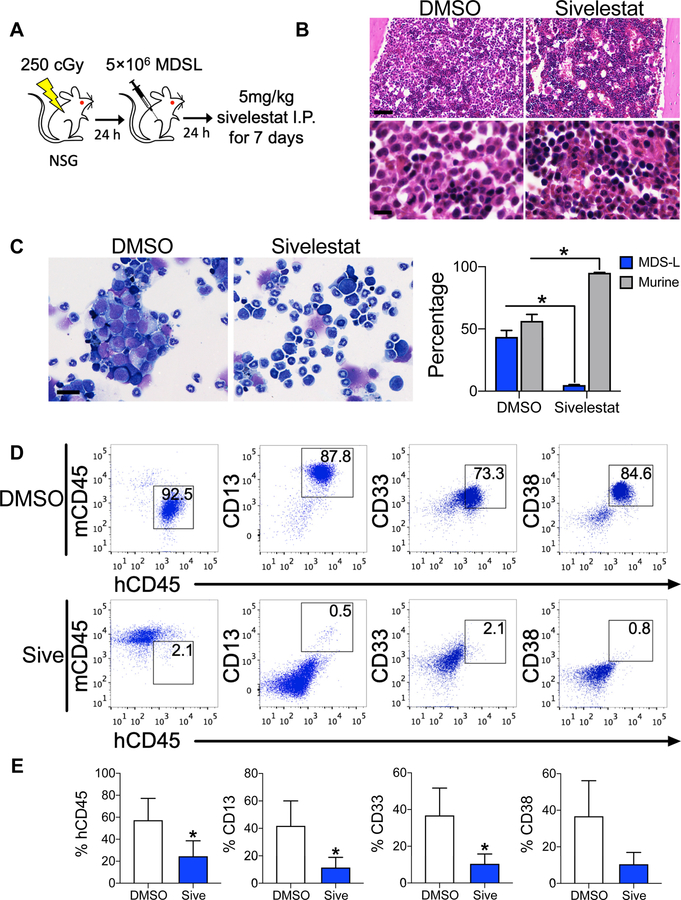
Experimental design: We quantified HMGB1 in an MDS cell line MDS-L and in primary MDS cells compared with nonmalignant hematopoietic cells. We performed loss-of-function studies of HMGB1 using pooled siRNAs and a small-molecule inhibitor sivelestat compared with standard chemotherapy. We measured levels of engraftment of MDS-L cells in NOD-scidIL2Rgnull (NSG) mice following treatment with sivelestat. Mechanistically, we interrogated cell survival pathways and 45 targets within the NFκB pathway using both protein analysis and a proteome profiler array.

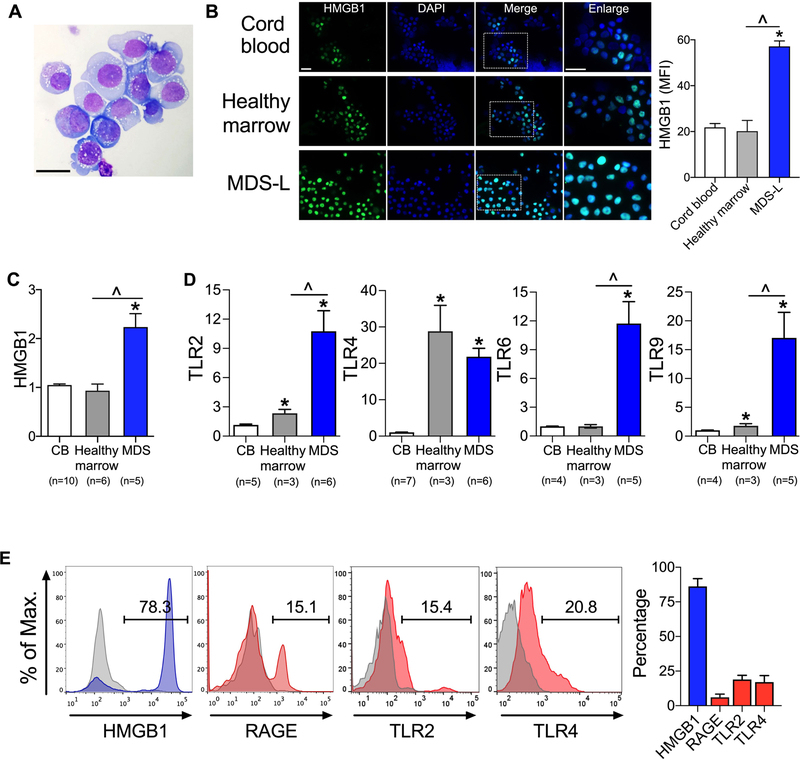
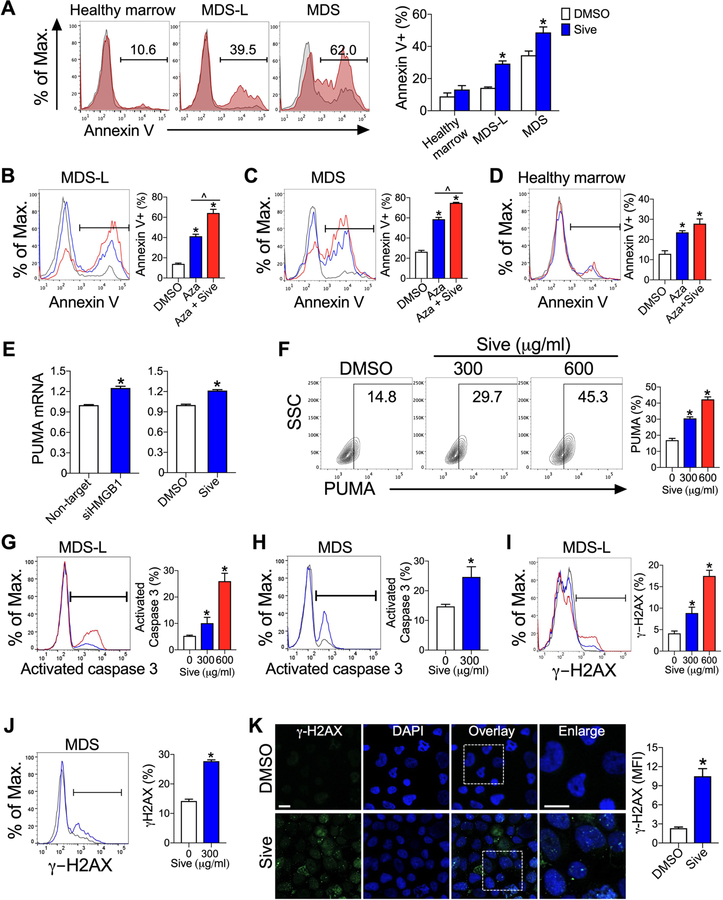
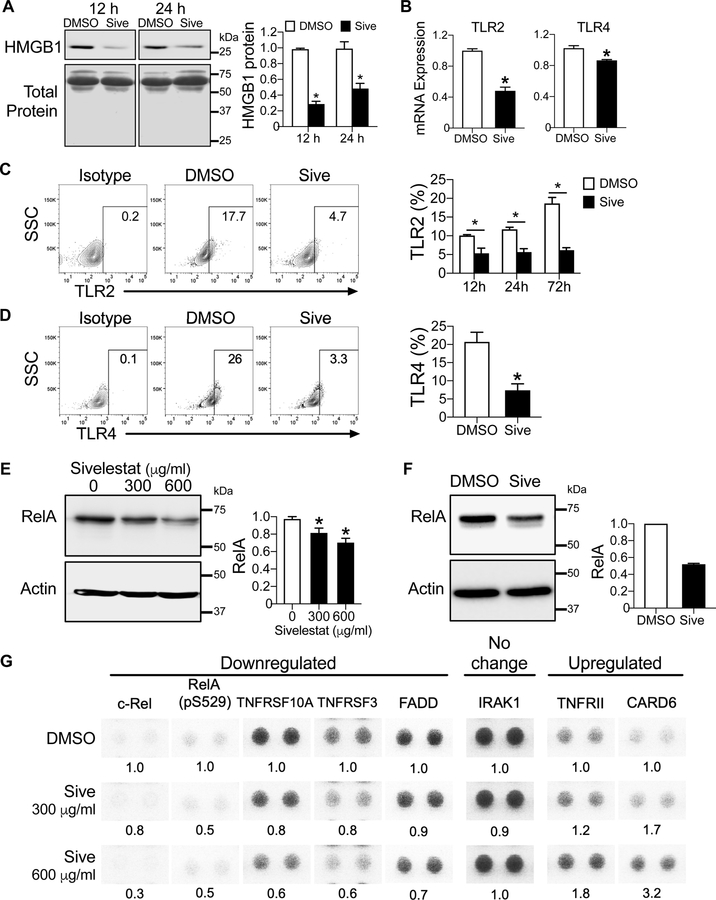
Results: We discovered that HMGB1 had increased expression in both MDS-L cells and in primary CD34+ MDS cells compared with healthy CD34+ hematopoietic cells. Sivelestat impaired MDS cell expansion, increased cellular death, and spared healthy hematopoietic cells. MDS-L marrow engraftment is reduced significantly at 17 weeks following treatment with sivelestat compared with control mice. Treatment of CD34+ MDS cells with sivelestat and azacitidine or decitabine was additive to increase apoptotic cell death compared with chemotherapy alone. Sivelestat promoted apoptosis with increased expression of PUMA, activated caspase 3, and increased DNA double-strand breaks. Inhibition of HMGB1 reduced levels of Toll-like receptors (TLR) and suppressed activation of NFκB in MDS-L cells.

Conclusions: Inhibition of HMGB1 could promote MDS cell death and alter innate immune responses via suppression of NFκB pathways.


Conflict of interest statement

The authors declare no potential conflicts of interest.

Figures

Figure 1.
Figure 1.. HMGB1 is overexpressed in MDS.
(A) Wright stain of MDS-L cells. Scale bar 50 µm. (B) Staining of HMGB1 (green), 4’,6-diamidino-2-phenylindole (DAPI, blue) and merged images in CD34+ cord blood, CD34+ healthy marrow, and MDS-L cells. Boxed areas correspond to enlarged images. Scale bars 20 µm. Right, quantification of mean fluorescence intensity (MFI) of HMGB1. n= 10–11/group. *P <0.0001 for MDS compared to cord blood; ^P <0.0001 for MDS compared to healthy marrow. (C) HMGB1 mRNA expression from CD34+ CB, CD34+ healthy marrow, and primary MDS without treatment indicated in Table S1 (i.e. DP0246, 0405, 0448, 0449, 0460). Number of biologic samples (n) is as noted with 3 technical replicates/sample. *P <0.0001 for MDS compared to cord blood; ^P <0.0001 for MDS compared to healthy marrow. (D) mRNA expression of TLRs in CD34+ CB, CD34+ healthy marrow and primary MDS without treatment. Number of biologic samples (n) is as noted with 3 technical replicates/sample. *P ≤0.02 for cord blood compared to healthy marrow or MDS; ^P ≤0.02 for healthy marrow compared to MDS. (E) Flow cytometric analysis of HMGB1 and its receptors in CD34+ primary MDS. n= 13, 5, 3 and 3 biologic samples for HMGB1, RAGE, TLR2 and TLR4 respectively. Student’s 2-tailed, unpaired t tests were used in these analyses.
Figure 2.
Figure 2.. Inhibition of HMGB1 with sivelestat is additive to chemotherapy to abrogate MDS cell expansion.
(A) Western blot and quantification of HMGB1 protein expression in MDS-L cells at 72 h after 300 µg/ml sivelestat. * P< 0.02. n= 3/group. (B) Representative flow cytometry plots of HMGB1 in CD34+ MDS cells following 72 h culture either with 300 µg/ml sivelestat or DMSO. SSC, side scatter. Right, quantification of HMGB1. n= 4 biologic samples, *P= 0.02 for Sive compared to DMSO. (C) Total cells of CD34+ cord blood (CB), CD34+ healthy marrow, MDS-L, and primary CD34+ MDS marrow (i.e., 0042, 0405, 0448) after 72 h culture with 300 µg/ml sivelestat or DMSO. *P< 0.01. n= 3–9/group. (D) CFCs from 72 h cultures with 300 µg/ml sivelestat or DMSO. Number of cells from culture per dish: 1,000 cells for CB, healthy marrow, and MDS-L cells, 2,500 cells for primary MDS cells. *P< 0.01. n= 3–6/group. (E) MDS-L cells were cultured with 300 µg/ml sivelestat, 10 µM azacitidine (Aza), or 10 µM azacitidine + 300 µg/ml sivelestat (Aza + Sive) for 7 d. Total cells and CFCs at 7 days. n= 3–6/group. (F) Cell expansion in primary CD34+ MDS cells after culture with chemotherapy alone or chemotherapy + sivelestat. Left, primary CD34+ MDS cells were treated with 300 µg/ml sivelestat, 10 µM azacitidine (Aza), or 10 µM azacitidine + 300 µg/ml sivelestat (Aza + Sive) for 3 d. Right, primary CD34+ MDS cells were treated with 300 µg/ml sivelestat, 75 nM Decitabine, or 75 nM Decitabine and 300 µg/ml sivelestat (Dec + Sive). n= 3/group. (G) Total cells and CFCs of CD34+ healthy marrow cells at 72 h following incubation with 300 µg/ml sivelestat, 10 µM azacitidine (Aza), or 10 µM azacitidine + 300 µg/ml sivelestat (Aza + Sive). n= 3 biologic replicates with 9–12 technical replicates/group. For E-G, *P< 0.05, **P< 0.001, ***P< 0.0001 for sivelestat, chemotherapy, and chemotherapy + Sive compared to DMSO or for chemotherapy compared to chemotherapy + Sive. Student’s 2-tailed, unpaired t tests were used in these analyses.
Figure 3.
Figure 3.. Inhibition of HMGB1 impairs MDS engraftment in vitro.
(A) Schematic of study design. Cultured 106 MDS-L cells were treated for 72 h, followed by intrafemoral injection into irradiated NSG mice, which were exposed to 250 cGy 24 h before transplantation. Analyses were performed at 17 weeks post-transplantation. (B) Hematoxylin and eosin stains of femurs. Bone marrow from DMSO-treated animals is replaced with large cells with disperse chromatin (MDS-L cells). Marrow from sivelestat-treated animals is preserved murine cells compared to DMSO group. Scale bar 30 µM top, 6 µM bottom. (C) Wright stain of marrow aspirates. Scale bar 25 µM. Percentage MDS-L and murine cells from marrow. *P < 0.0001 for % MDS-L and % murine cells in each group. n= 3 biologic replicates/group, 8 cell counts/group. (D) Flow cytometric analysis of marrow for total MDS-L engraftment (human CD45, hCD45) compared to mouse CD45 (mCD45) and CD13, CD33, and CD38. (E) Marrow engraftment at 17 weeks. *P = 0.03, 0.02, and 0.02 for CD45, CD13, and CD33, respectively. n= 4–5 mice/group. Mann-Whitney 2-tailed tests were used in these analyses.
Figure 4.
Figure 4.. Inhibition of HMGB1 impairs MDS engraftment in vivo.
(A) Schematic diagram of study design. 24 h after 250 cGy TBI, NSG mice were transplanted with 5 × 10⁶ MDS-L cells via intrafemoral injection. Mice were treated by intraperitoneal (I.P.) injection with either 5 mg/kg sivelestat or DMSO daily for 7 days starting 24 h after transplantation. Analysis for human engraftment were performed at 17 weeks post-transplantation. (B) Hematoxylin and eosin stains of femurs. Approximately 50% of marrow from DMSO-treated animals is replaced with large cells with disperse chromatin (MDS-L cells). Scale bar 30 µM top, 6 µM bottom. (C) Left, Wright stain of marrow aspirates of DMSO- and sivelestat-treated mice. Scale bar 25 µM. Right, percentage MDS-L and murine cells from marrows. *P =0.008 for % MDS-L and % murine cells in each group. n= 5/group. (D) Flow cytometric analysis of BM for total MDS-L engraftment. (E) Percentages of human CD45, CD13, CD33, and CD38 cell engraftment at 17 weeks in the marrow. *P = 0.04 for CD45, CD13, and CD33, respectively. n= 5–7 mice/group. Mann-Whitney 2-tailed tests were used in these analyses.
Figure 5.
Figure 5.. Inhibition of HMGB1 promotes cellular apoptosis via upregulation of PUMA, activation of caspase 3, and induction of DNA breaks.
(A) Annexin V+ cells at 72 h after culture with 300 µg/ml sivelestat (red) or DMSO (gray). *P < 0.0001 for MDS-L; *P= 0.01 for primary MDS cells. n= 9–11/group. (B-D) Annexin V+ cells from cultures of (B) MDS-L cells, (C) primary MDS cells, or (D) healthy marrow cells with DMSO (gray), 10 µM azacitidine (Aza, blue), or 10 µM azacitidine and 300 µg/ml sivelestat (Aza + Sive, red) at day 7. *P < 0.0001 for Aza and Aza + Sive compared to DMSO, ^P ≤ 0.001 for Aza compared to Aza + Sive. n= 4/group for MDS-L and primary MDS cells. n= 8/group for healthy marrow. (E) PUMA mRNA expression in MDS-L cells following HMGB1-specific siRNA for 72 h or 300 µg/ml sivelestat for 8 h compared to control cultures. *P<0.0001 and n= 6/group for siRNA. *P= 0.0003 and n= 3/group for sivelestat. (F) Flow cytometric analysis of PUMA at 24 h in MDS-L cells treated with sivelestat or DMSO. *P < 0.001, *P= 0.0002 for 300 µg/ml and 600 µg/ml sivelestat compared to DMSO, respectively. n= 3/group. SSC, side scatter. Flow cytometric analysis of activated caspase 3 at 24 h in MDS-L cells (G) or primary CD34+ MDS (H) with DMSO (gray), 300 µg/ml (blue) or 600 µg/ml sivelestat (red). *P< 0.04, *P< 0.0001 for DMSO compared to 300 µg/ml and 600 µg/ml sivelestat, respectively. n= 6/group for MDS-L cells. P< 0.05 for DMSO compared to sivelestat. n= 3/group for primary CD34+ MDS. Flow cytometric analysis of γ-H2AX in MDS-L cells (I) and CD34+ MDS cells (J) treated with DMSO (gray), 300 µg/ml (blue) or 600 µg/ml sivelestat (red) for 24h. For MDS-L, n= 10/group. *P< 0.005 and < 0.0001 for DMSO compared to 300 µg/ml and 600 µg/ml sivelestat, respectively. For primary CD34+ MDS, n= 4/group. *P< 0.0001 for DMSO compared to sivelestat. (K) γ-H2AX (green) and DAPI (blue) staining of MDS-L cells in culture for 24 h. Scale bar 10 µm. *P= 0.001. n= 4/group.
Figure 6.
Figure 6.. Sivelestat modulates the innate immune response in MDS via the NFκB pathway.
(A) Left, HMGB1 protein expression by Western analysis of conditioned media from MDS-L cells in 12 h- or 24 h-culture with 300 µg/ml sivelestat or DMSO. Total protein as a loading control is visualized by Ponceau S staining. Right, quantification of HMGB1 protein in conditioned media for specified culture conditions. *P <0.0001 and = 0.01 for 12 h and 24 h, respectively. n= 3/group. (B) mRNA expression of TLR2 and TLR4 in MDS-L cells following culture with DMSO or 300 µg/ml sivelestat for 4 h. *P = 0.0007 and 0.005 TLR2 and TLR4, respectively. n= 3–4/group. (C) Left, Representative flow cytometry plots of isotype and TLR2 in CD34+ primary MDS at 72 h with DMSO or 300 µg/ml sivelestat. Right, Quantification of flow cytometric analysis at 12h, 24h and 72h from (C). *P = 0.01, 0.001, 0.0001 for 12h, 24h and 72h, respectively. n= 4–5/group. (D) Left, Representative flow cytometry plots of isotype and TLR4 in CD34+ primary MDS at 24 h. Right, Quantification of flow cytometric analysis at 24h from (D). *P = 0.007. n= 3–4/group. Student’s 2-tailed, unpaired t tests were used in these analyses. (E, F) Western blot of RelA following 24 h culture with sivelestat compared to DMSO in MDS-L (E) and in CD34+ MDS (F). Quantification of RelA level normalized to actin, a loading control for each sample. *P =0.03 and =0.0008 for 300 µg/ml and 600 µg/ml sivelestat vs. DMSO, respectively. n=6 from three independent studies for MDS-L. n= 1 biologic sample for CD34+ MDS; 2 technical replicates/group. (G) MDS-L cells were treated with DMSO or sivelestat (300 and 600 µg/ml) for 24 h. Cell lysates were applied to Proteome Profiler NFκB Array. Each target was assayed in duplicate. Shown are select protein targets that have been cropped from images shown in Fig. S6. Levels of proteins were analyzed compared to DMSO for each target. Abbreviations: CARD6, caspase recruitment domain 6; FADD, Fas-associated protein with death domain; IRAK1, Interleukin-1 receptor-associated kinase 1; TNFRSF3, Tumor Necrosis Factor Receptor SF3; TNFRSF10A, Tumor Necrosis Factor Receptor SF10A. Student’s 2-tailed, unpaired t tests were used in these analyses.

References

    1. Sekeres MA, and Cutler C. How we treat higher-risk myelodysplastic syndromes. Blood 2014;123:829–36. - PubMed
    1. Mukherjee S, Boccaccio D, Sekeres MA, and Copelan E. Allogeneic hematopoietic cell transplantation for myelodysplastic syndromes: Lingering uncertainties and emerging possibilities. Biol Blood Marrow Transplant 2015;21:412–20. - PubMed
    1. Ganan-Gomez I, Wei Y, Starczynowski DT, Colla S, Yang H, Cabrero-Calvo M, et al. Deregulation of innate immune and inflammatory signaling in myelodysplastic syndromes. Leukemia 2015;29:1458–69. - PMC - PubMed
    1. Wei Y, Dimicoli S, Bueso-Ramos C, Chen R, Yang H, Neuberg D, et al. Toll-like receptor alterations in myelodysplastic syndrome. Leukemia 2013;27:1832–40. - PMC - PubMed
    1. Maratheftis Cl AE, Moutsopoulos HM, et al. Toll-like receptor-4 is upregulated in hematopoietic progenitor cells and contributes to increased apoptosis in myelodysplastic syndromes. Clin Cancer Res 2007;13:1154–60. - PubMed

Publication types

MeSH terms