. 2019 Jun;9(6):738-755.
doi: 10.1158/2159-8290.CD-18-1220. Epub 2019 Apr 5.

Tissue-Specific Oncogenic Activity of KRASA146T

Affiliations

Tissue-Specific Oncogenic Activity of KRASA146T

Emily J Poulin et al. Cancer Discov. 2019 Jun.

Abstract

KRAS is the most frequently mutated oncogene. The incidence of specific KRAS alleles varies between cancers from different sites, but it is unclear whether allelic selection results from biological selection for specific mutant KRAS proteins. We used a cross-disciplinary approach to compare KRASG12D, a common mutant form, and KRASA146T, a mutant that occurs only in selected cancers. Biochemical and structural studies demonstrated that KRASA146T exhibits a marked extension of switch 1 away from the protein body and nucleotide binding site, which activates KRAS by promoting a high rate of intrinsic and guanine nucleotide exchange factor-induced nucleotide exchange. Using mice genetically engineered to express either allele, we found that KRASG12D and KRASA146T exhibit distinct tissue-specific effects on homeostasis that mirror mutational frequencies in human cancers. These tissue-specific phenotypes result from allele-specific signaling properties, demonstrating that context-dependent variations in signaling downstream of different KRAS mutants drive the KRAS mutational pattern seen in cancer. SIGNIFICANCE: Although epidemiologic and clinical studies have suggested allele-specific behaviors for KRAS, experimental evidence for allele-specific biological properties is limited. We combined structural biology, mass spectrometry, and mouse modeling to demonstrate that the selection for specific KRAS mutants in human cancers from different tissues is due to their distinct signaling properties.See related commentary by Hobbs and Der, p. 696.This article is highlighted in the In This Issue feature, p. 681.


Conflict of interest statement

Disclosure of Potential Conflicts of Interest: The authors have no conflicts to declare.

Figures

Figure 1.
Figure 1.
Biochemical characterization of mutant K-Ras. A, GDP dissociation curves. Each allele was evaluated +/− SOS1. B, Quantification of nucleotide exchange rates. The intrinsic exchange rate of K-Ras4BA146T is significantly higher than K-Ras4BWT and K-Ras4BG12D and it is further enhanced by SOS1. ** P < 0.01, unpaired t test; *** P < 0.01, unpaired t test. C, SOS1:K-Ras4B interaction as measured by microscale thermophoresis. K-Ras4BA146T shows enhanced affinity toward SOS1 relative to K-Ras4BWT. The SOS1 construct includes the REM and CDC25 domains. D, Measurement of intrinsic GTP hydrolysis. K-Ras4BA146T and K-Ras4BG12D show slightly decreased hydrolysis relative to K-RasWT. Inset shows the curve for the hydrolysis reaction. ** P < 0.01, unpaired t test; *** P < 0.01, unpaired t test. E, Measurement of p120GAP-induced GTP hydrolysis. GAP-induced hydrolysis is reduced for K-Ras4BG12D, but not by K-Ras4BA146T. Inset shows the curve for the hydrolysis reaction. * P < 0.05, unpaired t test; *** P < 0.01, unpaired t test. All assays were done in triplicate.
Figure 2.
Figure 2.
Structure of K-Ras4BA146T. A, Comparison of K-Ras4BWT, K-Ras4BA146T, and K-Ras4BG12D X-ray structures demonstrating extension of switch 1 (yellow) and increased flexibility of switch 2 (highlighted in green) in K-Ras4BA146T. B, 2Fo-Fc electron density contoured at 1.4σ for X-ray crystal structure of GDP:K-Ras4BA146T. GDP is colored by element and surrounding active site residues are labeled. The active site Mg from superimposed structure of GDP:K-Ras4BWT (4OBE) is also shown in magenta, demonstrating no density in this location for K-Ras4BA146T. C, Regions of K-Ras4BA146T (highlighted in red) demonstrating increased deuterium exchange relative to WT, as measured by HDX-MS. D, SOS:H-Ras (PDB 1bkd) structure demonstrates the SOS-RAS binding interface. Multiple regions of H-Ras would be covered by switch 1 in the closed form.
Figure 3.
Figure 3.
K-RasA146T exhibits tissue-specific effects on homeostasis. A, H&E images of the colonic epithelium from mice expressing different forms of mutant K-Ras. B, Quantification of epithelial crypt height as a function of colonic location in mice with indicated K-Ras genotypes. C, Box and whisker plot illustrating the quantification of average epithelial crypt height in the colons of Fabp1-Cre mice expressing the indicated K-Ras allele. N=6 for WT, N=5 for A146T, and N=7 for G12D. * P < 0.05, Mann-Whitney U test; ** P < 0.01, Mann-Whitney U test. D, Box and whisker plot illustrating the quantification of average number of PH3-positive cells per crypt in the colons of Fabp1-Cre mice with indicated K-Ras genotypes. N=6 for WT, N=7 for A146T, and N=6 for G12D. * P < 0.05, Mann-Whitney U test; ** P < 0.01, Mann-Whitney U test. E, White blood counts (WBC) from Mx1-Cre animals expressing different K-Ras alleles in hematopoietic cells. F, Hemoglobin (Hb) counts from Mx1-Cre animals expressing different K-Ras alleles in hematopoietic cells. Error bars show mean ± s.e.m., and lines show modeled fixed effects from a mixed linear effects model. N=14 for WT, N=6 for A146T, and N=28 for G12D. G, Myeloid colony formation by bone marrow plated in methylcellulose with varying concentrations of GM-CSF. Experiments were done in duplicate. H, Representative H&E images of pancreases from 8-week-old Pdx1-Cre mice expressing WT K-Ras, K-RasA146T, or K-RasG12D. Scale bar = 100 μm in all panels.
Figure 4.
Figure 4.
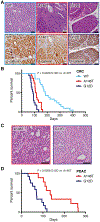
Allele effects in tumor models. A, Colonic tumors from Fabp1-Cre; Apc2lox14/+ animals expressing different K-Ras alleles. Top row: H&E, Bottom row: IHC for β-catenin. Later stage tumors expressing K-RasA146T or K-RasG12D are not distinguishable histologically. B, Survival curves for Fabp1-Cre; Apc2lox14/+ animals bearing colonic tumors. The penetrance of colonic tumors was 100% in all groups. C, Representative histology from pancreatic tumors expressing different mutant forms of K-Ras. D, Survival curves for Pdx1-Cre; Tp53LSL-R270H/+ animals bearing pancreatic tumors. All animals express Trp53R270H in the pancreas. Note that penetrance of PDAC was 100% in G12D, but only 75% in animals expressing A146T. Scale bar = 100 um in all panels. P values from survival curves calculated using Log-rank test.
Figure 5.
Figure 5.
Global proteomics and phospho-proteomics analysis. A, Schematic of sample preparation, processing, and data analysis workflow for mass spectrometry. B, GSEA results for KEGG pathway enrichment comparing A146T:WT (denoted by red line) and G12D:WT (denoted by blue line) using the colon total protein dataset. Each line in the heat map represents the normalized enrichment score (NES) for a single KEGG pathway. The expanded detail illustrates the rank metrics for proteins contributing to KEGG_NITROGEN_METABOLISM (commonly up-regulated) and KEGG_CALCIUM_SIGNALING_PATHWAY (divergently regulated) enrichment. Each line in the heat map represents the rank metric for an individual protein in the corresponding KEGG pathway. C, GSEA results for KEGG pathway enrichment comparing A146T:WT and G12D:WT using the pancreas total protein dataset. The expanded detail illustrates the rank metrics for proteins contributing to KEGG_BASAL_TRANSCRIPTION_FACTORS (commonly up-regulated), KEGG_NITROGEN_METABOLISM (commonly down-regulated), and KEGG_COMPLEMENT_AND_COAGULATION_CASCADES (divergently regulated). D, GSEA results for KEGG pathway enrichment comparing A146T:WT and G12D:WT using the spleen total protein dataset. The expanded detail illustrates the rank metrics for proteins contributing to KEGG_CELL_CYCLE (commonly up-regulated) and KEGG_COMPLEMENT_AND_COAGULATION_CASCADES (commonly down-regulated). E, Kinase activity inference results using the colon scaled phosphopeptide dataset for each K-Ras allele compared to WT. Each line in the heat map represents the normalized enrichment score (NES) for a single kinase. Erk2 and p90Rsk substrate enrichments are presented in the expanded detail. The asterisk (*) indicates Ser1120 of Sos1. F, Kinase activity inference results using the pancreas scaled phosphopeptide dataset for each K-Ras allele compared to WT. Cdk2, Pkaca, and Ck2a1 substrate enrichments are presented in the expanded detail. G, Kinase activity inference results using the spleen scaled phosphopeptide dataset for each K-Ras allele compared to WT. Camk2a and Erk2 substrate enrichments are presented in the expanded detail. For panels B-G, NES values are shown for significantly enriched pathways or kinases (nominal P-value < 0.1 or an FDR q-value < 0.25); insignificant pathways are shown with an NES value of 0. Those insignificant in both A146T:WT and G12D:WT are not shown. Expanded detail compares protein rank metrics that contribute to the pathway enrichment; non-contributing substrates shown with a rank metric of 0 unless they do not contribute to either allele in which case they are not shown.
Figure 6.
Figure 6.
MAPK thresholds determine cellular behaviors in colon and small intestine. A, Representative western blots illustrating increased levels of p-Erk1/2 in the colons of Fabp1-Cre mice with different K-Ras genotypes. Each lane contains colon tissue lysate from one individual mouse. B, Box and whisker plots illustrating quantification of western blot analysis for p-Erk1/2 For each signal, bands were normalized to the corresponding Gapdh intensity, and then normalized values of the phosphorylated form were divided by the normalized values of total Erk1/2. N=6 mice per genotype. * P < 0.05, Mann-Whitney U test; ** P < 0.01, Mann-Whitney U test. C, Box and whisker plots illustrating the quantification of average number of PH3-positive cells per crypt following trametinib (Meki) treatment of Fabp1-Cre mice expressing different K-Ras alleles (0.25 mg/kg, twice in 24 hours). N=5 for WT vehicle- and trametinib-treated, N=4 for A146T vehicle-treated, N=5 for A146T trametinib-treated, and N=5 for G12D vehicle- and trametinib-treated. * P < 0.05, Mann-Whitney U test; ** P < 0.01, Mann-Whitney U test. D, Representative western blot analysis of MAPK signaling components in the ilia of Fabp1-Cre mice with different K-Ras alleles. Each lane contains lysate from the distal ileum of an individual mouse. E, Box and whisker plots illustrating quantification of western blot analysis for p-Erk1/2. N=9 mice per genotype. * P < 0.05, Mann-Whitney U test; ** P < 0.01, Mann-Whitney U test. F, Representative immunofluorescence of the ilia from Fabp1-Cre mice with indicated K-Ras genotypes for E-cadherin (purple) and Lysozyme (green) following treatment with vehicle or trametinib (Meki, 1 mg/kg, twice daily for four days). Lysozyme is a marker for Paneth cells. G, Immunohistochemistry for p-Erk1/2 in pancreases from Pdx1-Cre mice expressing mutant forms of K-Ras. Insets contain high magnification images of pancreatic ducts. Scale bar = 50 μm in all panels.

Comment in

References

    1. Haigis KM. KRAS Alleles: The Devil Is in the Detail. Trends Cancer 2017;3:686–97. - PMC - PubMed
    1. Gibbs JB, Sigal IS, Poe M, Scolnick EM. Intrinsic GTPase activity distinguishes normal and oncogenic ras p21 molecules. Proc Natl Acad Sci USA 1984;81:5704–8. - PMC - PubMed
    1. Johnson L, Mercer K, Greenbaum D, Bronson RT, Crowley D, Tuveson DA, et al. Somatic activation of the K-ras oncogene causes early onset lung cancer in mice. Nature 2001;410:1111–6. - PubMed
    1. Jackson EL, Willis N, Mercer K, Bronson RT, Crowley D, Montoya R, et al. Analysis of lung tumor initiation and progression using conditional expression of oncogenic K-ras. Genes Dev 2001;15:3243–8. - PMC - PubMed
    1. Braun BS, Tuveson DA, Kong N, Le DT, Kogan SC, Rozmus J, et al. Somatic activation of oncogenic Kras in hematopoietic cells initiates a rapidly fatal myeloproliferative disorder. Proc Natl Acad Sci USA 2004;101:597–602. - PMC - PubMed

Publication types