. 2019 Jun;180(2):793-812.
doi: 10.1104/pp.19.00238. Epub 2019 Apr 5.

The Hydrogen Isotope Composition δ2H Reflects Plant Performance

Affiliations

The Hydrogen Isotope Composition δ2H Reflects Plant Performance

Rut Sanchez-Bragado et al. Plant Physiol. 2019 Jun.

Abstract

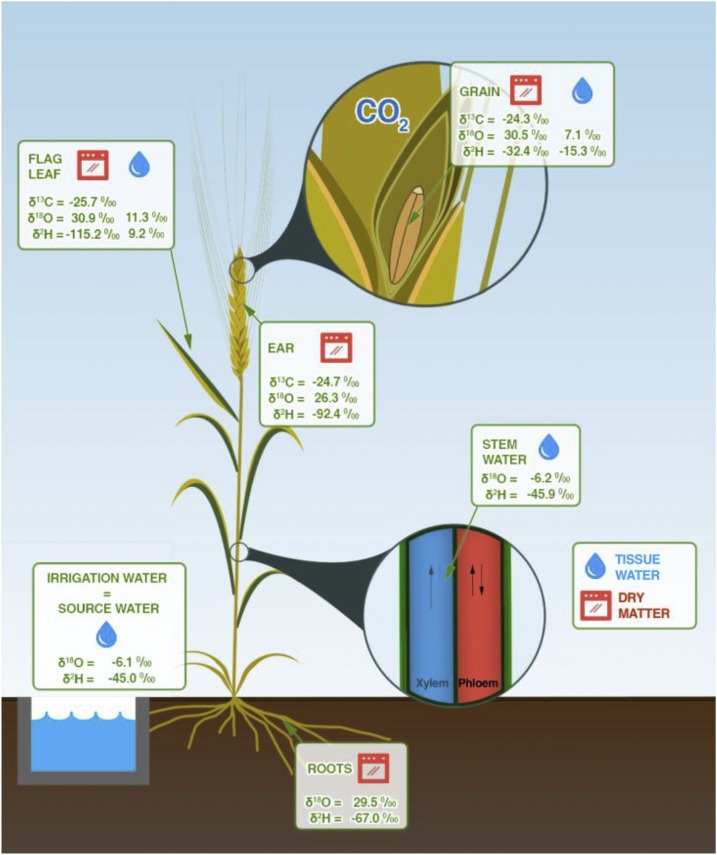
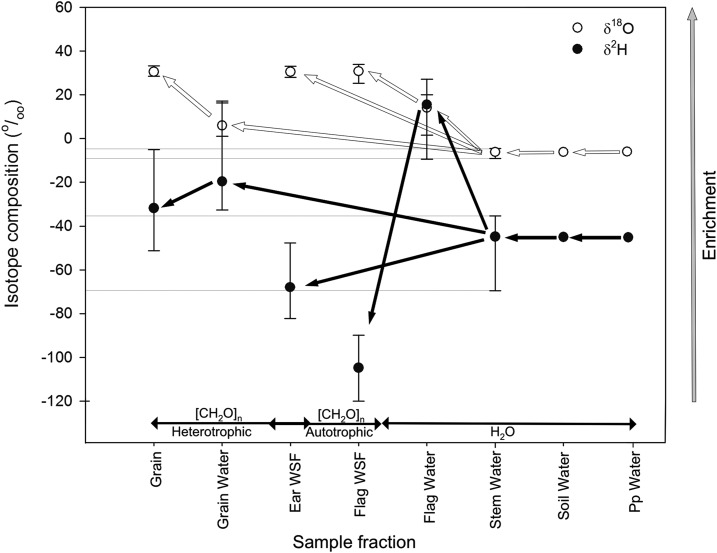
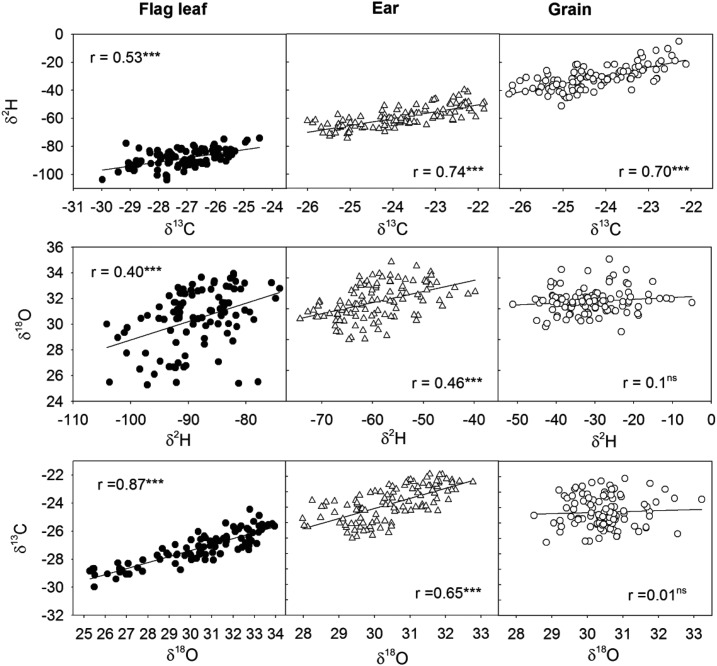
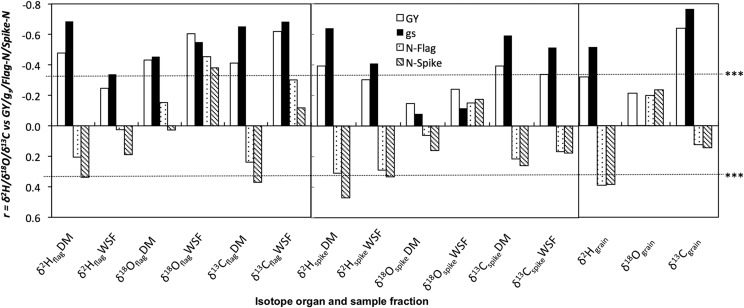
The stable carbon (δ13C) and oxygen (δ18O) isotope compositions in plant matter reflect photosynthetic and transpirative conditions in plants, respectively. However, the nature of hydrogen isotope composition (δ2H) and what it reflects of plant performance is poorly understood. Using durum wheat (Triticum turgidum var durum), this study evaluated the effect of different water and nitrogen growing field conditions on transpiration and how this effect influenced the performance of δ2H in autotrophic (flag leaf), mixotrophic (ears), and heterotrophic (grains and roots) organs. Moreover, δ2H was compared with the δ13C and δ18O in the same organs. Isotope compositions were analyzed in dry matter, the water-soluble fraction, and in water from different tissues of a set of genotypes. Similar to δ13C, the δ2H correlated negatively with stomatal conductance, whereas no correlation was observed for δ18O. Moreover, δ2H was not only affected by changes in transpiration but also by photosynthetic reactions, probably as a consequence of NADPH formation in autotrophic organs. Compared with the δ2H of stem water, plant δ2H was strongly diminished in photosynthetic organs such as the flag leaves, whereas it strongly increased in heterotrophic organs such as grains and roots. In heterotrophic organs, δ2H was associated with postphotosynthetic effects because there are several processes that lead to 2H-enrichment of carbohydrates. In summary, δ2H exhibited specific features that inform about the water conditions of the wheat crop, together with the photosynthetic characteristics of the plant part considered. Moreover, correlations of δ2H with grain yield illustrate that this isotope can be used to assess plant performance under different growing conditions.


Figures

Figure 1.
Figure 1.
Illustration of a wheat plant and the stable isotope composition (‰) of δ2H, δ18O, and δ13C of different plant parts (flag leaves, ears, and roots) sampled at mid-grain-filling, plus mature kernels (grains) and the water (blue drops) from the basal part of the stems, flag leaves, and developing grains. Values presented are means from the DM of five representative plants per plot and including all treatments. We measured δ13C DM in 108 plots (five cultivars and four landraces, four growing conditions, and three replicates); whereas we measured δ18O DM and δ2H DM in 48 plots (two cultivars and two landraces, four growing conditions, and three replicates) during the 2010 crop cycle. The δ18O and δ2H of the water extracted from the flag leaves were analyzed in a subset of two cultivars and two landraces (with three replicates) under fertilized conditions and two water regimes (18 plots; landraces in SI conditions were discarded due to lodging). We measured δ18O and δ2H in water from the stems, developing grains and DM in a subset of five cultivars and five landraces (with three replicates) under fertilized conditions and two water regimes (45 plots; landraces were discarded due to lodging under SI conditions; see “Materials and Methods” section). Analyses of water extracted from different tissues were performed in samples from the 2011 crop season.
Figure 2.
Figure 2.
Schematic representation of the major steps in the development of the ratios of oxygen (δ18O) and hydrogen (δ2H) isotope composition (‰) in plant carbohydrates and tissue water. Data was obtained from the WSF of the flag leaves and ears (flag WSF, ears WSF) and water extracted from different plant tissues (grain water, flag leaf water, and stem water) at mid-grain-filling, plus mature kernels (grains) in nine durum wheat genotypes and three replicates during the 2010 crop cycle. Each value represents the mean ± sd. Arrows represent the change in δ2H and δ18O from water sources (including irrigation water, soil water, precipitation water [Pp]) to carbohydrates in autotrophic or heterotrophic tissues. White circles and arrows represent δ18O, black circles and arrows represent δ2H.
Figure 3.
Figure 3.
Linear regression of the relationship among the carbon (δ13C), oxygen (δ18O), and hydrogen (δ2H) isotope compositions of the WSF within the flag leaves (left column, closed circles), ears (middle column, white triangles), and mature kernels (right column, white circles). Nine genotypes and three replicates per genotype were considered, accounting for a total of 108 plot values under all growing conditions of the 2010 crop season. Level of significance: ns, not significant, P > 0.05; ***, P < 0.001.
Figure 4.
Figure 4.
Linear regression of the relationship among the carbon (δ13C), oxygen (δ18O), and hydrogen (δ2H) isotope compositions in mature kernels (grains) and in the DM and WSF of the flag leaves and the ears with the grain yield (GY), the stomatal conductance (gs), and the total N concentration of the flag leaves (N-Flag) and ears (N-Ear). We measured the δ13C DM and δ13C WSF, δ18O WSF and δ2H WSF in 108 plots (five cultivars and four landraces, four growing conditions and three replicates per genotype and condition), whereas we measured δ18O DM and δ2H DM in 48 plots (two cultivars and two landraces, four growing conditions and three replicates) during the 2010 crop cycle. Analyses were performed in samples from the 2010 crop season. Level of significance: ***, P < 0.001.
Figure 5.
Figure 5.
Daily mean precipitation (mm), evapotranspiration (mm), and air temperature (°C) during the growing season from flowering to physiological maturity expressed as thermal time (°C·day) during the 2010 (top panel) and 2011 crop seasons (bottom panel). ETR = electron transport rate. Vertical dashed lines = dates of irrigation. Vertical dotted lines = sampling dates.

References

    1. Araus JL, Tapia L (1987) Photosynthetic gas exchange characteristics of wheat flag leaf blades and sheaths during grain filling: The case of a spring crop grown under Mediterranean climate conditions. Plant Physiol 85: 667–673 - PMC - PubMed
    1. Araus JL, Brown HR, Febrero A, Bort J, Serret MD (1993) Ear photosynthesis, carbon isotope discrimination and the contribution of respiratory CO2 to differences in grain mass in durum wheat. Plant Cell Environ 16: 383–392
    1. Araus JL, Amaro T, Casadesús J, Asbati A, Nachit MM (1998) Relationships between ash content, carbon isotope discrimination and yield in durum wheat. Aust J Plant Physiol 25: 835–842
    1. Araus JL, Slafer GA, Reynolds MP, Royo C (2002) Plant breeding and drought in C3 cereals: What should we breed for? Ann Bot 89: 925–940 - PMC - PubMed
    1. Araus JL, Villegas D, Aparicio N, García del Moral LF, El Hani S, Rharrabti Y, Ferrio JP, Royo C (2003) Environmental factors determining carbon isotope discrimination and yield in durum wheat under Mediterranean conditions. Crop Sci 43: 170–180

Publication types

LinkOut - more resources