

Haptoglobin genotype and aneurysmal subarachnoid hemorrhage: Individual patient data analysis
- PMID: 30952792
- PMCID: PMC6512887
- DOI: 10.1212/WNL.0000000000007397
Haptoglobin genotype and aneurysmal subarachnoid hemorrhage: Individual patient data analysis
Abstract
Objective: To perform an individual patient-level data (IPLD) analysis and to determine the relationship between haptoglobin (HP) genotype and outcomes after aneurysmal subarachnoid hemorrhage (aSAH).
Methods: The primary outcome was favorable outcome on the modified Rankin Scale or Glasgow Outcome Scale up to 12 months after ictus. The secondary outcomes were occurrence of delayed ischemic neurologic deficit, radiologic infarction, angiographic vasospasm, and transcranial Doppler evidence of vasospasm. World Federation of Neurological Surgeons (WFNS) scale, Fisher grade, age, and aneurysmal treatment modality were covariates for both primary and secondary outcomes. As preplanned, a 2-stage IPLD analysis was conducted, followed by these sensitivity analyses: (1) unadjusted; (2) exclusion of unpublished studies; (3) all permutations of HP genotypes; (4) sliding dichotomy; (5) ordinal regression; (6) 1-stage analysis; (7) exclusion of studies not in Hardy-Weinberg equilibrium (HWE); (8) inclusion of studies without the essential covariates; (9) inclusion of additional covariates; and (10) including only covariates significant in univariate analysis.
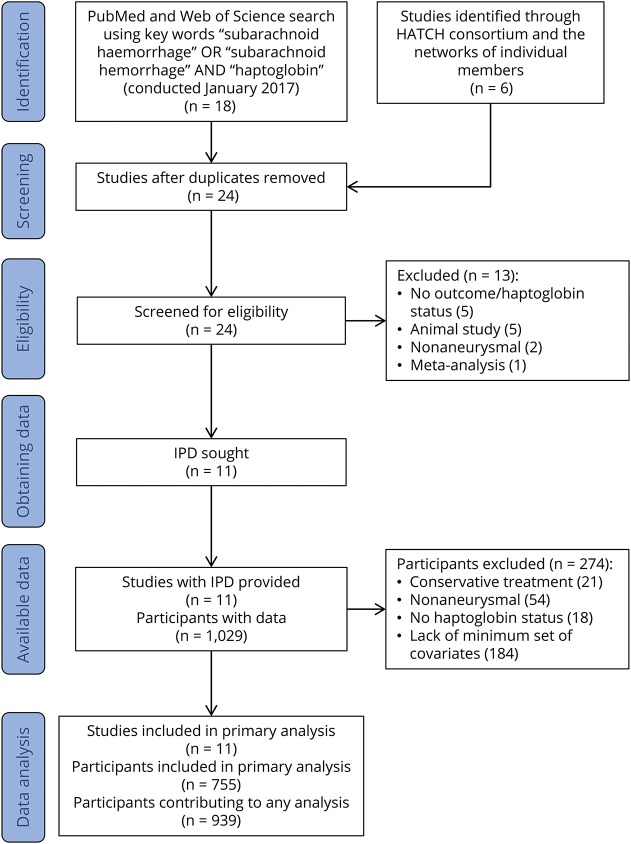
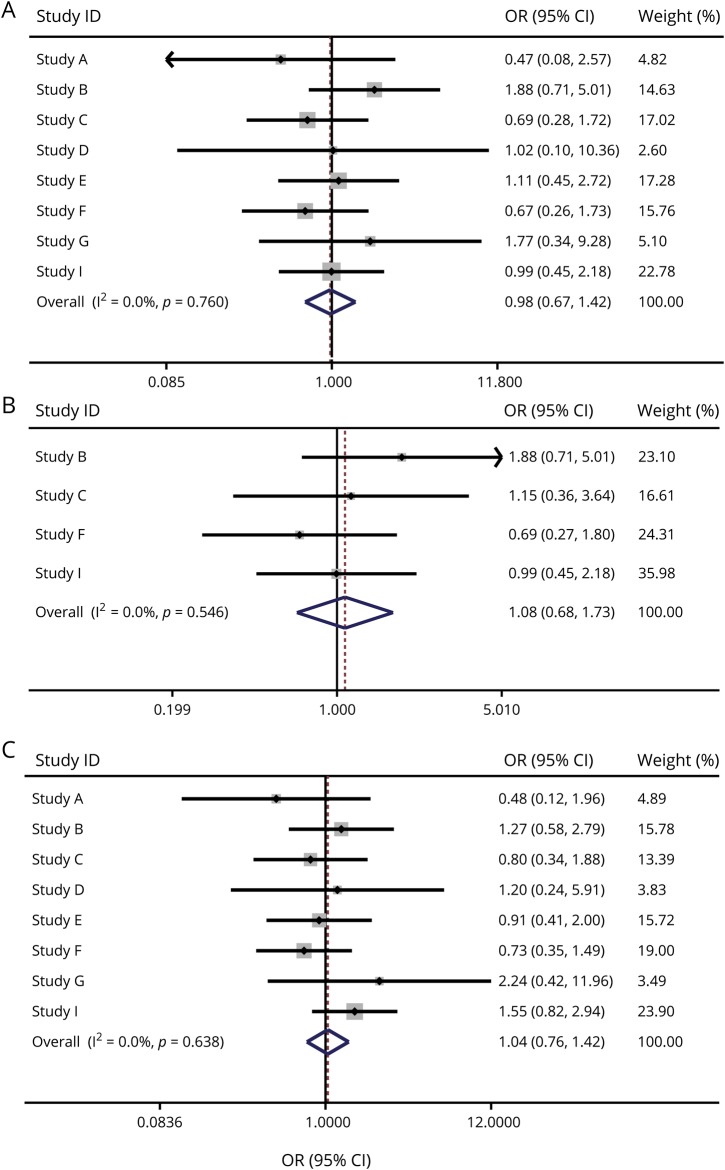
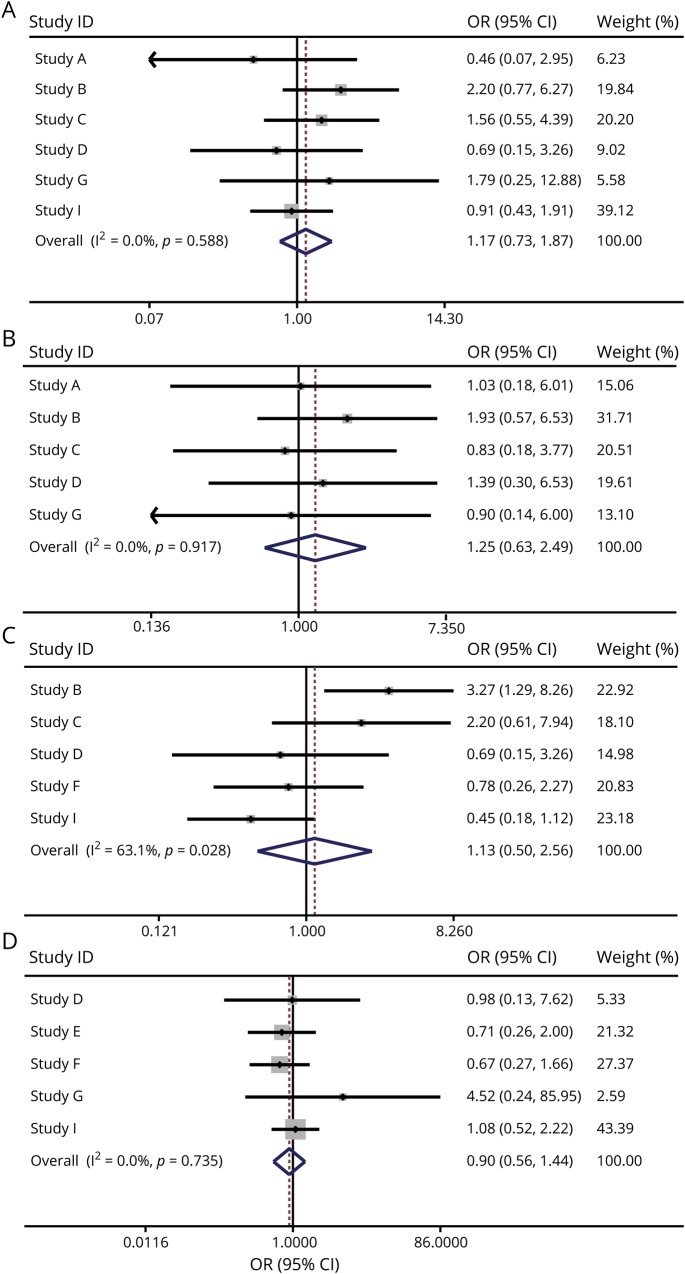
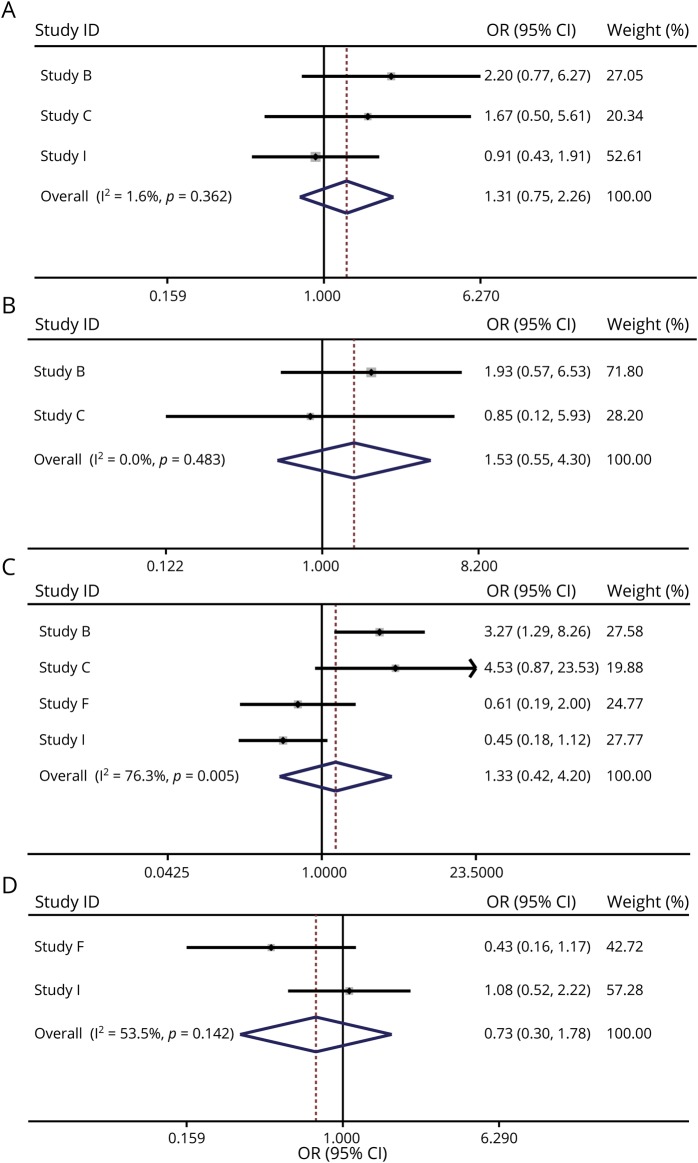
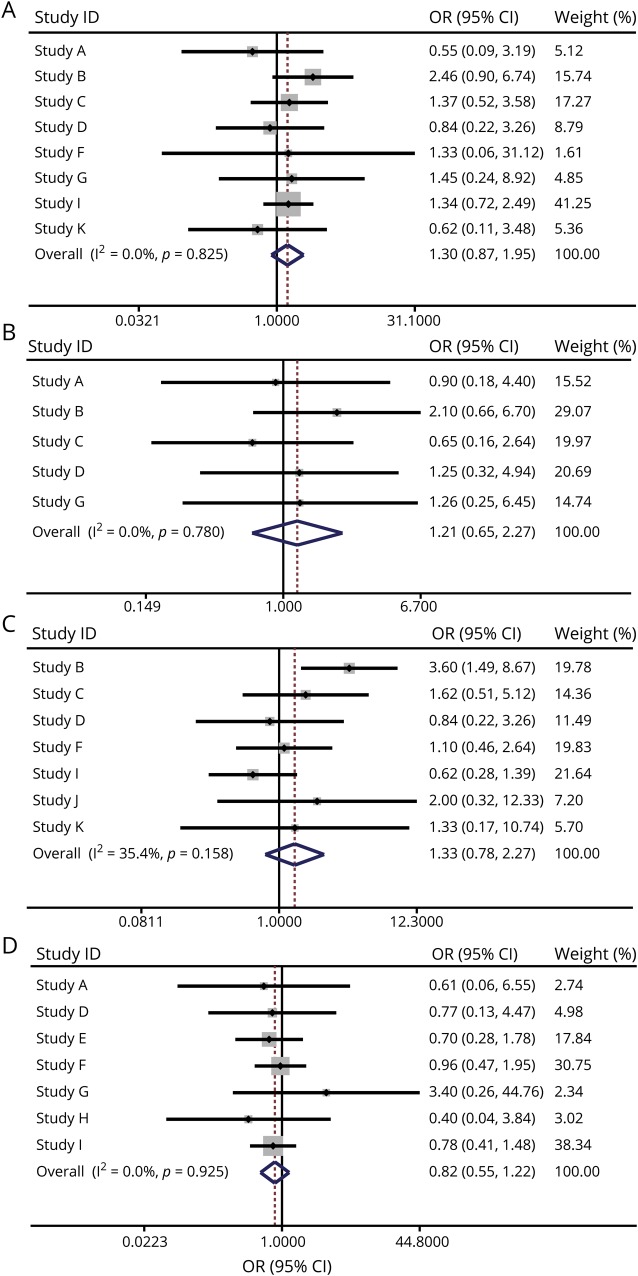
Results: Eleven studies (5 published, 6 unpublished) totaling 939 patients were included. Overall, the study population was in HWE. Follow-up times were 1, 3, and 6 months for 355, 516, and 438 patients. HP genotype was not associated with any primary or secondary outcome. No trends were observed. When taken through the same analysis, higher age and WFNS scale were associated with an unfavorable outcome as expected.
Conclusion: This comprehensive IPLD analysis, carefully controlling for covariates, refutes previous studies showing that HP1-1 associates with better outcome after aSAH.
© 2019 American Academy of Neurology.
Figures
Comment in
-
Haptoglobin and hemoglobin in subarachnoid hemorrhage: A tale of 2 globins.Neurology. 2019 Apr 30;92(18):831-832. doi: 10.1212/WNL.0000000000007399. Epub 2019 Apr 5. Neurology. 2019. PMID: 30952791 No abstract available.
References
-
- Rinkel GJ, Algra A. Long-term outcomes of patients with aneurysmal subarachnoid haemorrhage. Lancet Neurol 2011;10:349–56. - PubMed
-
- Jennett B, Bond M. Assessment of outcome after severe brain damage. Lancet 1975;1:480–484. - PubMed
-
- Jaja BNR, Saposnik G, Lingsma HF, et al. Development and validation of outcome prediction models for aneurysmal subarachnoid haemorrhage: the SAHIT multinational cohort study. BMJ 2018;360:j5745. - PubMed
-
- Borsody M, Burke A, Coplin W, Miller-Lotan R, Levy A. Haptoglobin and the development of cerebral artery vasospasm after subarachnoid hemorrhage. Neurology 2006;66:634–640. - PubMed
Publication types
MeSH terms
Substances
Grants and funding
LinkOut - more resources
Full Text Sources
Research Materials
Miscellaneous