. 2019 Apr 5;10(1):1582.
doi: 10.1038/s41467-019-09418-0.

FoxK1 and FoxK2 in insulin regulation of cellular and mitochondrial metabolism

Affiliations

FoxK1 and FoxK2 in insulin regulation of cellular and mitochondrial metabolism

Masaji Sakaguchi et al. Nat Commun. .

Abstract

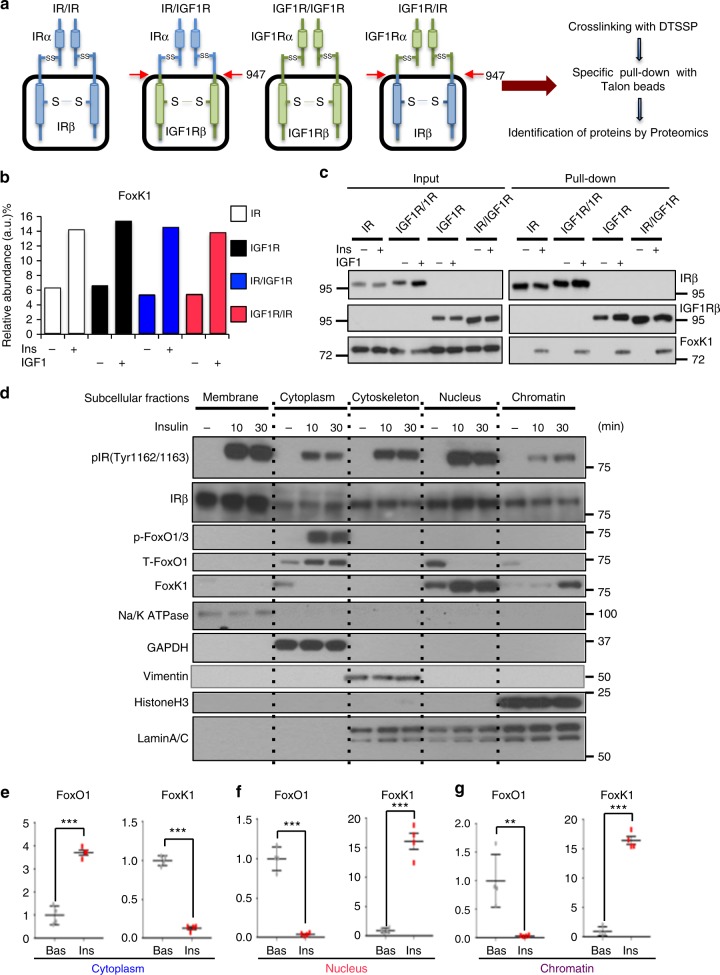
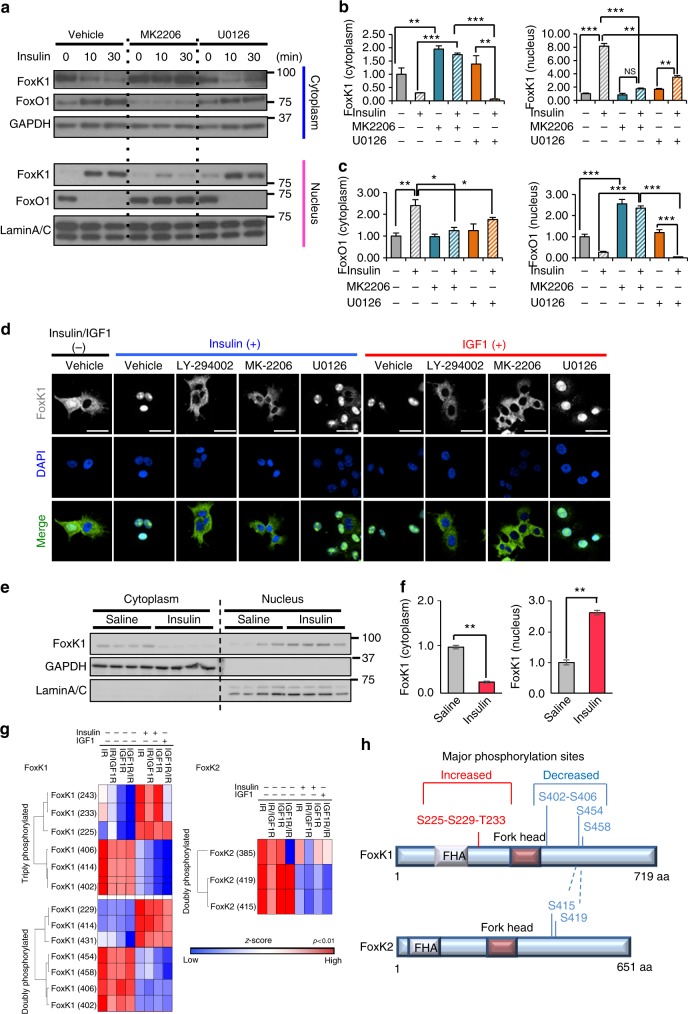
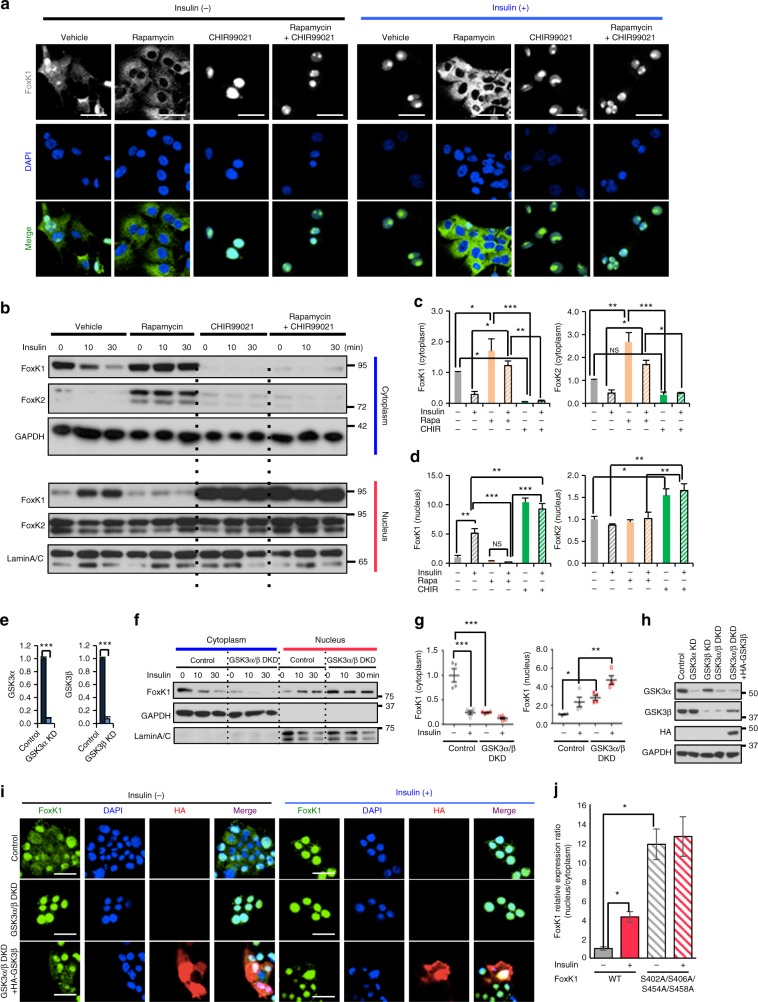
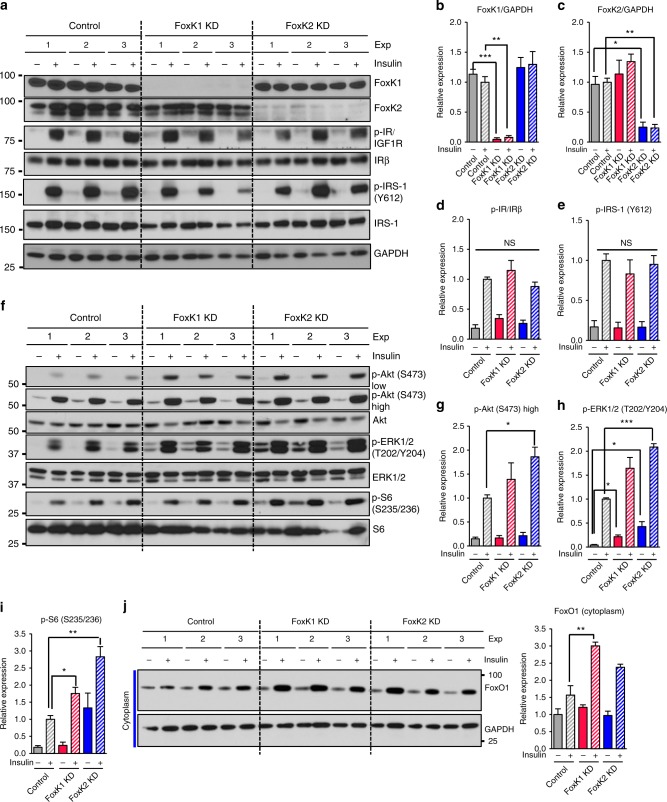
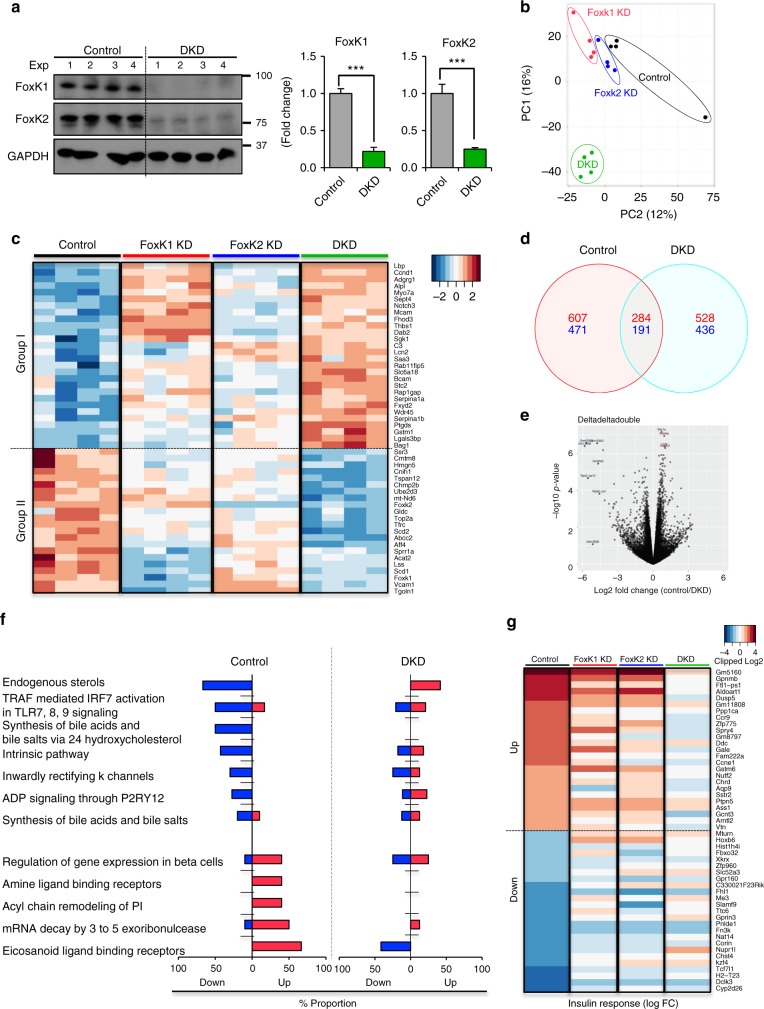
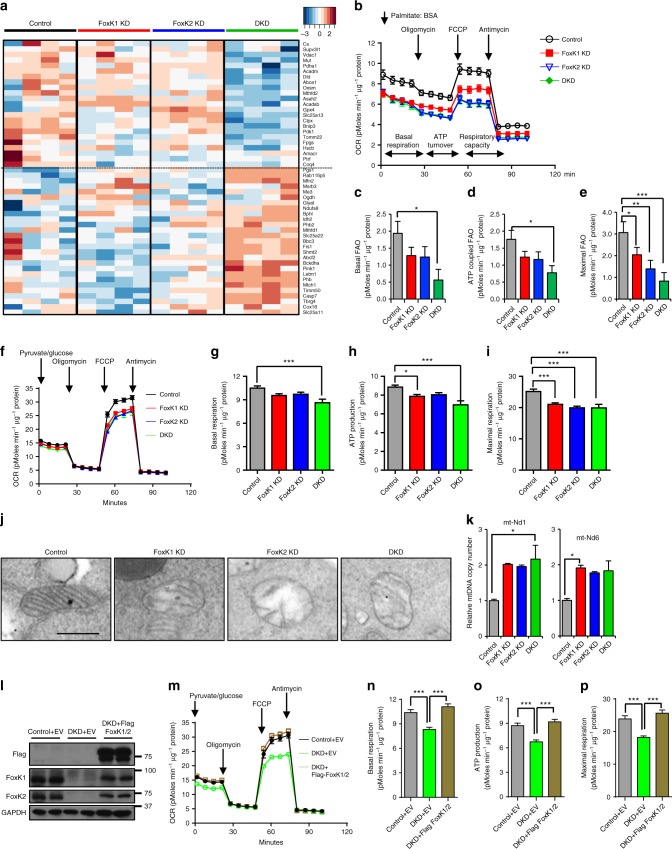
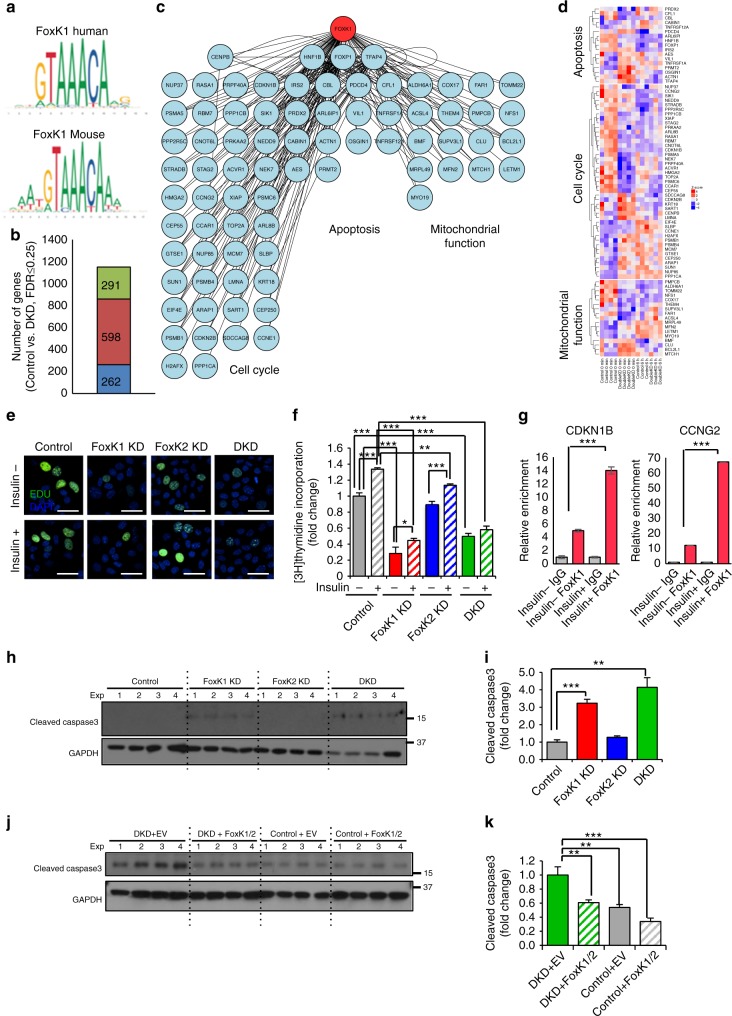
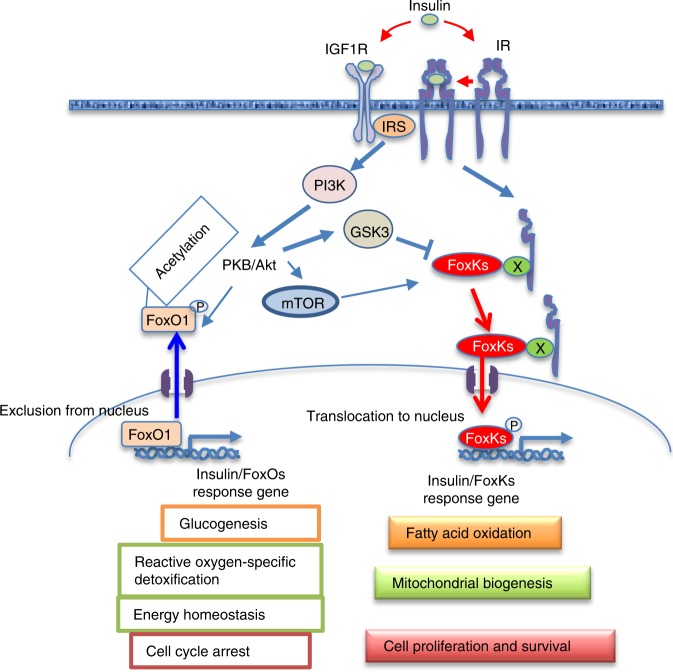
A major target of insulin signaling is the FoxO family of Forkhead transcription factors, which translocate from the nucleus to the cytoplasm following insulin-stimulated phosphorylation. Here we show that the Forkhead transcription factors FoxK1 and FoxK2 are also downstream targets of insulin action, but that following insulin stimulation, they translocate from the cytoplasm to nucleus, reciprocal to the translocation of FoxO1. FoxK1/FoxK2 translocation to the nucleus is dependent on the Akt-mTOR pathway, while its localization to the cytoplasm in the basal state is dependent on GSK3. Knockdown of FoxK1 and FoxK2 in liver cells results in upregulation of genes related to apoptosis and down-regulation of genes involved in cell cycle and lipid metabolism. This is associated with decreased cell proliferation and altered mitochondrial fatty acid metabolism. Thus, FoxK1/K2 are reciprocally regulated to FoxO1 following insulin stimulation and play a critical role in the control of apoptosis, metabolism and mitochondrial function.


Conflict of interest statement

The authors declare no competing interests.

Figures

Fig. 1
Fig. 1
Identification of FoxK1 as a component of IR-mediated and IGFR-mediated signaling complex. a Schematic showing proteomic analysis using IR/IGF1R double-knockout preadipocytes reconstituted with normal IR, IGF1R, chimeric IR/IGF1R or IGF1R/IR before and after treatment of insulin/IGF-1. b Proteomics results indicating the relative abundance of FoxK peptides associated with immunoprecipitated receptors with or without 100 nM insulin/IGF-1 stimulation for 15 min. c His-tagged receptor-containing protein complexes were pulled down with Talon beads following insulin/IGF-1 stimulation and subjected to SDS-PAGE western blotting. Normal or chimeric receptors were detected using antibodies to the IRβ or IGF1Rβ subunits. Bound FoxK1 was detected using anti-FoxK1 antibody. d Subcellular fractions of cytoplasm, membrane, cytoskeletal, nucleus and chromatin were prepared from DKO brown preadipocytes re-expressing the IR before (0 min) and after 100 nM insulin for 10 and 30 min. FoxO1 and FoxK1 in each fraction was assessed by immunoblotting, as were markers for different fractions: membrane (IRβ), cytosol (GAPDH), nuclear and cytoskeletal (Lamin A/C) and chromatin (histone H3). eg Quantitation of FoxO1 and FoxK1 in the cytoplasmic fractions (e), nuclear fractions (f) and chromatin fractions (g) 30 min after 100 nM insulin treatment as determined by scanning densitometry. (two-tailed Student t-test, *P < 0.05; **P < 0.01; ***P < 0.001, n = 4). All data are represented as mean ± SEM
Fig. 2
Fig. 2
Insulin and IGF-1 regulate nuclear translocation of FoxK1 in an Akt-dependent manner. a Immunoblotting of FoxO1 and FoxK1 in nuclear and cytoplasmic fractions extracted from IR-expressing brown preadipocytes before and after stimulation with 10 nM insulin at the indicated times in the presence or absence of the Akt inhibitor MK2206 (5 μM) or the MEK1/2 inhibitor U0126 (20 μM). GAPDH is a cytosolic marker, and Lamin A/C is a nuclear marker. b, c Densitometry of FoxK1 (b) and FoxO1 (c) in the cytoplasmic fractions and nuclear fractions 30 min after insulin stimulation as in Supplementary Fig. 3a. (One-way ANOVA followed by Tukey-Kramer post hoc analysis, *P < 0.05; **P < 0.01; ***P < 0.001, n = 3). All data are represented as mean ± SEM. d Representative images of AML 12 cells immunostained for FoxK1 and DAPI before and 30 min after 100 nM insulin treatment in the presence or absence of 50 μM PI3K inhibitor LY-294002 or 5 μM MK2206 (Akt inhibitor) or 20 μM U0126 (MEK inhibitor). DAPI was used to label the nucleus. Scale bars, 50 μm. e Immunoblotting of FoxK1 in nuclear and cytoplasmic fractions extracted from 2-month-old C57BL/6 J mice liver tissues 15 min after injection of saline or 5 U insulin via the inferior vena cava. GAPDH is a cytosolic marker, and Lamin A/C is a nuclear marker. f Densitometry of FoxK1and FoxO1 in the cytoplasmic fractions (left) and nuclear fractions (right) 15 min after insulin stimulation as in Fig. 2e (two-tailed Student t-test, *P < 0.05; **P < 0.01; ***P < 0.001, n = 4). All data are represented as mean ± SEM. g Heatmap of Log2 transformed, z-score phosphosite intensities for FoxK1 and FoxK2 in the presence or absence of insulin/IGF-1 in cells expressing normal or chimeric receptors. Significant increase or decrease of the phosphorylation clusters for FoxK1 and FoxK2 after insulin/IGF-1 stimulation are shown in panel h
Fig. 3
Fig. 3
FoxK1/K2 nuclear translocation is induced by GSK3α/β inactivation. a Immunostaining of FoxK1 before and 30 min after 100 nM insulin in the presence or absence of rapamycin (100 nM) or/and CHIR99201 (10 μM) in AML12 cells. Scale bars, 50 μm. b Nuclear and cytoplasmic fractions extracted from the AML12 cells before and after 100 nM insulin as indicated time points in the presence or absence of 100 nM rapamycin or/and 10 μM CHIR99201. FoxK1/K2 in each fraction was assessed by immunoblotting. c, d Quantification of FoxK1/K2 intensity in the indicated fractions (c, d) before and 30 min after insulin in the presence or absence of rapamycin or/andCHIR99201 as shown in Supplementary Fig. 4a. (One-way ANOVA followed by Tukey-Kramer post hoc analysis, *P < 0.05; **P < 0.01; ***P < 0.001, n = 3). e Quantification of immunoblot (Supplementary Fig. 4b, c) in AML12 cells transfected with Control siRNA or siRNAs for GSK3α or GSK3β cells. (two-tailed Student t-test, ***P < 0.001). (n = 4). Data are represented as mean ± SEM. f Nuclear and cytoplasmic fractionation and immunoblotting of FoxK1 extracted from the indicated cells before and after 100 nM insulin as 10 min and 30 min. g Quantitation of FoxK1 in theindicated fractions in Supplementary Fig. 4a (One-way ANOVA followed by Tukey-Kramer post hoc analysis, *P < 0.05; **P < 0.01; ***P < 0.001, n = 3). Data are represented as mean ± SEM. h Immunoblotting with indicated antibody in AML12 cells transfected with NS siRNA, GSK3α siRNA, GSK3β siRNA, GSK3α/β DKD, and re-expressed with HA-tagged GSK3β in GSK3α/β DKD cells. i Immunostaining of FoxK1 before and 30 min after 100 nM insulin in Control, GSK3α/β double knockdown cells and re-expressed with HA-GSK3β in GSK3α/β DKD cells. Scale bars, 50 μm. j Nuclear and cytoplasmic fractionation were extracted from cells overexpressing 3XFlag-FoxK1 wild type or the 3XFlag-FoxK1 S402A/S406A/S454A/S458A mutant before and after 100 nM insulin for 30 min. The relative FoxK1 nucleus/cytoplasm protein expression ratio was quantified in Supplementary Fig. 4h. (two-tailed Student t-test, *P< 0.05, n = 3)
Fig. 4
Fig. 4
Role of FoxKs in the regulation of insulin-mediated signal transduction. a Immunoblotting for phosphorylation of IR and IRS-1 in lysates from Control (NS siRNA) AML12 cells or cells depleted of either FoxK1 (FoxK1 KD) or FoxK2 (FoxK2 KD) cells by siRNAs stimulated with 100 nM insulin for 5 min. be Densitometric analysis of FoxK1, FoxK2, phosphorylated IR and IRS-1 following 5 min stimulation. Data are mean ± SEM (One-way ANOVA followed by t-test with Bonferroni correction, *P < 0.05; **P < 0.01; ***P < 0.001, n = 3). f Immunoblotting of the phosphorylation of Akt, ERK, and S6 in lysates from Control (NS siRNA) AML12 cells or cells depleted of either FoxK1 (FoxK1 KD) or FoxK2 (FoxK2 KD) cells by siRNAs and stimulated with 100 nM insulin for 5 min. gi Densitometric analysis of phosphorylated Akt, ERK, and S6 following 5 min insulin stimulation. Data are mean ± SEM (One-way ANOVA followed by t-test with Bonferroni correction, *P < 0.05; **P < 0.01; ***P < 0.001, n = 3). j Cytoplasmic fractionation and immunoblotting of FoxK1 and FoxK2 extracted from the AML12 cells before and after 100 nM insulin as indicated time points (0 min, 15 min)) in the Control, FoxK1 KD and FoxK2 KD cells (left) and quantitation by scanning densitometry (right). Data are mean ± SEM (One-way ANOVA followed by t-test with Bonferroni correction, *P < 0.05; **P < 0.01; ***P < 0.001, n = 3)
Fig. 5
Fig. 5
Role of FoxKs in the regulation of gene expression. a Immunoblotting of FoxK1 and FoxK2 from lysates of Control (NS siRNA) and FoxK1/K2 double knockdown (DKD) cells using siRNAs (two-tailed Student t-test, *P < 0.05; **P < 0.01; ***P < 0.001) (n = 4). All data are represented as mean ± SEM. b PCA plots of the transcriptome profiles of Control (Black), FoxK1 KD (Red), FoxK2 KD (Blue), and DKD (Green) cells. c Heatmap of top 50 most significantly changed genes among all groups. d Venn diagram showing the numbers of significantly regulated genes by insulin in Control and DKD cells (FDR < 0.25). e Volcano plot showing the distribution of differentially regulated genes by insulin stimulation with log-fold change in Control versus DKD fold change on X-axis and −log10 P value on Y-axis. f Top directionally regulated reactome pathways by insulin in Control but not DKD cells. g Heatmap of top 50 (up and down: each top 25 for each) differentially regulated by insulin in Control and DKD cells
Fig. 6
Fig. 6
Role of FoxKs in the regulation of FAO and mitochondrial biogenesis. a Heatmap of mitochondrial-related gene expression in all groups. b Measurement of FAO) using Seahorse Bioanalyzer. ce Quantitation of basal (c), ATP-coupled (d) and maximal (e) OCRs of FAO. Error bars represent SEM. (One-way ANOVA followed by post hoc analysis, *P < 0.05; **P < 0.01; ***P < 0.001, Control, n = 7, FoxK1 KD, n = 8, FoxK2 KD, n = 9 and DKD, n = 8). f Mitochondrial oxidative phosphorylation activity in Control, Foxk1 KD, Foxk2 KD, and DKD cells. Quantitation of g basal respiration, (h) ATP production, and (i) maximal respiration capacity as measured by OCR. Error bars represent SEM. (One-way ANOVA followed by Dunnett’s post hoc analysis, *P < 0.05; **P < 0.01; ***P < 0.001, Control, n = 14, FoxK1 KD, n = 14, FoxK2 KD, n = 13 and DKD, n = 13). j Representative electron microscopic images of mitochondria in Control, FoxK1 KD, FoxK2 KD and DKD AML 12 cells. Scale bar, 0.5 μm. k Mitochondrial DNA copy number was assessed by qPCR of mt-ND1/mt-ND6 and normalized to genomic DNA encoding GAPDH in extracted total DNA. (One-way ANOVA followed by post hoc analysis, *P < 0.05; **P < 0.01; ***P < 0.001, n = 4). l Immunoblotting with anti-FoxK1, FoxK2, and Flag antibody in lysates from Control (NS siRNA), DKD and DKD cells re-expressing Flag-tagged FoxK1/K2. m Mitochondrial oxidative phosphorylation activity in Control, DKD cells and DKD cells re-expressing Flag-FoxK1/K2 measured by Seahorse Bioanalyzer. 25 mM glucose and pyruvate mix was used as substrate. Quantification of basal respiration (n), ATP production (o) and maximal respiratory capacity (p) as measured by OCR. Error bars represent SEM. (One-way ANOVA followed by Dunnett’s post hoc analysis, *P < 0.05; **P < 0.01; ***P < 0.001, Control + EV, n = 13, DKD + EV, n = 13 and DKD + Flag-FoxK1/K2, n = 12)
Fig. 7
Fig. 7
Increased apoptosis and reduced proliferation in FoxK1/K2 KD cells. a The promoter consensus sequences for FoxK1 in mice or humans based on Bowman, C. J. et al.. b The bar graph shows the number of genes (262) carrying the consensus FoxK1/K2 motifs in the promoter regions among 1,151 genes that were differentially regulated in the DKD cells after insulin stimulation compared with those of the Control. c, d The network profile and the heatmap showed three groups of genes with the FoxK1/K2 motifs in the promoter regions as involved in the cell cycle, apoptosis and mitochondria-related genes that were highly affected after insulin stimulation in the Control and DKD cells. e Representative images of EdU (green) incorporation in Control. Foxk1 KD, Foxk2 KD and DKD AML12 cells incubated with 100 µM insulin or vehicle for 24 h. EdU is stained green, and nuclei are stained blue (DAPI). Scale bars, 50 μm. f [3H]-thymidine incorporation in Control, FoxK1 KD, FoxK2 KD and DKD AML12 cells with or without insulin stimulation for 24 h. (One-way ANOVA followed by Tukey-Kramer post hoc analysis, *P < 0.05; **P < 0.01; ***P < 0.001, n = 4). g qChip of FoxK1 at the promoter regions of indicated genes in AML12 cells before and 30 min after 100 nM insulin treatment. (One-way ANOVA followed by Dunnett’s post hoc analysis, *P < 0.05; **P < 0.01; ***P < 0.001, n = 4). h Immunoblotting for cleaved caspase3 in lysates from cells after 24 h serum starvation. i Densitometric analysis of cleaved caspase3 in all groups. (One-way ANOVA followed by t-test with Bonferroni correction, *p < 0.05; **,p < 0.01; ***p < 0.001, n = 4). j Immunoblotting for cleaved caspase3 in lysates from Control (NS siRNA), DKD, Control + Flag-FoxK1/K2 and DKD + Flag-tagged FoxK1/K2 after serum starvation 24 h. k Densitometric analysis of cleaved caspase3 in the groups shown in panel i. (One-way ANOVA followed by t-test with Bonferroni correction, *P < 0.05; **P < 0.01; ***P < 0.001, n = 4). All data are represented as mean ± SEM
Fig. 8
Fig. 8
Schematic model of insulin regulation of FoxK1/K2 and FoxOs in cellular function. The FoxK Forkhead transcription factors translocate from the cytoplasm to nucleus reciprocally to the translocation of FoxO1. FoxK translocation to the nucleus is dependent on the Akt-mTOR pathway, while its localization to the cytoplasm in the basal state is dependent on GSK3. Once in the nucleus, FoxKs play important roles in regulation of genes, fatty acid oxidation, mitochondrial biogenesis, cell proliferation and survival. Where other unknown proteins (named here X) are in the FoxK and IR/IGF1R protein-protein complexes remains to be determined

References

    1. Tseng YH, Ueki K, Kriauciunas KM, Kahn CR. Differential roles of insulin receptor substrates in the anti-apoptotic function of insulin-like growth factor-1 and insulin. J. Biol. Chem. 2002;277:31601–31611. doi: 10.1074/jbc.M202932200. - DOI - PubMed
    1. Boucher J, Tseng YH, Kahn CR. Insulin and insulin-like growth factor-1 receptors act as ligand-specific amplitude modulators of a common pathway regulating gene transcription. J. Biol. Chem. 2010;285:17235–17245. doi: 10.1074/jbc.M110.118620. - DOI - PMC - PubMed
    1. O’Neill BT, et al. Differential role of insulin/IGF-1 receptor signaling in muscle growth and glucose homeostasis. Cell Rep. 2015;11:1220–1235. doi: 10.1016/j.celrep.2015.04.037. - DOI - PMC - PubMed
    1. Boucher J, et al. Differential roles of insulin and IGF-1 receptors in adipose tissue development and function. Diabetes. 2016;65:2201–2213. doi: 10.2337/db16-0212. - DOI - PMC - PubMed
    1. Sakaguchi M, et al. Adipocyte dynamics and reversible metabolic syndrome in mice with an inducible adipocyte-specific deletion of the insulin receptor. Cell Metab. 2017;25:448–462. doi: 10.1016/j.cmet.2016.12.008. - DOI - PMC - PubMed

Publication types