. 2019 Apr 5;10(1):1579.
doi: 10.1038/s41467-019-09407-3.

Phenotypes associated with genes encoding drug targets are predictive of clinical trial side effects

Affiliations

Phenotypes associated with genes encoding drug targets are predictive of clinical trial side effects

Phuong A Nguyen et al. Nat Commun. .

Erratum in

Abstract

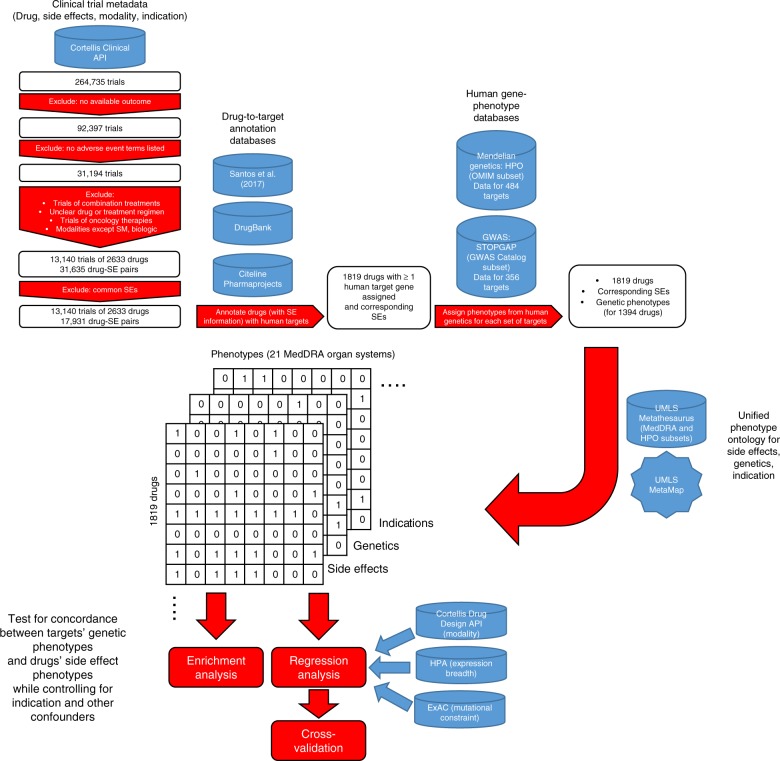
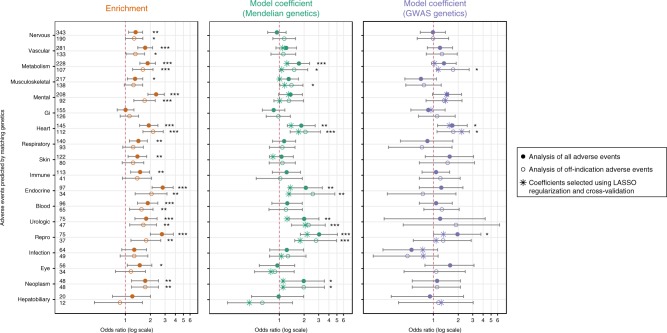
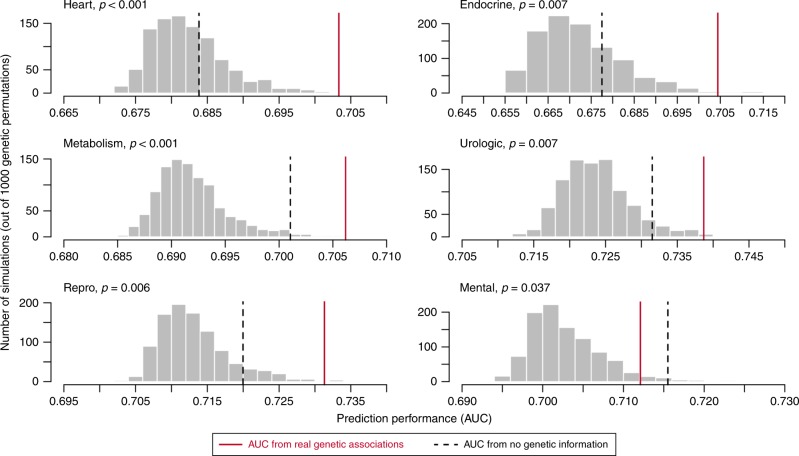
Only a small fraction of early drug programs progress to the market, due to safety and efficacy failures, despite extensive efforts to predict safety. Characterizing the effect of natural variation in the genes encoding drug targets should present a powerful approach to predict side effects arising from drugging particular proteins. In this retrospective analysis, we report a correlation between the organ systems affected by genetic variation in drug targets and the organ systems in which side effects are observed. Across 1819 drugs and 21 phenotype categories analyzed, drug side effects are more likely to occur in organ systems where there is genetic evidence of a link between the drug target and a phenotype involving that organ system, compared to when there is no such genetic evidence (30.0 vs 19.2%; OR = 1.80). This result suggests that human genetic data should be used to predict safety issues associated with drug targets.


Conflict of interest statement

The authors declare the following competing interest: all authors are current or former employees of Amgen, Inc.

Figures

Fig. 1
Fig. 1
Data sources and analysis workflow
Fig. 2
Fig. 2
Rate of side effect (SE) manifestation across drug-SE combinations classified by genetic support. OR, odds ratio; P, P-value from Fisher’s exact test (two-tailed). The left panel shows analyses based on all 38,199 drug-SE combinations; the right panel shows analyses based on 33,489 “off-indication” drug-SE combinations. Error bars represent the 95% confidence interval of the reported proportions. Source data and confidence intervals for the OR values are shown in Supplementary Table 1. Similar analyses for Mendelian and GWAS genetics separately are shown in Supplementary Figure 4
Fig. 3
Fig. 3
Summary of side effect modeling results. Left: results of raw enrichment analysis (source data from Supplementary Table 2). Center: coefficients of the Mendelian genetics predictors in each of the 18 side effect models (source data from Supplementary Table 3). Right: coefficients of the GWAS genetics predictors in each of the 18 side effect models (source data from Supplementary Table 3). Coefficients from the regression models were exponentiated to obtain odds ratios. Along each row, circular points indicate odds ratios from the glm models; error bars are 95% confidence intervals from the glm models; large eight-pointed stars indicate odds ratios when the genetics predictors are selected as predictors in the glmnet models (which are built using feature selection, lasso regularization, and cross-validation). Small asterisks offset from the data indicate P-values of the the Fisher’s exact test (left) and P-values of the coefficients from the glm models (center and right) (*P < 0.05; **P < 0.01; ***P < 0.001)
Fig. 4
Fig. 4
Results of cross validation analysis of contribution of genetics to predictive modeling. Gray bars show distribution of leave-one-target-set-out cross-validation AUC values from 1000 permutations of the genetic data; dashed line shows the cross-validation AUC value for a model omitting genetic information entirely; red line shows the cross-validation AUC of the regression model with real genetic data. The P-values are derived from the frequency of permutation runs that exceed the AUC of the true model. Source data are provided in Supplementary Table 4

References

    1. Kola I, Landis J. Can the pharmaceutical industry reduce attrition rates? Nat. Rev. Drug. Discov. 2004;3:711–715. doi: 10.1038/nrd1470. - DOI - PubMed
    1. Waring MJ, et al. An analysis of the attrition of drug candidates from four major pharmaceutical companies. Nat. Rev. Drug. Discov. 2015;14:475–486. doi: 10.1038/nrd4609. - DOI - PubMed
    1. Cook D, et al. Lessons learned from the fate of AstraZeneca’s drug pipeline: a five-dimensional framework. Nat. Rev. Drug. Discov. 2014;13:419–431. doi: 10.1038/nrd4309. - DOI - PubMed
    1. Plenge RM. Disciplined approach to drug discovery and early development. Sci. Transl. Med. 2016;8:349ps315. doi: 10.1126/scitranslmed.aaf2608. - DOI - PubMed
    1. Knowles J, Gromo G. A guide to drug discovery: target selection in drug discovery. Nat. Rev. Drug. Discov. 2003;2:63–69. doi: 10.1038/nrd986. - DOI - PubMed