. 2019 Apr 5;10(1):1562.
doi: 10.1038/s41467-019-09605-z.

N-terminal syndecan-2 domain selectively enhances 6-O heparan sulfate chains sulfation and promotes VEGFA165-dependent neovascularization

Affiliations

N-terminal syndecan-2 domain selectively enhances 6-O heparan sulfate chains sulfation and promotes VEGFA165-dependent neovascularization

Federico Corti et al. Nat Commun. .

Erratum in

Abstract

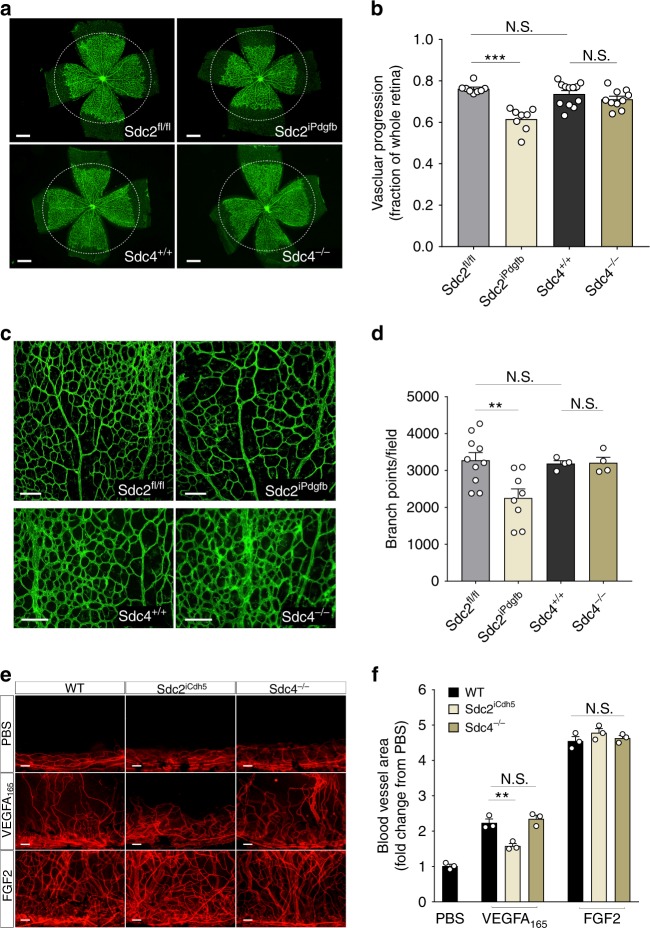
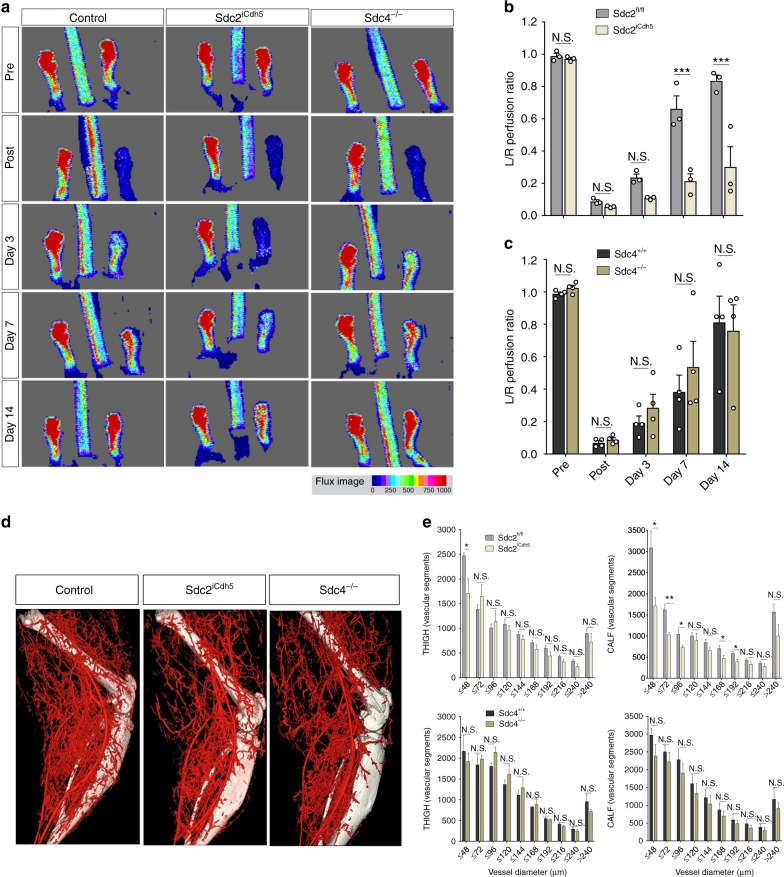
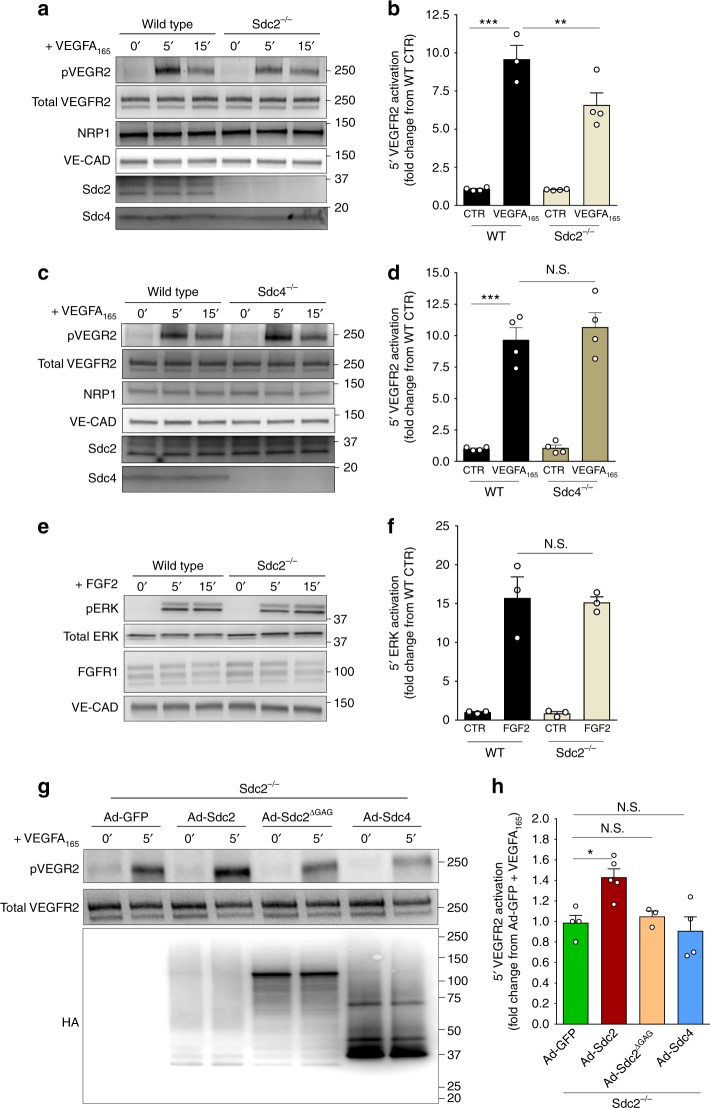
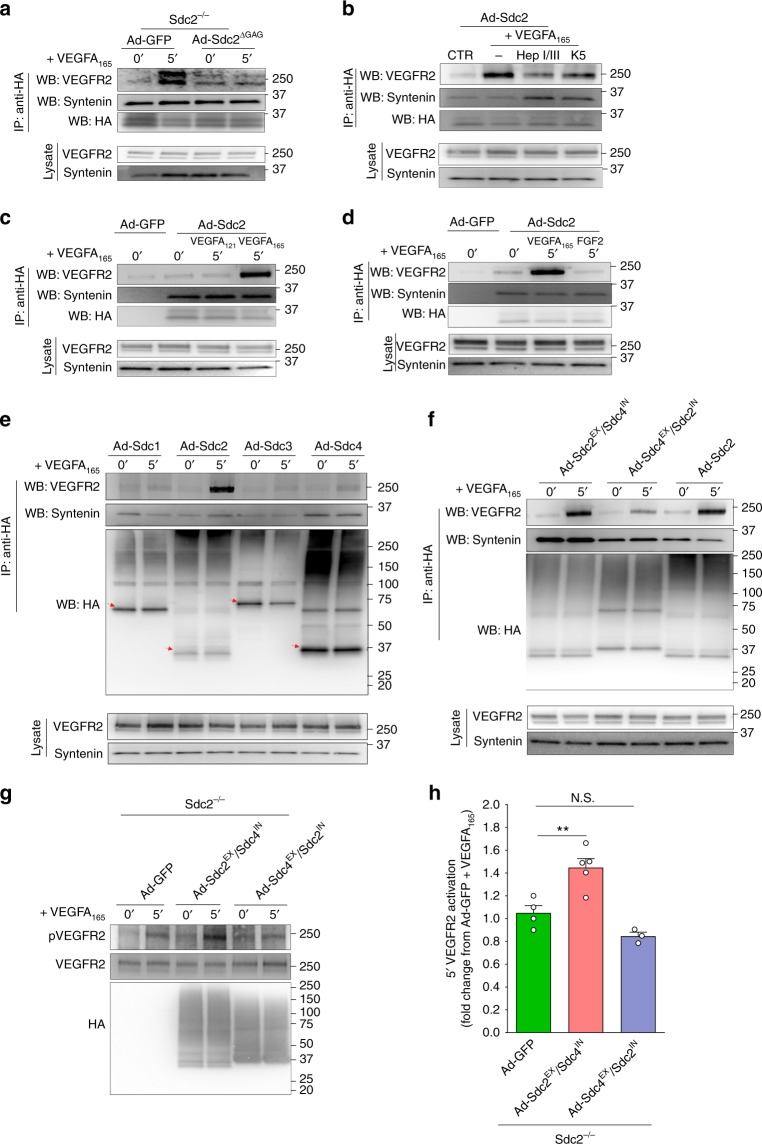
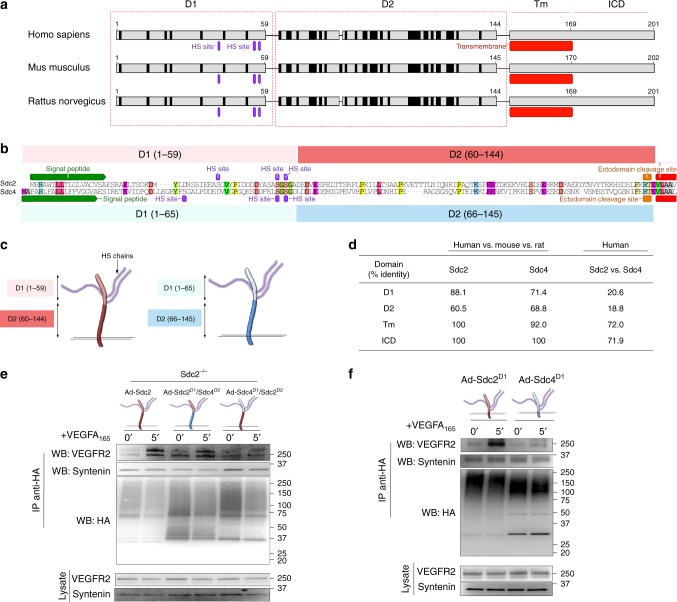
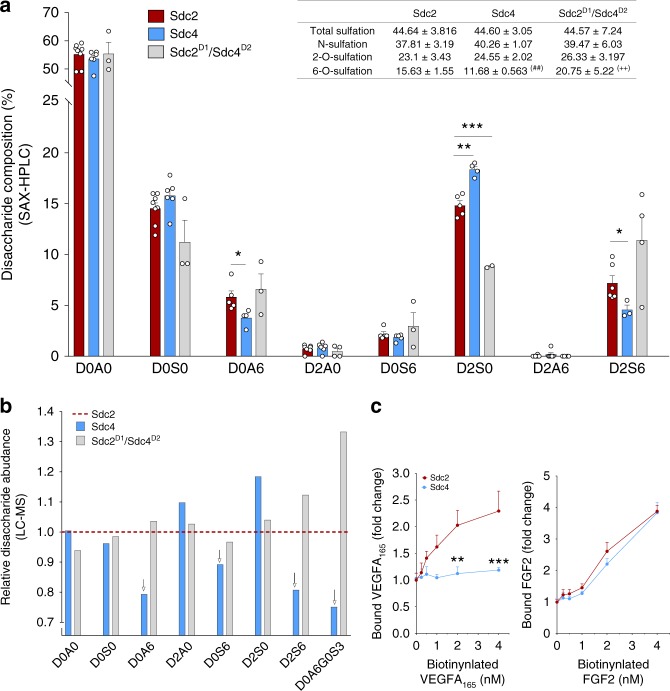
The proteoglycan Syndecan-2 (Sdc2) has been implicated in regulation of cytoskeleton organization, integrin signaling and developmental angiogenesis in zebrafish. Here we report that mice with global and inducible endothelial-specific deletion of Sdc2 display marked angiogenic and arteriogenic defects and impaired VEGFA165 signaling. No such abnormalities are observed in mice with deletion of the closely related Syndecan-4 (Sdc4) gene. These differences are due to a significantly higher 6-O sulfation level in Sdc2 versus Sdc4 heparan sulfate (HS) chains, leading to an increase in VEGFA165 binding sites and formation of a ternary Sdc2-VEGFA165-VEGFR2 complex which enhances VEGFR2 activation. The increased Sdc2 HS chains 6-O sulfation is driven by a specific N-terminal domain sequence; the insertion of this sequence in Sdc4 N-terminal domain increases 6-O sulfation of its HS chains and promotes Sdc2-VEGFA165-VEGFR2 complex formation. This demonstrates the existence of core protein-determined HS sulfation patterns that regulate specific biological activities.


Conflict of interest statement

The authors declare no competing interests.

Figures

Fig. 1
Fig. 1
Sdc2 EC deletion leads to impaired angiogenesis. ad Retinas from P6 pups were stained with isolectin B4 for specific detection of endothelium (in green). a Representative pictures of retinal vascular outgrowth for each genotype (500 µm scale bars). b Quantification of vascular progression expressed as ratio between length of vascular front and retina edge (n = 8–12 retinas from 4 to 6 mice, each dot corresponds to a different retina). c Representative pictures of vascular branching (100 µm scale bars) and quantification (d) (n = 4–10 retinas from 4 to 5 animals, each dot corresponds to a different retina). e, f PBS or indicated growth factor pellets were inserted in a cornea micro-pocket and angiogenic response was evaluated by CD31 staining (in red) after 1 week. e Representative pictures of cornea-angiogenic responses (100 µm scale bars) and quantification (f) (n = 3 mice for each treatment and genotype, each dot corresponds to a different cornea). Errors bars represent standard error of the mean (SEM). Statistical analysis was performed by one-way Anova with Bonferroni’s multiple comparison test (N.S. not significant, **P < 0.01, ***P < 0.001)
Fig. 2
Fig. 2
Sdc2 promotes blood flow recovery in HLI. ac Left CFA (common femoral artery) was ligated and blood flow recovery was measured by laser doppler at the indicated days. Recovery at each indicated day was quantified as ratio between flow perfusion in ligated vs. contralateral artery (L/R perfusion ratio). a Representative pictures of blood flow recovery at different days. Pictures for Control are shown for Sdc2fl/fl mouse. The flux image (lower right) indicates the extent of hind limb blood flow from low (blue) to high (red). b, c Quantification of blood flow recovery (n = 3–4, each dot corresponds to a different mouse). d, e Micro-CT angiography was used for visualization of functional vessels (showed in red) and quantify the number of perfused vessels (grouped by lumen diameter on the x-axis). d Representative pictures of micro-Ct angiography at day 14 and quantification (e). Source data are provided as a Source Data file. Pictures for Control are shown for Sdc2fl/fl mouse. Errors bars represent SEM. Statistical analysis was performed by two-way Anova with Sidak’s multiple comparison test (b, c) and unpaired t test (e) (N.S. not significant, *P < 0.05, **P < 0.01, ***P < 0.001)
Fig. 3
Fig. 3
Maximal VEGFR2 activation requires Sdc2 HS chains. af Primary mouse ECs from indicated genotypes were serum-starved for 12 h and then stimulated for 5 and 15 min. Activation of VEGFR2 (pVEGFR2) was assessed after stimulation with VEGFA165 (50 ng/ml) in Sdc2−/− ECs (a representative picture, b quantification) or Sdc4−/− ECs (c representative picture, d quantification). FGFR1 signaling in Sdc2−/− EC was assessed by stimulation with FGF2 (20 ng/ml) and evaluation of ERK activation (e representative picture, f quantification) (n = 3–4 for VEGFA165, n = 3 for FGF2). g, h, Sdc2−/− ECs were transduced with adenovirus expressing the indicated construct for 16 h (MOI = 1–2), starved for 12 h followed by stimulation with VEGFA165 (50 ng/ml) for 5 min. Rescue of VEGFR2 activation for indicated construct is shown (g representative picture, h quantification) (n = 3–6). Errors bars represent SEM. (N.S. not significant, *P < 0.05, **P < 0.01, ***P < 0.001, N.S. not significant, by one-way Anova with Bonferroni’s multiple comparison test)
Fig. 4
Fig. 4
VEGFR2 specifically associates with Sdc2 upon VEGFA165 stimulation. af Mouse ECs (a) or HUVEC (bf) were transduced for 16 h with adenovirus expressing the indicated construct (MOI = 1–2), starved for 8 h and then stimulated with VEGFA165 (50 ng/ml), VEGFA121 (50 ng/ml), or FGF2 (20 ng/ml). Anti-HA pulled down (IP) was performed for 2 h at 4 °C followed by western blot analysis to check co-immunoprecipitated proteins (WB). Whole-cell lysates (lysate) were analyzed for total protein levels. b HS digestion with Heparinases or K5 lyase (1 h at 37 °C) before VEGFA165 cell stimulation prevented formation of VEGFR2–Sdc2 complex. c VEGFA121, which lacks heparin-binding domain, was unable to promote VEGFR2–Sdc2 association. d FGF2 did not promote complex formation between Sdc2 and VEGFR2. e Other syndecans displayed minimal or no association with VEGFR2 with or without VEGFA165. Red arrows indicate syndecans core in dimeric form with following MW (calculated with signal peptide): Sdc1 ~65, Sdc2 ~44, Sdc3 ~91, Sdc4 ~44. f A chimera construct expressing Sdc2 extracellular domain with Sdc4 transmembrane + intracellular domain (Sdc2EX Sdc4IN) showed same extent VEGFA-induced association with VEGFR2 as full length Sdc2. g, h Rescue of VEGFR2 activation is shown with chimera construct Sdc2EX/Sdc4IN but not Sdc4EX/Sdc2IN (g representative picture, h quantification) (n = 3–4). Errors bars represent SEM. (N.S. not significant, **P < 0.01, by one-way Anova with Bonferroni’s multiple comparison test)
Fig. 5
Fig. 5
A Sdc2 conserved N-terminal region is required for specific association with VEGFR2. a Multi-alignment of Sdc2 sequences (human, mouse, and rat) unveiled that Sdc2 extracellular domain present a 59 aminoacid region with high-homology (D1) and a low-homology region (D2). Transmembrane domain (Tm) and intracellular domain (ICD) are also indicated. Black stripes identify sites that are not conserved among the three sequences. b Alignment of human Sdc2 with Sdc4 revealed little conservation in extracellular domain (colored aminoacid are conserved). Furthermore, Sdc4 does not present homology differences between D1 and D2 (see panel d); however, these regions were defined following alignment with Sdc2. c Schematic representation of D1/D2 regions in extracellular domain and relation with HS chains. d Percentual identity between various domain of Sdc2 and Sdc4. Identity is calculated by alignment of human sequence with mouse and rat (second and third column) or by alignment of human Sdc2 vs human Sdc4 (fourth column). e, f Mouse ECs (e) or HUVEC (f) were transduced for 16 h with adenovirus expressing the indicated construct (MOI = 1–2), starved for 8 h and then stimulated with VEGFA165 (50 ng/ml). e A chimera construct swapping Sdc4 D1 region with Sdc2 D1 (Sdc2D1/Sdc4D2) showed association with VEGFR2 at the same extent of full length Sdc2. Conversely, replacement of Sdc2 D1 with Sdc4 D1 (Sdc2D1/Sdc4D2) abolished Sdc2 ability to form a complex with VEGFR2. f A mutant expressing only Sdc2 D1 region (Sdc2D1) formed complex with VEGFR2 upon VEGFA165 stimulation while Sdc4 D1 did not associate with VEGFR2
Fig. 6
Fig. 6
Composition of Sdc2-linked HS chains is N-terminal domain-dependent. a, b HUVEC were transduced with adenovirus expressing the indicated syndecan extracellular domain (ED). Secreted EDs were purified by ionic-exchange chromatography (DEAE) followed by affinity chromatography (anti-HA resin). Sdc-linked HS chains were digested with Heparinase I–III and analyzed by SAX-HPLC (a, n = 4–8, each dot is an independent HS chain isolation) and LC–MS (b, 3 independent isolations). a Figure inset, Sdc2 HS chains (Sdc2) showed higher frequency of 6-O sulfation compared to Sdc4 HS chains. A Sdc4 chimera ED expressing Sdc2 D1 region in place of Sdc4 D1 (Sdc2D1/Sdc4D2) showed increased 6-O sulfation that was comparable to that seen in Sdc2 (top right inset, ##P < 0.01 vs. Sdc2, ++P < 0.01 vs. Sdc4, ±precedes the standard deviation value). b Results of LC–MS analysis are presented after normalization to Sdc2 (shown as dotted line in red at y = 1). The analysis was repeated three times with similar results (a representative image is shown). Downward arrows highlight a reduction in 6-O sulfated disaccharides. c Secreted syndecan EDs were collected, digested with 24 h with pronase and GAG chains were concentrated/enriched with DEAE column chromatography. GAG-binding plate were coated with same amount of purified chains (1 µg) and tested for binding of biotinylated-VEGFA165 (left panel) or FGF2 (right panel). Errors bars represent SEM. Statistical analysis was performed by unpaired t test (N.S. not significant, *P < 0.05, **P < 0.01, ***P < 0.001)

References

    1. Karamanos NK, et al. Proteoglycan chemical diversity drives multifunctional cell regulation and therapeutics. Chem. Rev. 2018;118:9152–9232. doi: 10.1021/acs.chemrev.8b00354. - DOI - PubMed
    1. Li JP, Kusche-Gullberg M. Heparan sulfate: biosynthesis, structure, and function. Int. Rev. Cell Mol. Biol. 2016;325:215–273. doi: 10.1016/bs.ircmb.2016.02.009. - DOI - PubMed
    1. Kjellen L, Lindahl U. Specificity of glycosaminoglycan-protein interactions. Curr. Opin. Struct. Biol. 2018;50:101–108. doi: 10.1016/j.sbi.2017.12.011. - DOI - PubMed
    1. Suflita M, Fu L, He W, Koffas M, Linhardt RJ. Heparin and related polysaccharides: synthesis using recombinant enzymes and metabolic engineering. Appl. Microbiol. Biotechnol. 2015;99:7465–7479. doi: 10.1007/s00253-015-6821-9. - DOI - PMC - PubMed
    1. Gallagher J. Fell-Muir lecture: heparan sulphate and the art of cell regulation: a polymer chain conducts the protein orchestra. Int. J. Exp. Pathol. 2015;96:203–231. doi: 10.1111/iep.12135. - DOI - PMC - PubMed

Publication types

MeSH terms

LinkOut - more resources