. 2019 Apr 5;9(1):5694.
doi: 10.1038/s41598-019-42042-y.

Generating retinal flow maps from structural optical coherence tomography with artificial intelligence

Affiliations

Generating retinal flow maps from structural optical coherence tomography with artificial intelligence

Cecilia S Lee et al. Sci Rep. .

Abstract

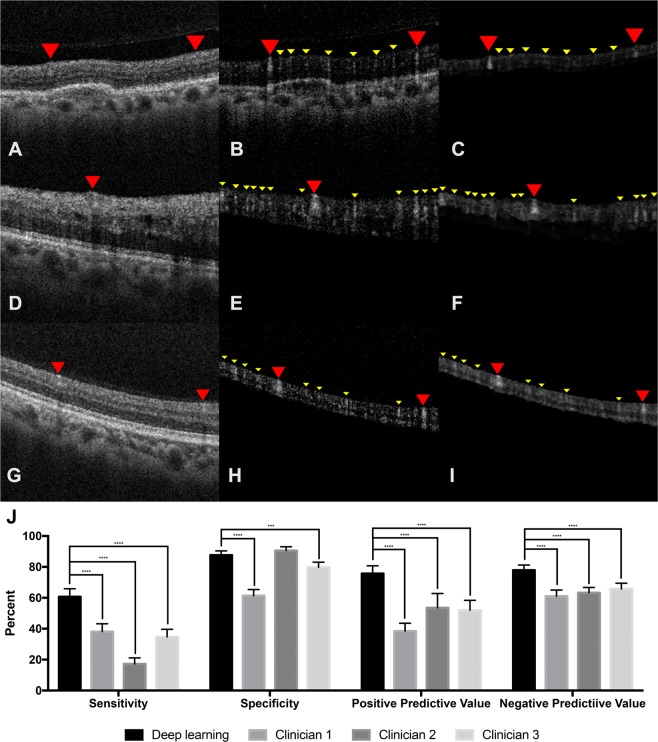
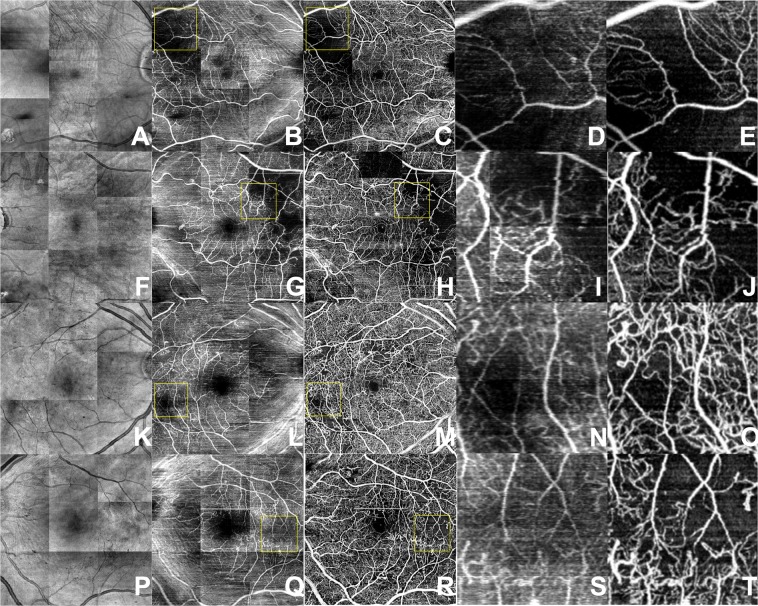
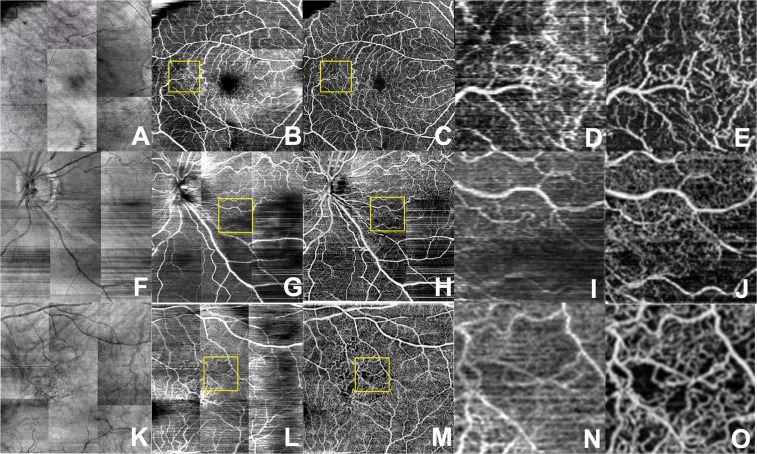
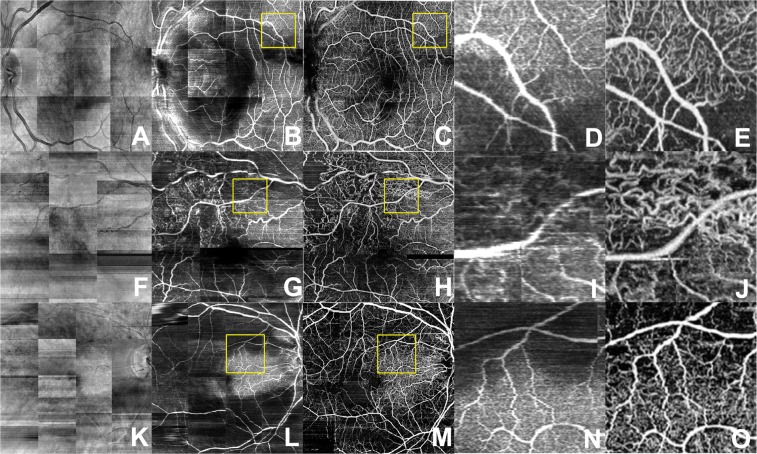
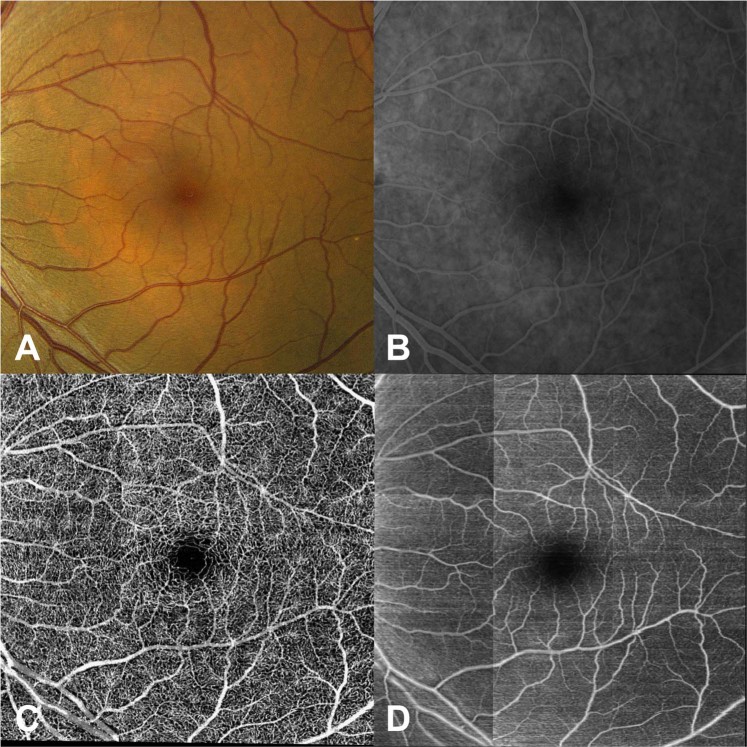
Despite advances in artificial intelligence (AI), its application in medical imaging has been burdened and limited by expert-generated labels. We used images from optical coherence tomography angiography (OCTA), a relatively new imaging modality that measures retinal blood flow, to train an AI algorithm to generate flow maps from standard optical coherence tomography (OCT) images, exceeding the ability and bypassing the need for expert labeling. Deep learning was able to infer flow from single structural OCT images with similar fidelity to OCTA and significantly better than expert clinicians (P < 0.00001). Our model allows generating flow maps from large volumes of previously collected OCT data in existing clinical trials and clinical practice. This finding demonstrates a novel application of AI to medical imaging, whereby subtle regularities between different modalities are used to image the same body part and AI is used to generate detailed inferences of tissue function from structure imaging.


Conflict of interest statement

Ruikang Wang received research support from Carl Zeiss Meditec, Inc. and co-owns a patent of OCTA technology with Oregon Health & Science University. No other conflicts of interest exist for the remaining authors.

Figures

Figure 1
Figure 1
Schematics of deep learning model architectures tested by varying block depth and number of convolutional (CN) filters (A). Learning curve for all models with Mean Standard Error (MSE) for validation sets with the same batch size and learning rate and faceted by bridge type (B). Lowest MSE after 5,000 iterations for all models (C). Learning curves for the best performing (9 blocks, 18 convolutional filters, copy and concatenation bridge) on training and validation set for an extended training session (D).
Figure 2
Figure 2
(A,D,G) Example structural OCT images from held-out test set which serves as input for the deep learning model. The red arrowheads point to a large retinal vessel that is easily identified by expert clinicians. (B,E,H) Example cross-sectional OCTA images from held-out test set. The red arrowheads point to the large retinal vessels and the yellow arrowheads point to the small hyperreflective areas that represent the retinal microvasculature and are not apparent on the structural OCT image. (C,F,I) Example cross-sectional images of CNN output from held-out test set identifying retinal vessels. The deep learning model identifies both the large retinal vessels (red arrowheads) and small (yellow arrowheads) microvasculature (yellow arrowheads) similar to the OCTA images. (J) Comparison of deep learning model against three masked retina-trained clinicians using OCTA as reference. ***P < 0.0001, ****P < 0.00001.
Figure 3
Figure 3
Diabetic retinopathy. En-face projection maps of retinal blood flow created from structural OCT volumes (A,F,K,P), AI-generated inferred flow volumes (B,G,L,Q) and OCTA flow volumes (C,H,M,R). Magnified views of the AI-generated (D,I,N,S) and OCTA (E,J,O,T) images where decreased blood flow is contrasted with normal flow. Deep learning images demonstrate similar details of superficial retinal vasculature as the OCTA image while missing higher density of deep capillary networks which are visible on OCTA images.
Figure 4
Figure 4
Branch retinal vein occlusion. En-face projection maps of retinal blood flow created from structural OCT volumes (A,F,K), AI-generated inferred flow volumes (B,G,L) and OCTA flow volumes (C,H,M). Magnified views of the AI-generated (D,I,N,S) and OCTA (E,J,O,T) images where the decreased blood flow is contrasted with normal flow.
Figure 5
Figure 5
Central retinal artery occlusion. En-face projection maps of retinal blood flow created from structural OCT volumes (A,F,K), AI-generated inferred flow volumes (B,G,L) and OCTA flow volumes (C,H,M). Magnified views of the AI-generated (D,I,N) and OCTA (E,J,O) images where decreased blood flow is contrasted with normal flow.
Figure 6
Figure 6
En-face projection maps of retinal flow created from inferred flow by deep learning (A) compared to the corresponding color fundus photo (B) and structural OCT en-face projection (C) of an eye with central retinal artery occlusion and intact cilioretinal artery.
Figure 7
Figure 7
Color fundus photo (A) of a normal retina compared to the corresponding late phase fluorescein angiogram (B), the corresponding OCTA image (C), and contiguous vessel map generated by the deep learning model (D).
Figure 8
Figure 8
Manual segmentation of vessels on color, fluorescein angiography (FA), and deep learning generated flow maps with OCTA as reference for second order (A), third order (B), and fourth order vessels (C). *P < 0.05, **P < 0.001, ***P < 0.0001.

References

    1. Murthy RK, Haji S, Sambhav K, Grover S, Chalam KV. Clinical applications of spectral domain optical coherence tomography in retinal diseases. Biomed. J. 2016;39:107–120. doi: 10.1016/j.bj.2016.04.003. - DOI - PMC - PubMed
    1. Wang RK, et al. Three dimensional optical angiography. Opt. Express. 2007;15:4083–4097. doi: 10.1364/OE.15.004083. - DOI - PubMed
    1. de Carlo TE, Romano A, Waheed NK, Duker JS. A review of optical coherence tomography angiography (OCTA) Int J Retina Vitreous. 2015;1:5. doi: 10.1186/s40942-015-0005-8. - DOI - PMC - PubMed
    1. Ting DSW, et al. Optical Coherence Tomographic Angiography in Type 2 Diabetes and Diabetic Retinopathy. JAMA Ophthalmol. 2017;135:306. doi: 10.1001/jamaophthalmol.2016.5877. - DOI - PubMed
    1. Zhang Q, et al. Wide-field optical coherence tomography based microangiography for retinal imaging. Sci. Rep. 2016;6:22017. doi: 10.1038/srep22017. - DOI - PMC - PubMed

Publication types

MeSH terms