

Influence of Chemically Disrupted Photosynthesis on Cyanobacterial Thylakoid Dynamics in Synechocystis sp. PCC 6803
- PMID: 30952892
- PMCID: PMC6450941
- DOI: 10.1038/s41598-019-42024-0
Influence of Chemically Disrupted Photosynthesis on Cyanobacterial Thylakoid Dynamics in Synechocystis sp. PCC 6803
Abstract
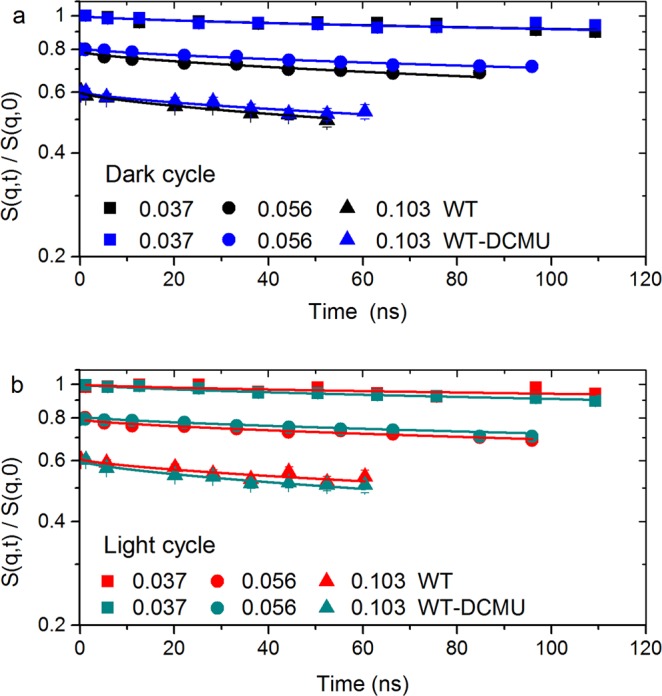
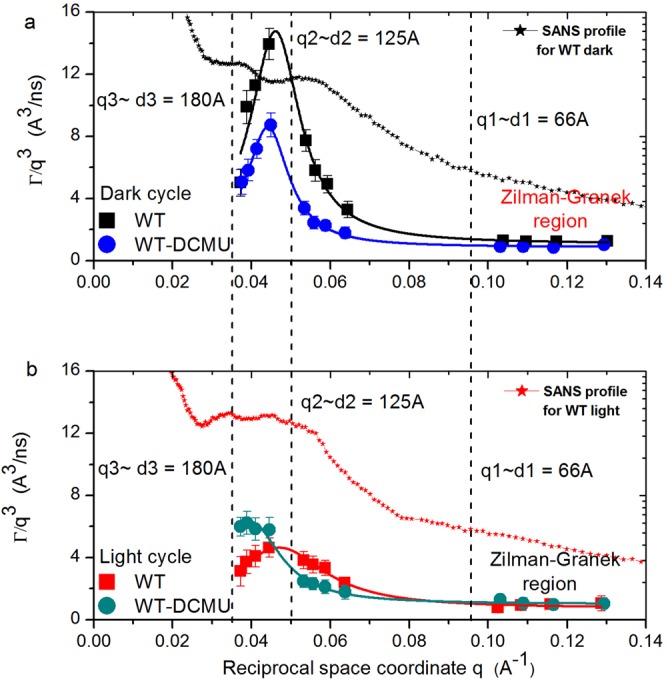
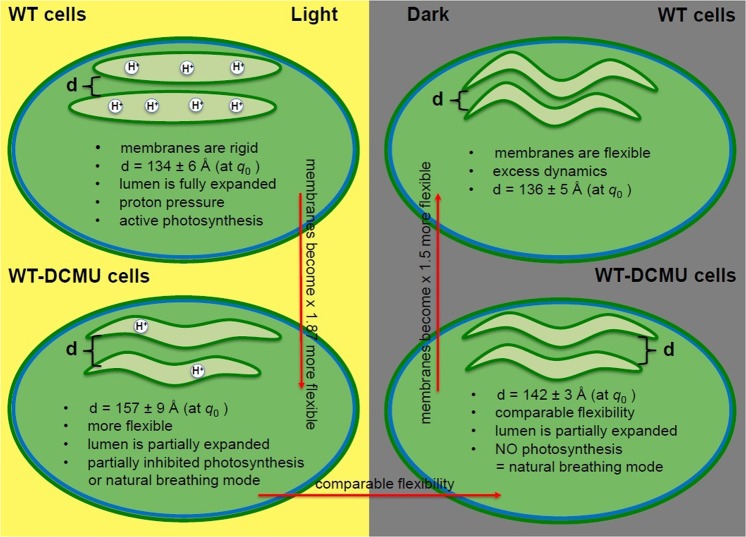
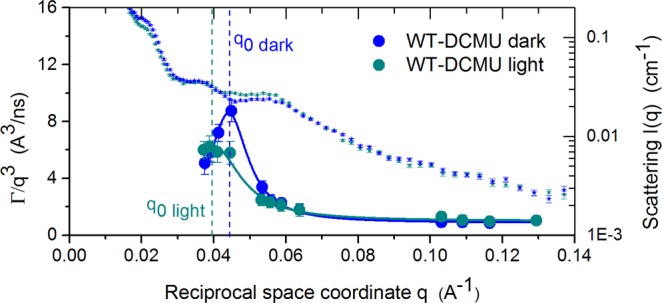
The photosynthetic machinery of the cyanobacterium Synechocystis sp. PCC 6803 resides in flattened membrane sheets called thylakoids, situated in the peripheral part of the cellular cytoplasm. Under photosynthetic conditions these thylakoid membranes undergo various dynamical processes that could be coupled to their energetic functions. Using Neutron Spin Echo Spectroscopy (NSE), we have investigated the undulation dynamics of Synechocystis sp. PCC 6803 thylakoids under normal photosynthetic conditions and under chemical treatment with DCMU (3-(3,4-dichlorophenyl)-1,1-dimethylurea), an herbicide that disrupts photosynthetic electron transfer. Our measurements show that DCMU treatment has a similar effect as dark conditions, with differences in the undulation modes of the untreated cells compared to the chemically inhibited cells. We found that the disrupted membranes are 1.5-fold more rigid than the native membranes during the dark cycle, while in light they relax approximately 1.7-fold faster than native and they are 1.87-fold more flexible. The strength of the herbicide disruption effect is characterized further by the damping frequency of the relaxation mode and the decay rate of the local shape fluctuations. In the dark, local thicknesses and shape fluctuations relax twice as fast in native membranes, at 17% smaller mode amplitude, while in light the decay rate of local fluctuations is 1.2-fold faster in inhibited membranes than in native membranes, at 56% higher amplitude. The disrupted electron transfer chain and the decreased proton motive force within the lumenal space partially explain the variations observed in the mechanical properties of the Synechocystis membranes, and further support the hypothesis that the photosynthetic process is tied to thylakoid rigidity in this type of cyanobacterial cell.
Conflict of interest statement
The authors declare no competing interests.
Figures
References
-
- Herrero, A. & Flores, E. The Cyanobacteria: Molecular Biology, Genomics and Evolution | Book. Caister Acad. Press 484 (2008).
-
- Mullineaux CW. The thylakoid membranes of cyanobacteria: Structure, dynamics and function. Aust. J. Plant Physiol. 1999;26:671–677.
-
- Nagy, G. et al. Kinetics of structural reorganizations in multilamellar photosynthetic membranes monitored by small-angle neutron scattering. Eur. Phys. J. E36 (2013). - PubMed
Publication types
MeSH terms
Substances
LinkOut - more resources
Full Text Sources
