. 2019 Apr 5;9(1):5685.
doi: 10.1038/s41598-019-42107-y.

Integrative analysis identifies lincRNAs up- and downstream of neuroblastoma driver genes

Affiliations

Integrative analysis identifies lincRNAs up- and downstream of neuroblastoma driver genes

Dries Rombaut et al. Sci Rep. .

Erratum in

Abstract

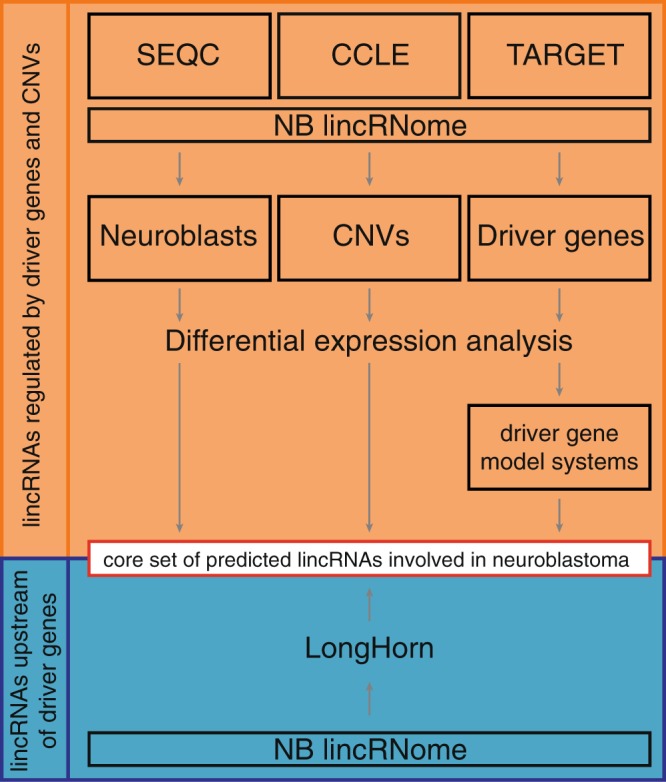
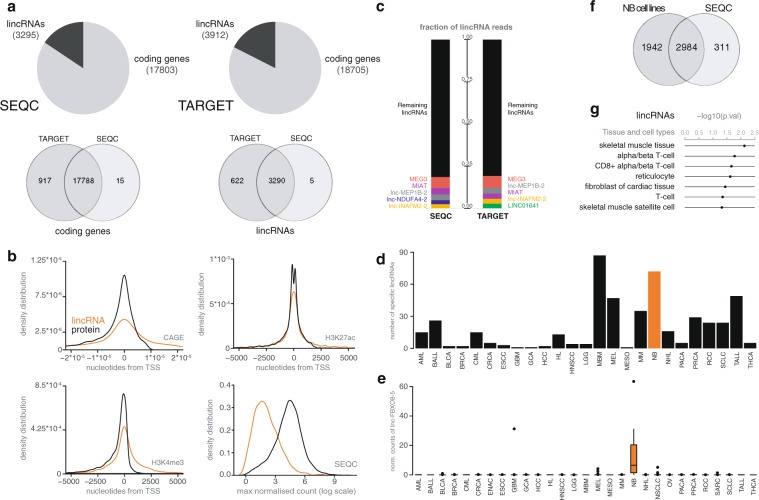
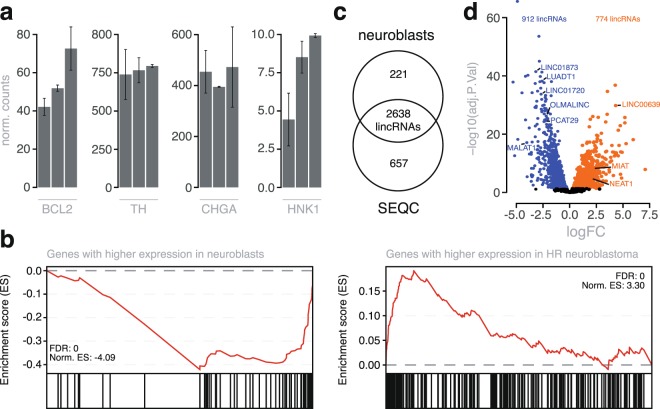
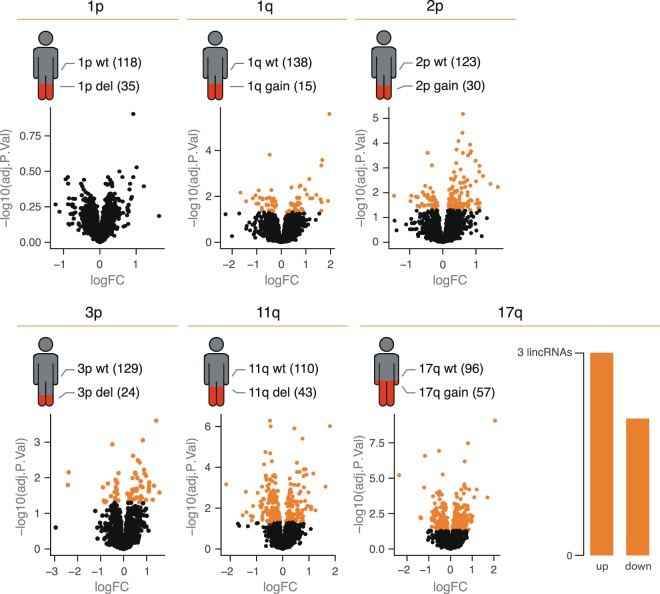
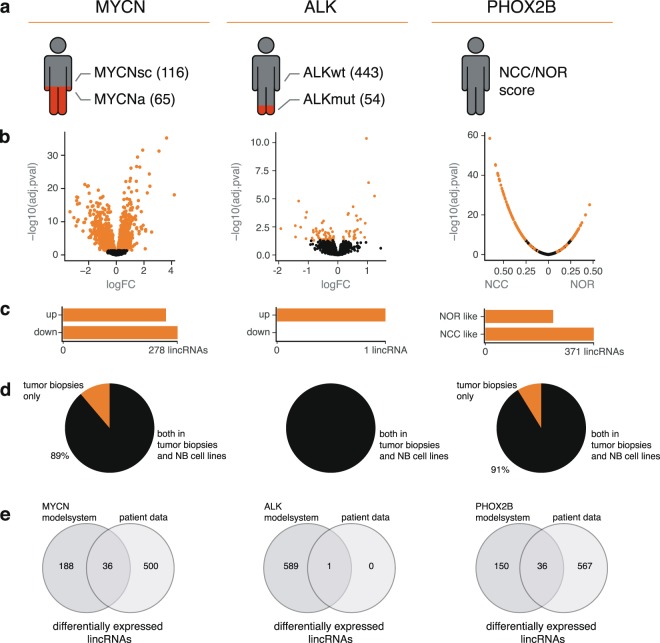
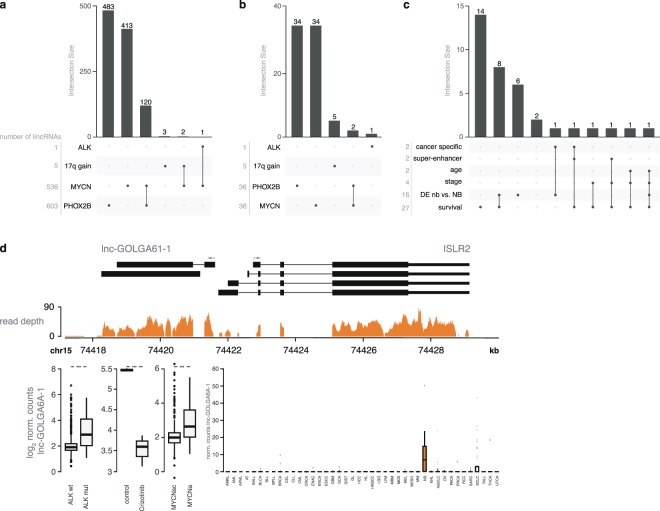
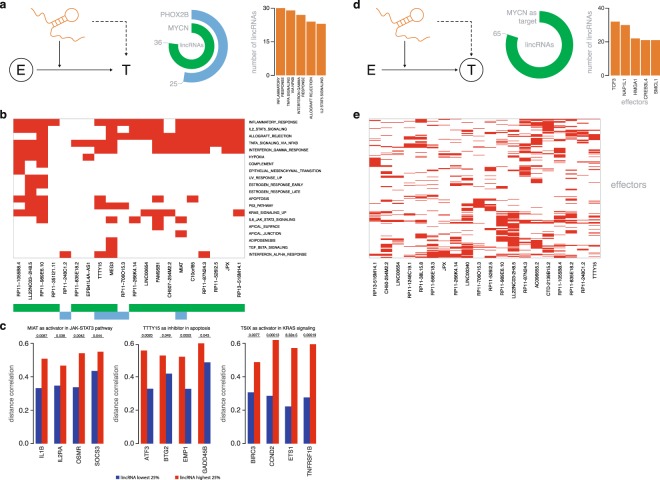
Long intergenic non-coding RNAs (lincRNAs) are emerging as integral components of signaling pathways in various cancer types. In neuroblastoma, only a handful of lincRNAs are known as upstream regulators or downstream effectors of oncogenes. Here, we exploit RNA sequencing data of primary neuroblastoma tumors, neuroblast precursor cells, neuroblastoma cell lines and various cellular perturbation model systems to define the neuroblastoma lincRNome and map lincRNAs up- and downstream of neuroblastoma driver genes MYCN, ALK and PHOX2B. Each of these driver genes controls the expression of a particular subset of lincRNAs, several of which are associated with poor survival and are differentially expressed in neuroblastoma tumors compared to neuroblasts. By integrating RNA sequencing data from both primary tumor tissue and cancer cell lines, we demonstrate that several of these lincRNAs are expressed in stromal cells. Deconvolution of primary tumor gene expression data revealed a strong association between stromal cell composition and driver gene status, resulting in differential expression of these lincRNAs. We also explored lincRNAs that putatively act upstream of neuroblastoma driver genes, either as presumed modulators of driver gene activity, or as modulators of effectors regulating driver gene expression. This analysis revealed strong associations between the neuroblastoma lincRNAs MIAT and MEG3 and MYCN and PHOX2B activity or expression. Together, our results provide a comprehensive catalogue of the neuroblastoma lincRNome, highlighting lincRNAs up- and downstream of key neuroblastoma driver genes. This catalogue forms a solid basis for further functional validation of candidate neuroblastoma lincRNAs.


Conflict of interest statement

The authors declare no competing interests.

Figures

Figure 1
Figure 1
Included data sets and analyses in the study. The SEQC, CCLE and TARGET data sets were used to determine the NB lincRNome. The abundance of the robustly expressed lincRNAs in the lincRNome was used to compare expression between neuroblast and NB samples, primary tumor samples containing CNVs and samples without gains or deletions and NB tumors with and without mutations, amplifications or associations with NB driver genes. The regulation of lincRNAs correlated with NB driver genes was assessed in cellular perturbation models. To determine the involvement of lincRNAs in modulating the effect or regulation of these driver genes, we made use of a state-of-the-art algorithm called LongHorn. Combined, these analyses allow us to arrive at a core set of predicted NB associated lincRNAs.
Figure 2
Figure 2
Establishing the NB lincRNome. (a) Based on Ensembl annotation, a set of 3295 lincRNAs was robustly expressed in the SEQC dataset, whereas 3912 lincRNAs were found in the TARGET dataset. A total of 3290 lincRNAs were expressed in both groups. (b) Density distribution plots showing distances of chromatin marks and CAGE peaks to the TSS and expression levels, for protein coding genes and lincRNAs. (c) Percentages of the lincRNA derived read counts for the top 5 expressed lincRNAs for the SEQC and TARGET datasets. (d) Bar plot showing the number of specific lincRNAs per cancer type. (e) Expression pattern of a randomly selected neuroblastoma specific lincRNA lnc-FBX08-5 across the different cancer types. (f) Overlap of expressed lincRNAs between NB cell lines and SEQC. (g) Fischer exact-test p-values (non-adjusted) for lincRNAs that are only expressed in the SEQC dataset and are associated with stromal cell types according to FANTOM5. (Cancer type abbreviations: AML: Acute monocytic leukemia; BALL: B-cell Acute Lymphoblastic Leukemia; BLCA: Bladder Carcinoma; BRCA: Breast Carcinoma; CML: Chronic Myelogenous Leukemia; CRCA: Colon Adenocarcinoma; ESCC: Esophageal Squamous Cell Carcinoma; GBM: Glioblastoma; GCA: Gastric Carcinoma; HCC: Hepatocellular Carcinoma; HL: Hodgkin Lymphoma; HSNCC: Head and Neck Squamous Cell Carcinoma; LGG: Brain Lower Grade Glioma; MBM: Medulloblastoma; MEL: Melanoma; MESO: Mesothelioma; MM: Plasma cell myeloma; NB: Neuroblastoma; NHL: Non-Hodgkin Lymphoma; PACA: Pancreatic Adenocarcinoma; PRCA: Prostate carcinoma; RCC: Renal Cell Carcinoma; SCLC: Small Cell Lung Carcinoma; TALL: T-cell Acute Lymphoblastic Leukemia; THCA: Thyroid gland carcinoma.)
Figure 3
Figure 3
Establishing the neuroblast lincRNome. (a) Expression profiles of neural and chromaffin markers in the neuroblast samples (mean epxr. +/− SE). (b) GSEA results on a logFC ordered mRNA list, derived from differential expression analysis between neuroblasts and high-risk NB tumors, using neuroblast/HR NB specific gene sets. (c) Number and overlap of expressed lincRNAs in neuroblast and NB samples. (d) Volcano plot of differentially expressed lincRNAs between neuroblasts and high-risk neuroblastoma samples at q < 0.05. The orange dots represent upregulated genes (774 lincRNAs) in HR NB samples, whereas the blue dots depict genes with a lower abundance (912 lincRNAs).
Figure 4
Figure 4
Altered expression levels of lincRNAs by copy number variations. Schematic representation of the number of cases with a copy number variation (1p deletion, 1q gain, 2p gain, 3p deletion, 11q deletion and 17q gain) present in our data set. The volcano plots show differentially expressed lincRNAs per copy number variation. Only 17q gain resulted in 5 robust significantly differentially expressed lincRNAs after iterative differential expression analysis (upregulated lincRNAs: lnc-BRC1-2, LINC02432, lnc-RPS6KA4-3; downregulated: LINC02211, LINC01930).
Figure 5
Figure 5
Regulation of lincRNAs by key driver genes. (a) Depiction of number of samples in our dataset for the three subtypes of genomic aberrations. (b) Volcano plot showing differentially expressed lincRNAs using all samples mentioned in (a) at q < 0.05 (orange dots). In the case of PHOX2B, correlation coefficient and adjusted p-value are represented. Here, the orange dots represent genes with opposing signs and significance for their correlation with the CRC scores. (c) Number of differentially expressed lincRNAs for MYCN and ALK. The far-right bar plot represents the number of lincRNAs found to be significantly correlated with both the PHOX2B CRC and JUN/FOS CRC in opposing directions. (d) Percentage of differentially expressed lincRNAs that are expressed in both the CCLE NB cell lines and the SEQC data set, or solely in the tumor biopsies. (e) Overlap of differentially expressed lincRNAs found in the SEQC analysis and after perturbation of the driver genes in the corresponding model systems (p < 0.05).
Figure 6
Figure 6
Association of lincRNAs with genetic and clinical parameters. (a) Number of lincRNAs regulated by one or more driver gene(s) or differentially expressed upon copy number variation in the patient samples. (b) Number of lincRNAs regulated by one or more driver genes or differentially expressed upon copy number variation, for lincRNAs differentially expressed in both the patient samples and model systems. (c) Number of lincRNAs regulated by MYCN, associated with clinical and genetic features. (d) Representation of the genomic locus and RNAseq data of lnc-GOLGA6A-1. lnc-GOLGA6A-1 expression levels in ALK wild type and mutated samples, and MYCN amplified and single copy samples are shown, together with expression of the lincRNA upon crizotinib treatment, an ALK inhibitor. The boxplot shows the expression pattern of lnc-GOLGA6A-1 across the different cancer types.
Figure 7
Figure 7
Identification of lincRNAs as modulators of activity or expression of driver genes. (a) Schematic representation of the investigated lincRNAs, modulating the activity of the effector proteins, MYCN and PHOX2B. The circular plots display the number of lincRNAs, expressed in NB cell lines, found to be modulators of MYCN and PHOX2B targets. Bar plots show the top 5 hallmarks that were significantly enriched (Fisher exact test, p < 0.001). (b) The heatmap visualizes the clustering of the significantly enriched hallmarks for the top 20 modulating lincRNAs. (c) Differences in distance correlation between the samples of low and high abundance of the lincRNAs. The presented targets are genes enriched in the hallmark gene sets. (d) Schematic representation of the investigated lincRNAs, regulating the activity of the target protein MYCN. The circular plots display the number of activating and inhibiting lincRNAs modulating MYCN expression. The top 5 effectors targeting MYCN are shown in the bar plot. (e) Clustering of the top 20 regulating lincRNAs with MYCN as target is visualized in the heatmap.

References

    1. Djebali S, et al. Landscape of transcription in human cells. Nature. 2012;489:101. doi: 10.1038/nature11233. - DOI - PMC - PubMed
    1. The ENCODE Project Consortium. The ENCODE (ENCyclopedia Of DNA Elements) Project. Science (80-.). 306, 636 LP-640 (2004). - PubMed
    1. Hon C-C, et al. An atlas of human long non-coding RNAs with accurate 5′ ends. Nature. 2017;543:199. doi: 10.1038/nature21374. - DOI - PMC - PubMed
    1. Volders P-J, et al. LNCipedia: a database for annotated human lncRNA transcript sequences and structures. Nucleic Acids Res. 2013;41:D246–D251. doi: 10.1093/nar/gks915. - DOI - PMC - PubMed
    1. Volders, P.-J. et al. LNCipedia 5: towards a reference set of human long non-coding RNAs. Nucleic Acids Res. gky1031–gky1031 (2018). - PMC - PubMed

Publication types

MeSH terms