. 2019 Apr 5;9(1):5668.
doi: 10.1038/s41598-019-42221-x.

MicroRNA let-7g acts as tumor suppressor and predictive biomarker for chemoresistance in human epithelial ovarian cancer

Affiliations

MicroRNA let-7g acts as tumor suppressor and predictive biomarker for chemoresistance in human epithelial ovarian cancer

Flavia Biamonte et al. Sci Rep. .

Abstract

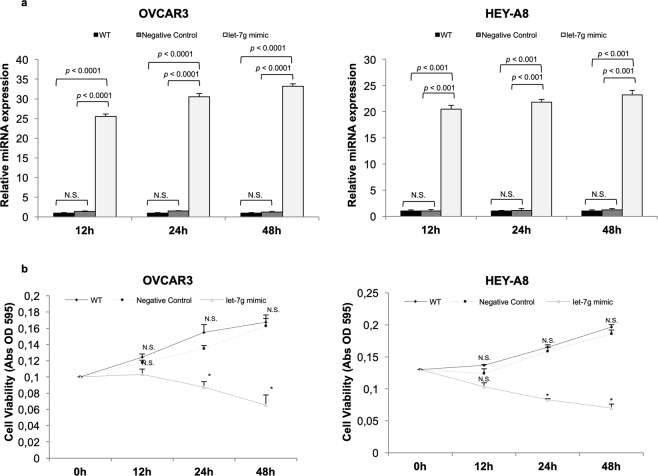
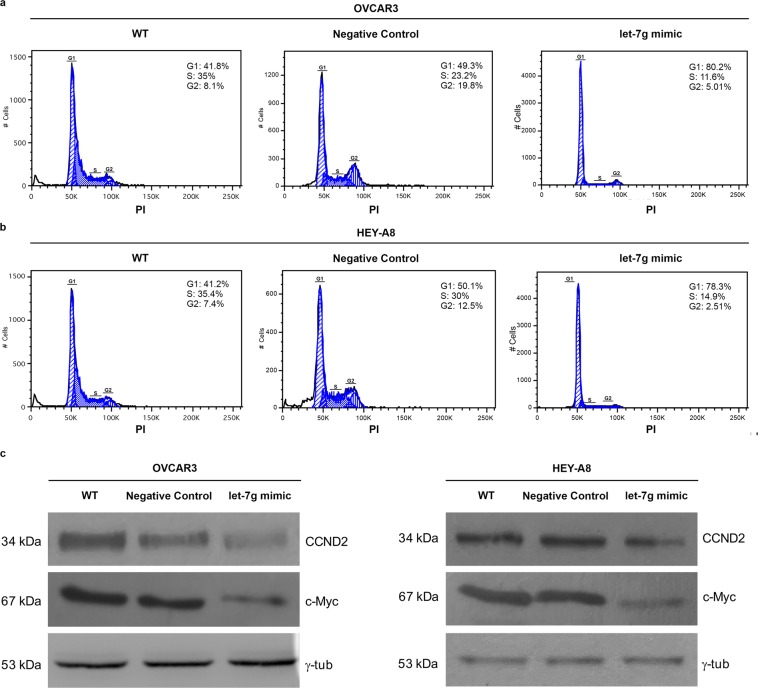
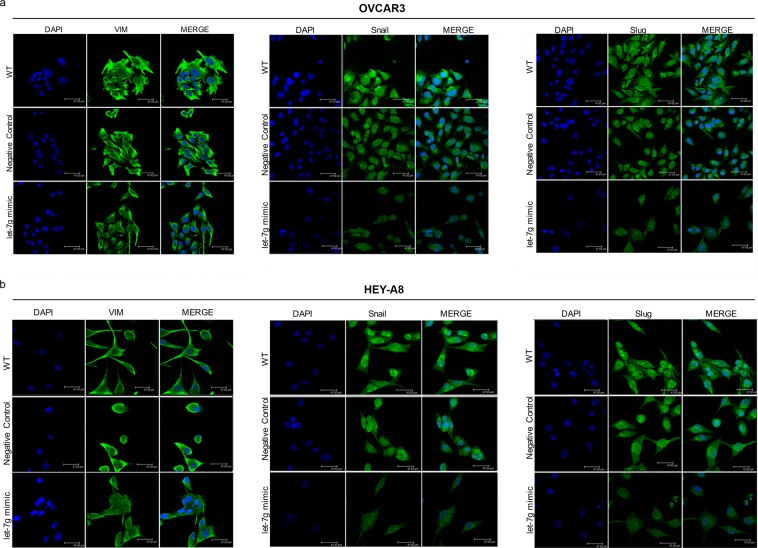
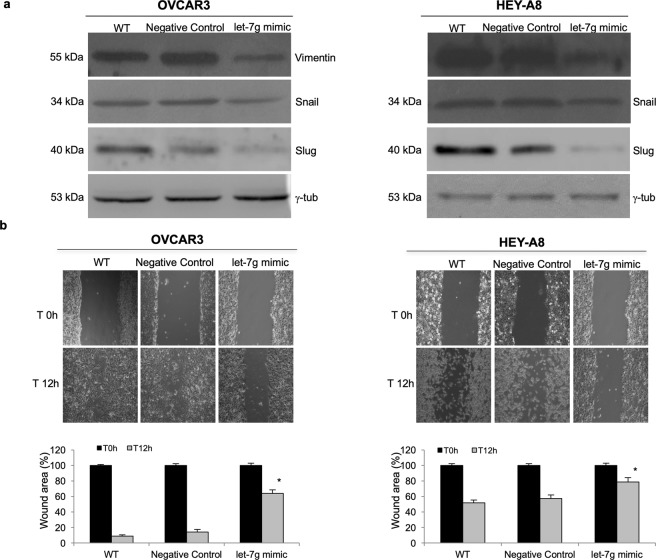
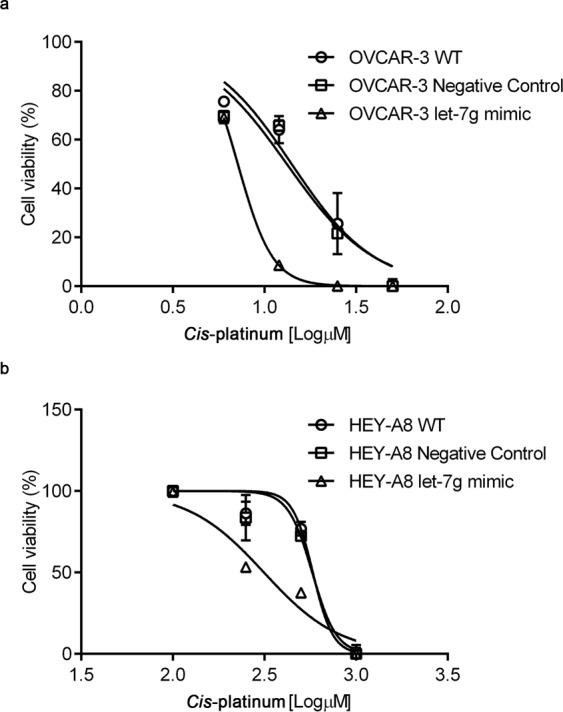
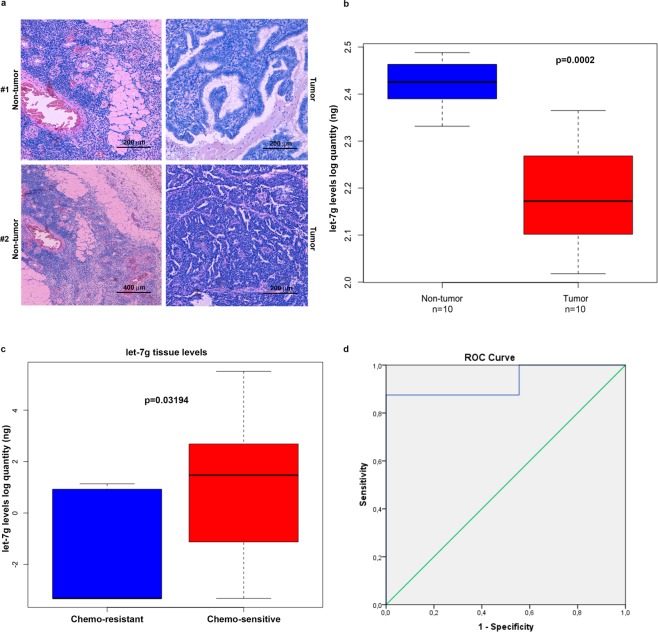
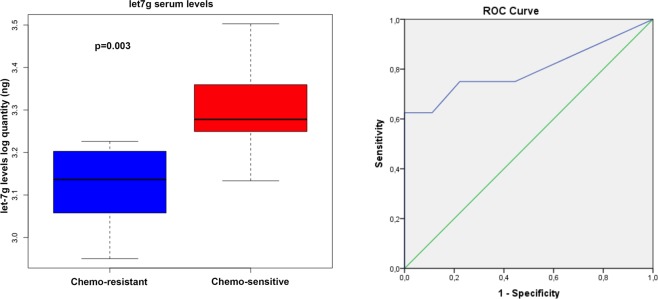
Remarkable deregulation of microRNAs has been demonstrated in epithelial ovarian cancer (EOC). In particular, some of the let-7 miRNA family members have been proposed as tumor suppressors. Here, we explored the functional roles of let-7g in EOC. The ectopic overexpression of let-7g in OVCAR3 and HEY-A8 EOC cells induced i) a down-regulation of c-Myc and cyclin-D2 thus promoting cell cycle arrest, ii) a reduction of Vimentin, Snail and Slug thus counteracting the progression of epithelial to mesenchymal transition, iii) a chemosensitization to cis-platinum treatment. Next, analysis of human EOC tissues revealed that let-7g expression was significantly reduced in tumor tissue specimens of patients with EOC compared to their non-tumor counterparts (p = 0.0002). Notably, low let-7g tissue levels were significantly associated with acquired chemoresistance of patients with late-stage of EOC (n = 17, p = 0.03194). This finding was further validated in the serum samples collected from the same cohort of patients (n = 17, p = 0.003). To conclude, we demonstrate that let-7g acts as tumor suppressor and might be used to disable EOC tumor progression and chemoresistance to cis-platinum-based chemotherapy. Furthermore, we propose that decreased expression of let-7g could serve as a tissue and serum biomarker able to predict the chemo-resistant features of EOC patients.


Conflict of interest statement

The authors declare no competing interests.

Figures

Figure 1
Figure 1
Let-7g mimic inhibits OVCAR3 and HEY-A8 cell growth. (a) Taqman analysis of let-7g expression in OVCAR3 and HEY-A8 cells non transfected (OVCAR3 WT and HEY-A8 WT) or transfected with either a specific let-7g mimic (OVCAR3let-7g mimic and HEY-A8let-7g mimic) or a negative control (OVCAR3Negative Control and HEY-A8Negative Control) at 12 h, 24 h and 48 h. N.S. Not Significant. (b) MTT analysis of OVCAR3 and HEY-A8 cell growth at 12 h, 24 h, 48 h upon let-7g mimic transfection. Data are shown as mean ± SD of three independent biological replicates (*p < 0.05).
Figure 2
Figure 2
Let-7g mimic promotes cell cycle arrest in OVCAR3 and HEY-A8 cell lines. Flow cytometry analyses of OVCAR3 (a) and HEY-A8 (b) cells upon 24 h transfection with let-7g mimic and stained with PI. Each assay was performed at least three times on biological replicates. Representative plots with percentage of cells in G1, S and G2 cell cycle phases in each group is shown. (c) Representative western blot of cell cycle regulators c-Myc and Cyclin D2 (CCND2) in OVCAR3 and HEY-A8 control cells and OVCAR3 and HEY-A8 cells transfected with let-7g mimic for 24 h. Displayed blots are not cropped from different parts of the same gel, or from different gels.
Figure 3
Figure 3
Let-7g mimic promotes apoptosis exclusively in OVCAR3 cells. Representative plots of Annexin V/ 7-AAD apoptosis assays in OVCAR3WT, OVCAR3Negative Control and OVCAR3let-7g mimic (a) as well as in HEY-A8WT, HEY-A8Negative Control and HEY-A8let-7g mimic (b) at 24 h of let-7g mimic transfection. Each assay was performed at least three times on biological replicates. (c) Representative western blot of apoptotic related markers Bcl-2, Caspase 3 and Fas in OVCAR3 and HEY-A8 control cells and OVCAR3 and HEY-A8 cells transfected with let-7g mimic for 24 h. Displayed blots are not cropped from different parts of the same gel, or from different gels.
Figure 4
Figure 4
Effects of let-7g mimic on Vimentin, Snail and Slug in OVCAR3 and HEY-A8 cells measured by Immunofluorescence assays (a) Representative images of immunofluorescence analysis of Vimentin, Snail and Slug expression in OVCAR3 (a) and HEY-A8 (b) upon 12 h of transient transfection with let-7g mimic or miRNA mimic negative control. OVCAR3WT and HEY-A8WT were also analyzed as further controls. Blue, nuclei were stained with DAPI. Images were collected using Leica TCS SP2 confocal microscopy system (63x). Analyses were performed in triplicate.
Figure 5
Figure 5
Let-7g mimic reduces Vimentin, Snail and Slug protein levels and cell motility in OVCAR3 and HEY-A8 cells. (a) Representative western blot analyses of the EMT-related proteins Vimentin, Snail and Slug in OVCAR3 and HEY-A8 control cells and OVCAR3 and HEY-A8 cells transfected with let-7g mimic for 12 h. Analyses were performed in triplicate. Displayed blots are not cropped from different parts of the same gel, or from different gels. (b) Representative images of wound healing assays in OVCAR3 and HEY-A8 control cells and OVCAR3 and HEY-A8 cells transfected with let-7g mimic. Images of cellular migration were taken at times 0 h and 12 h (magnification of 10x) using the Leica DFC420 C and Leica Application Suite Software. Analyses were performed in triplicate. Wound area quantification performed by ImageJ software is reported as %. *p < 0.05 let-7g mimic vs Negative Control or WT samples at 12 h.
Figure 6
Figure 6
Let-7g mimic promotes cis-platinum sensitivity in OVCAR3 and HEY-A8 cell lines. Analysis of log EC50 was used to compare cytotoxicity of cis-platinum treatment for 24 h in OVCAR3WT, OVCAR3Negative Control and OVCAR3let-7g mimic (a) and in HEY-A8WT, HEY-A8Negative Control and HEY-A8let-7g mimic (b). Treatments were performed at least three times on independent biological replicates. Cis-platinum concentrations are expressed as log [µM].
Figure 7
Figure 7
Let-7g is down-regulated in tumor tissues and discriminates chemoresistant from chemosensitive HGSC patients. (a) Representative images of ovarian cancer tissues and relative non-tumor counterparts. (b) Box Plot depicting let-7g levels, expressed as log quantity (ng), as assessed by absolute TaqMan analysis in tumor tissues (n = 10) and their relative non-tumor tissues (n = 10) when available (p = 0.0002). (c) TaqMan analysis of let-7g tissue levels, expressed as log quantity (ng), in chemo-resistant HGSC patients (n = 9) and chemo-sensitive HGSC patients (n = 8). Data were analyzed by Kruskal–Wallis test and represented as box plot. (p = 0.03194). (d) ROC curve analysis for let-7g to discriminate HGSC patients who respond to chemotherapy from those who not-completely respond to chemotherapy.
Figure 8
Figure 8
Let-7g serum levels discriminate chemoresistant from chemosensitive HGSC patients. TaqMan analysis of let-7g serum levels, expressed as log quantity (ng), in chemo-resistant HGSC patients (n = 9) and chemo-sensitive HGSC patients (n = 8) (left). Data were analyzed by Kruskal–Wallis test and represented as box plot (p = 0.003). ROC curve analysis for let-7g to discriminate HGSC patients who respond to chemotherapy from those who not-completely respond to chemotherapy (right).

References

    1. Krzystyniak J, Ceppi L, Dizon DS, Birrer MJ. Epithelial ovarian cancer: the molecular genetics of epithelial ovarian cancer. Ann Oncol. 2016;1:i4–i10. doi: 10.1093/annonc/mdw083. - DOI - PMC - PubMed
    1. Kelland L. The resurgence of platinum-based cancer chemotherapy. Nat Rev Cancer. 2007;7:573–84. doi: 10.1038/nrc2167. - DOI - PubMed
    1. Zhao YN, Chen GS, Hong SJ. Circulating microRNAs in gynecological malignancies: from detection to prediction. Exp Hematol Oncol. 2014;3:14. doi: 10.1186/2162-3619-3-14. - DOI - PMC - PubMed
    1. Agarwal R, Kaye SB. Ovarian cancer: strategies for overcoming resistance to chemotherapy. Nat Rev Cancer. 2003;3:502–16. doi: 10.1038/nrc1123. - DOI - PubMed
    1. Sölétormos G, et al. Clinical use of cancer biomarkers in epithelial ovarian cancer: updated guidelines from the european group on tumor markers. Int J Gynecol Cancer. 2016;26:43–51. doi: 10.1097/IGC.0000000000000586. - DOI - PMC - PubMed

MeSH terms