. 2019 Apr 5;9(1):5670.
doi: 10.1038/s41598-019-42153-6.

O-GlcNAc Transferase Inhibition Differentially Affects Breast Cancer Subtypes

Affiliations

O-GlcNAc Transferase Inhibition Differentially Affects Breast Cancer Subtypes

Anna Barkovskaya et al. Sci Rep. .

Abstract

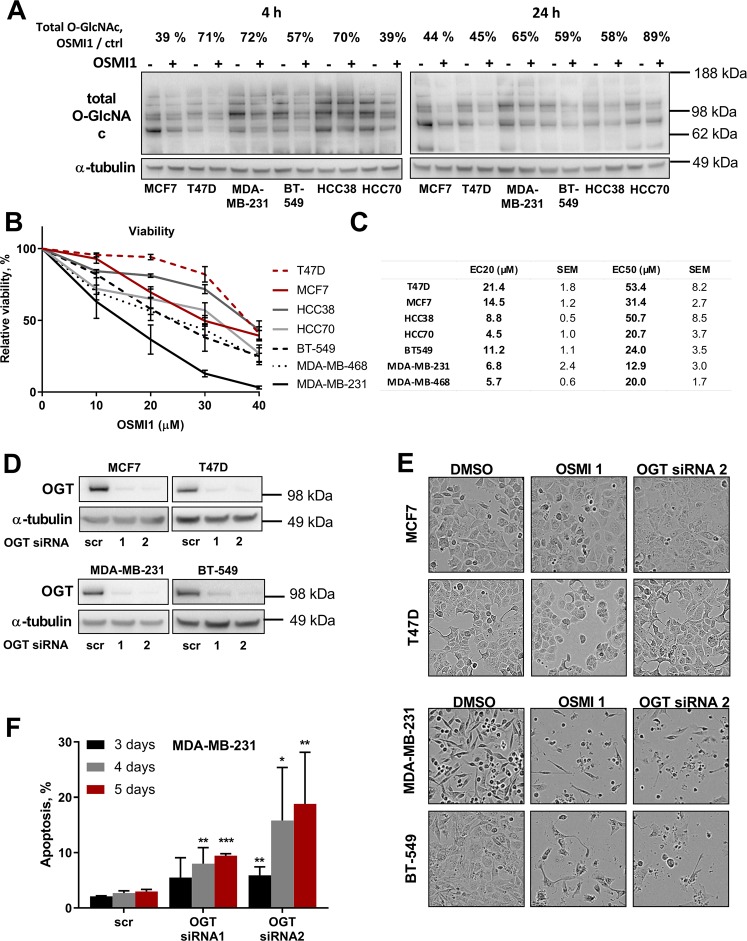
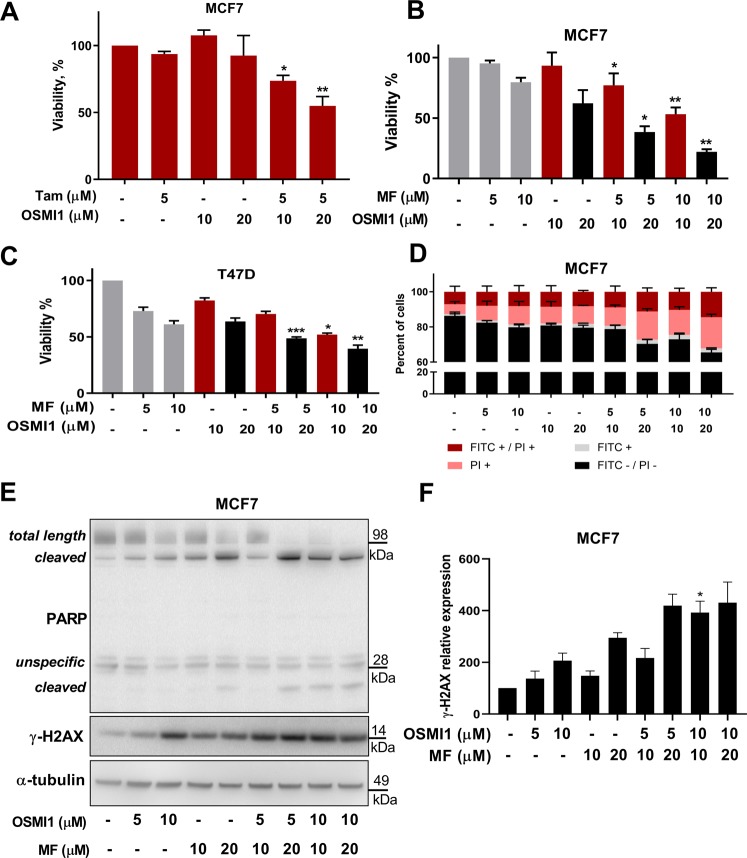
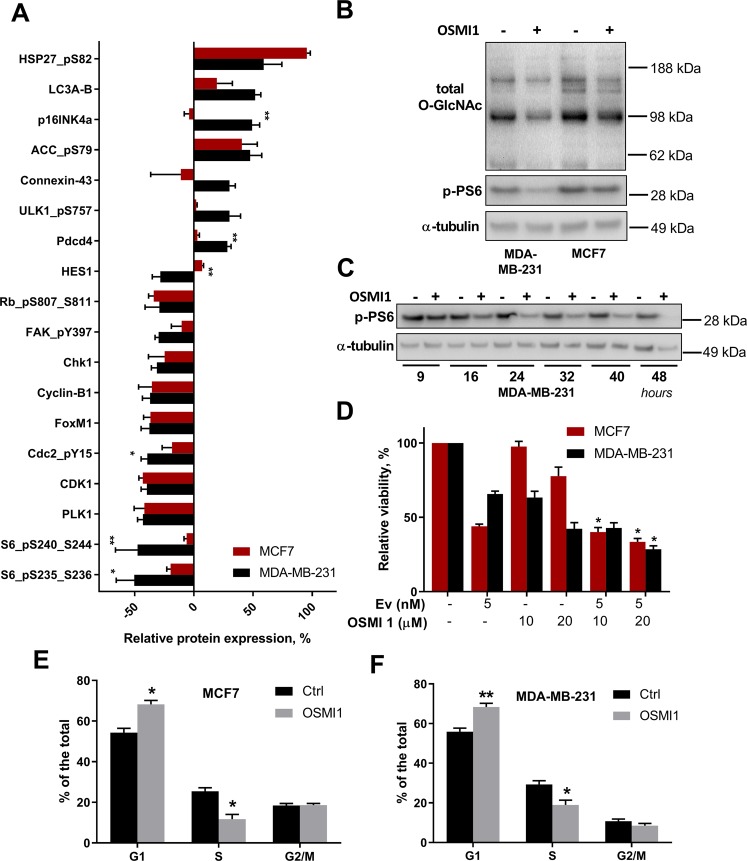
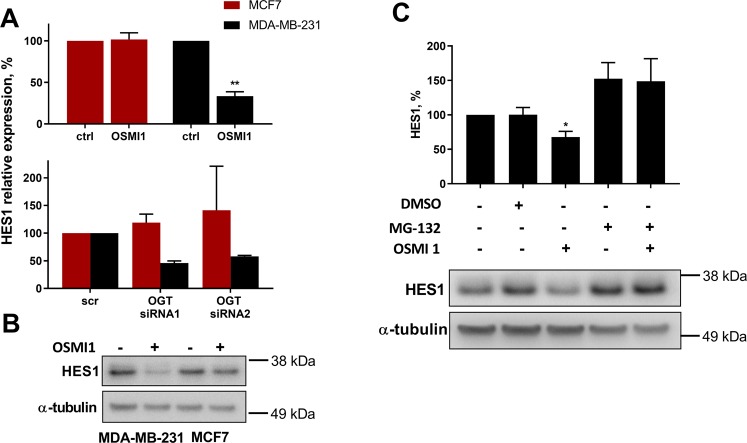
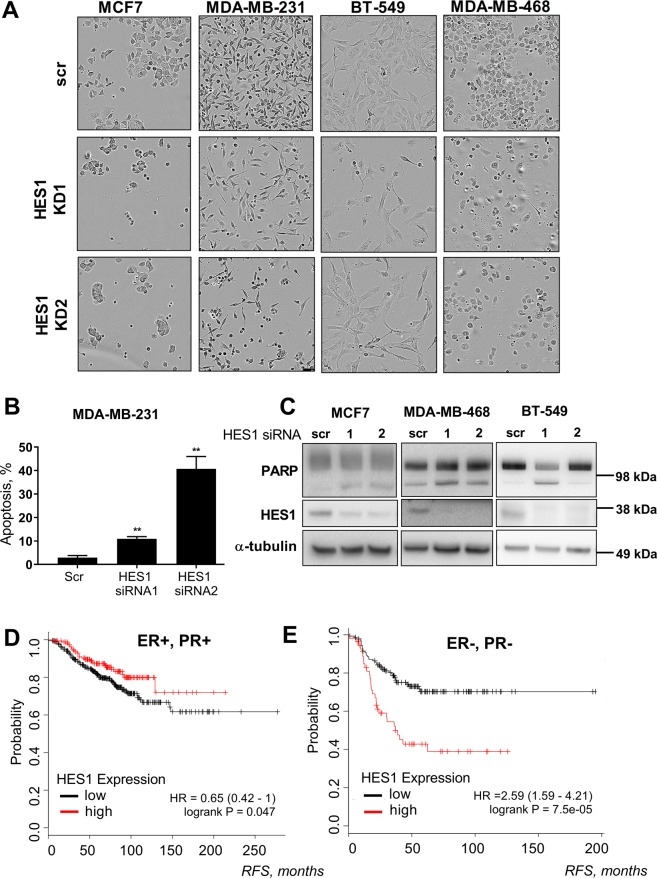
Post-translational modification of intracellular proteins with a single N-acetylglucosamine sugar (O-GlcNAcylation) regulates signaling, proliferation, metabolism and protein stability. In breast cancer, expression of the enzyme that catalyzes O-GlcNAcylation - O-GlcNAc-transferase (OGT), and the extent of protein O-GlcNAcylation, are upregulated in tumor tissue, and correlate with cancer progression. Here we compare the significance of O-GlcNAcylation in a panel of breast cancer cells of different phenotypes. We find a greater dependency on OGT among triple-negative breast cancer (TNBC) cell lines, which respond to OGT inhibition by undergoing cell cycle arrest and apoptosis. Searching for the cause of this response, we evaluate the changes in the proteome that occur after OGT inhibition or knock-down, employing a reverse-phase protein array (RPPA). We identify transcriptional repressor - hairy and enhancer of split-1 (HES1) - as a mediator of the OGT inhibition response in the TNBC cells. Inhibition of OGT as well as the loss of HES1 results in potent cytotoxicity and apoptosis. The study raises a possibility of using OGT inhibition to potentiate DNA damage in the TNBC cells.


Conflict of interest statement

The authors declare no competing interests.

Figures

Figure 1
Figure 1
OGT inhibition is potently cytotoxic in TNBC cell lines. (A) Relative decrease in total protein O-GlcNAcylation, after 4 and 24 hours of treatment with 40 µM OSMI1 in six BC cell lines. Percentage above indicates median decrease compared to the respective DMSO-treated controls, at least 2 independent experiments. (B) Relative viability in BC cell lines after 72 hours of treatment with OSMI1. MTS assay. At least 3 biological replicates for each cell line. Error bars - SEM. TNBC lines marked in black and grey; triple-positive cell lines in red. (C) EC50 and EC20 concentrations of OSMI1, mean from at least three independent experiments for each cell line. (D) OGT transient knock-down in four BC cell lines, representative out of at least three experiments. (E) BC cells pictured after 72 hours of treatment with 20 µM OSMI1, or 5 days of transient OGT knockdown. (F) Apoptotic population in MDA-MB-231 following 3, 4 and 5 days of transient OGT knock-down, TUNEL assay. Error bars - standard deviation, n = at least 2. *p < 0.05; **p < 0.005; ***p < 0.001 unpaired t-test, comparing knock-down samples to the respective scr RNA control samples.
Figure 2
Figure 2
Progesterone receptor inhibitor sensitizes receptor-positive BC cells to OGT inhibition. (A) Relative viability in MCF7 after 72 hours of treatment with Tamoxifen (Tam), OSMI1, or a combination. MTS assay. Error bars - SEM, n = 3. *p < 0.05; **p < 0.005, unpaired t-test, comparing viability after the combination treatment to the viability after treatment with respective dose of tamoxifen. (B,C) Viability in MCF7 and T47D cells following 72 hours of treatment with Mifepristone (MF), OSMI1 or a combination, MTS assay. Error bars - SEM, n = 3. *p < 0.05; **p < 0.005; ***p < 0.001 unpaired t-test, comparing viability after the combination-treatment to the viability after treatment with respective dose of MF. (D) Annexin V apoptosis assay in MCF7 following 72 hours of treatment with MF, OSMI1 or a combination. FITC-/PI- population represents live cells; FITC+ cells are in early apoptosis; FITC+/PI+ cells are in late apoptosis; PI+ cells are necrotic. Error bars - standard deviation, n = 2. (E) Total length and cleaved PARP and γ-H2AX in MCF7 after 72 hours of treatment with MF, OSMI1, or a combination. Representative of two separate experiments. (F) Relative γ-H2AX protein expression in MCF7 following 72 hours of treatment with MF, OSMI1 or a combination. n = 3, error bars - SEM; unpaired t-test, comparing expression after the combination treatments to the expression after respective concentration of MF and OSMI1; *p < 0.05.
Figure 3
Figure 3
OGT inhibition differentially affects proteome and phospho-proteome in MCF7 and MDA-MB-231. (A) Proteins whose expression changed by 28% or more compared to the control samples in MDA-MB-231 following 24 hours of treatment with 20 µM OSMI1, were selected. Corresponding proteins in MCF7 are shown in the same figure. RPPA array, n = 3, error bars - SEM. *p < 0.05; **p < 0.01, unpaired t-test. Significance indicates comparison of the relative protein expression changes in MDA-MB-231 and MCF7. (B) Total O-GlcNAcylation and phospho-PS6 (S235-S326) in MDA-MB-231 and MCF7 following treatment with 20 µM OSMI1 for 24 hours. (C) Phospho-PS6 (S235-S236) in MDA-MB-231 after treatment with 20 µM OSMI1 for 9, 16, 24, 32, 40 and 48 hours. (D) Viability in MCF7 and MDA-MB-231 following 72 hours of treatment with Everolimus (Ev), OSMI1 and the combination. MTS assay, error bars - SEM, n = 3. *p < 0.05, unpaired t-test. (E,F) Cell cycle distribution in MCF7 (E) and MDA-MB-231 (F), after 24 hours of treatment with 20 µM OSMI1. n = 3, error bars - SEM. *p < 0.05; **p < 0.005, unpaired t-test.
Figure 4
Figure 4
HES1 is selectively regulated by OGT in TNBC cells. (A) Relative protein HES1 expression following 24 hours of treatment with 20 µM OSMI1 (upper panel, error bars: SEM, n = 4; **p < 0.005, unpaired t-test) or 72 hours after a transient OGT knock-down (lower panel, error bars: St. dev, n = 2). (B) HES1 in MDA-MB-231 and MCF7 after 24 hours of treatment with 20 µM OSMI1. (C) HES1 protein expression in MDA-MB-231 following 2 hours of treatment with OSMI1, proteasome inhibitor MG-132, DMSO or combinations. Error bars - SEM, n = 3; *p < 0.05, unpaired t-test.
Figure 5
Figure 5
Loss of HES1 affects BC cell viability. (A) BC cells pictured after 72 hours of transient HES1 knock-down. (B) Apoptosis in MDA-MB-231 cells after 4 days of transient HES1 knock-down. Error bars - SEM, n = 3; **p < 0,005, unpaired t-test. (C) Total length and cleaved PARP and HES1 following 3 days of transient HES1 knock-down in MCF7, MDA-MB-468 and BT-549 cell lines. Representative of two biological replicates. (D, E) Relapse-free survival (RFS) in ER-positive, PR-positive (D), and ER-negative and PR-negative (E) breast cancer. Both cohorts excluded the HER-2-amplified BCs and patients that did not receive systemic treatment. Plots built using the online KM-plotter tool.

References

    1. Siegel RL, Miller KD, Jemal A. Cancer Statistics, 2017. CA: a cancer journal for clinicians. 2017;67:7–30. doi: 10.3322/caac.21387. - DOI - PubMed
    1. Vuong D, Simpson PT, Green B, Cummings MC, Lakhani SR. Molecular classification of breast cancer. Virchows Archiv: an international journal of pathology. 2014;465:1–14. doi: 10.1007/s00428-014-1593-7. - DOI - PubMed
    1. Valentin MD, da Silva SD, Privat M, Alaoui-Jamali M, Bignon YJ. Molecular insights on basal-like breast cancer. Breast cancer research and treatment. 2012;134:21–30. doi: 10.1007/s10549-011-1934-z. - DOI - PubMed
    1. Rakha EA, et al. Prognostic markers in triple-negative breast cancer. Cancer. 2007;109:25–32. doi: 10.1002/cncr.22381. - DOI - PubMed
    1. Bertucci F, et al. How basal are triple-negative breast cancers? International journal of cancer. 2008;123:236–240. doi: 10.1002/ijc.23518. - DOI - PubMed

Publication types

MeSH terms

Substances