Review
. 2019 Jul;25(7):2209-2220.
doi: 10.1111/gcb.14642. Epub 2019 May 6.

Rethinking false spring risk

Affiliations
Review

Rethinking false spring risk

Catherine J Chamberlain et al. Glob Chang Biol. 2019 Jul.

Abstract

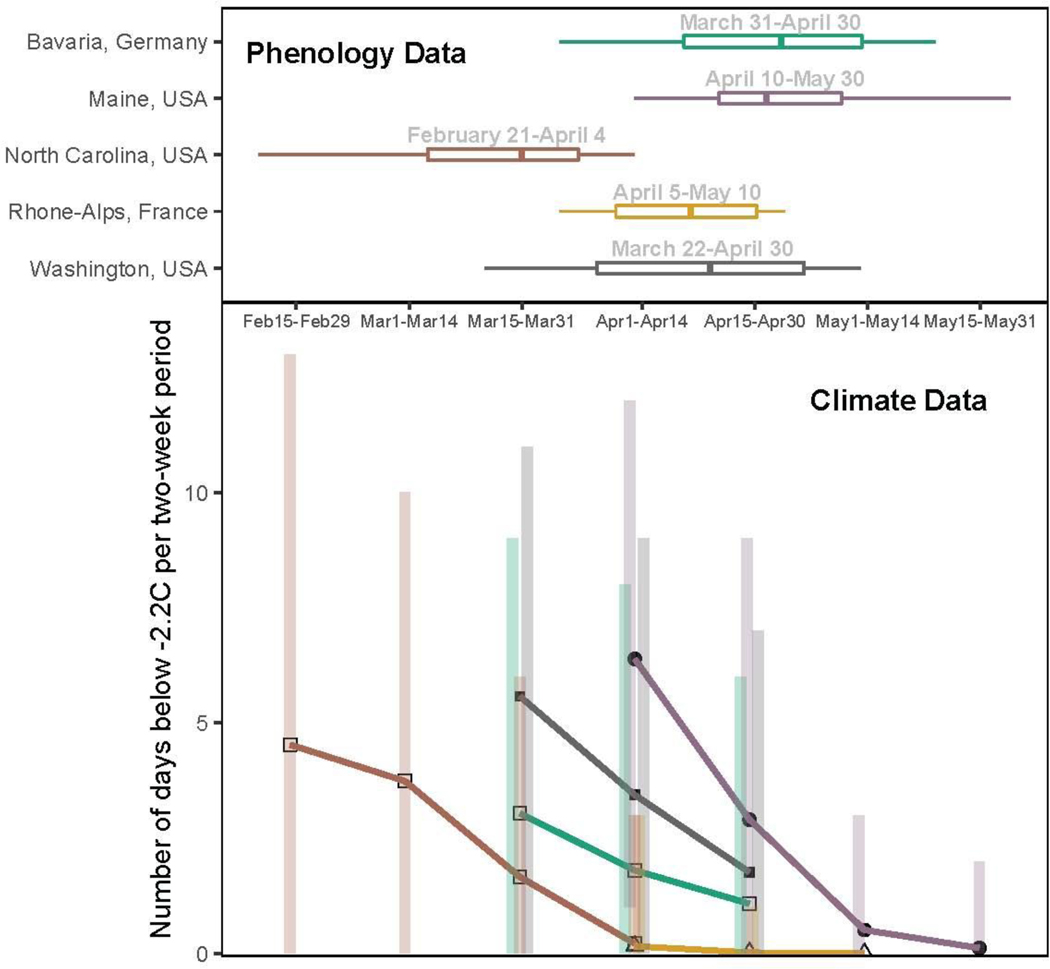
Temperate plants are at risk of being exposed to late spring freezes. These freeze events-often called false springs-are one of the strongest factors determining temperate plants species range limits and can impose high ecological and economic damage. As climate change may alter the prevalence and severity of false springs, our ability to forecast such events has become more critical, and it has led to a growing body of research. Many false spring studies largely simplify the myriad complexities involved in assessing false spring risks and damage. While these studies have helped advance the field and may provide useful estimates at large scales, studies at the individual to community levels must integrate more complexity for accurate predictions of plant damage from late spring freezes. Here, we review current metrics of false spring, and how, when, and where plants are most at risk of freeze damage. We highlight how life stage, functional group, species differences in morphology and phenology, and regional climatic differences contribute to the damage potential of false springs. More studies aimed at understanding relationships among species tolerance and avoidance strategies, climatic regimes, and the environmental cues that underlie spring phenology would improve predictions at all biological levels. An integrated approach to assessing past and future spring freeze damage would provide novel insights into fundamental plant biology and offer more robust predictions as climate change progresses, which are essential for mitigating the adverse ecological and economic effects of false springs.

Keywords: climate change; false spring; forest communities; freezing tolerance; phenology.


Figures

Figure 1:
Figure 1:
A comparison of damaging spring freezing temperature thresholds across ecological and agronomic studies. Each study is listed on the vertical axis along with the taxonomic group of focus. Next to the species name is the freezing definition used within that study (e.g., 100% is 100% whole plant lethality). Each point is the best estimate recorded for the temperature threshold with standard deviation if indicated in the study.
Figure 2:
Figure 2:
False Spring Index (FSI) values from 2008 to 2014 vary across methods. To calculate spring onset, we used the USA-NPN Extended Spring Index tool for the USA-NPN FSI values, which are the circles (USA-NPN, 2016), long-term ground observational data for the observed FSI values, which are the triangles (O’Keefe, 2014), and near-surface remote-sensing canopy data for the PhenoCam FSI values, which are the squares (Richardson, 2015). See the Supplement for extended details. The solid grey line at FSI=0 indicates a boundary between a likely false spring event or not, with positive numbers indicating a false spring likely occurred and negative numbers indicating a false spring most likely did not occur. The dotted grey line at FSI=7 indicates the seven-day threshold frequently used in false spring definitions, which suggests years with FSI values greater than seven very likely had false spring events.
Figure 3:
Figure 3:
Differences in spring phenology and false spring risk across two species: Ilex mucronata (L.) and Betula alleghaniensis (Marsh.). We mapped a hypothetical false spring event based on historical weather data and long-term observational phenological data collected at Harvard Forest (O’Keefe, 2014). In this scenario, Ilex mucronata, which bursts bud early and generally has a short period between budburst (squares) and leafout (triangles), would be exposed to a false spring event during its duration of vegetative risk (i.e., from budburst to leafout), whereas Betula alleghaniensis would avoid it entirely (even though it has a longer duration of vegetative risk), due to later budburst.
Figure 4:
Figure 4:
Effects of phenological cues on the duration of vegetative risk across three species: Acer pensylvanicum, Fagus grandifolia, and Populus grandidentata (see the Supplement for further details). ‘More Forcing’ is a 5°C increase in spring warming temperatures, ‘Shorter Photoperiod’ is a 4-hour decrease in photoperiod and ‘Less Chilling’ is a 30-day decrease in over-winter chilling. Along with the estimated isolated effects, we the show the combined predicted shifts in phenological cues with potential climate change (i.e., more forcing with shorter photoperiod and more forcing with less chilling) and the subsequent shifts in duration of vegetative risk across species. To calculate the combined effects, we added the estimated isolated effects of each cue alone with the interaction effects for the relevant cues for each species.
Figure 5:
Figure 5:
False spring risk can vary dramatically across regions. Here we show the period when plants are most at risk to tissue loss – between budburst and leafout (upper, lines represent the range with the thicker line representing the interquartile range) and the variation in the number of freeze days (−2.2°C) (Schwartz, 1993) that occurred on average over the past 50 years for five different sites (lower, bars represent the range, points represent the mean). Data come from USA-NPN SI-x tool (1981–2016), NDVI and remote-sensing, and observational studies (1950–2016) for phenology (Schaber & Badeck, 2005; Soudani et al., 2012; USA-NPN, 2016; White et al., 2009) and NOAA Climate Data Online tool for climate (from 1950–2016). See the Supplement for further details on methods.

References

    1. Agrawal AA, Conner JK, Stinchcombe JR (2004) Evolution of plant resistance and tolerance to frost damage. Ecology Letters, 7, 1199–1208. 10.1111/j.1461-0248.2004.00680.x. - DOI
    1. Aitken SN, Bemmels JB (2015) Time to get moving: assisted gene flow of forest trees. Evolutionary Applications, 9, 271–290. 10.1111/eva.12293. - DOI - PMC - PubMed
    1. Allstadt AJ, Vavrus SJ, Heglund PJ, Pidgeon AM, Wayne E, Radeloff VC (2015) Spring plant phenology and false springs in the conterminous U. S. during the 21st century. Environmental Research Letters (submitted), 10, 104008. 10.1088/1748-9326/10/10/104008. - DOI
    1. Augspurger CK (2009) Spring 2007 warmth and frost: Phenology, damage and refoliation in a temperate deciduous forest. Functional Ecology, 23, 1031–1039. 10.1111/j.1365-2435.2009.01587.x. - DOI
    1. Augspurger CK (2013) Reconstructing patterns of temperature, phenology, and frost damage over 124 years: Spring damage risk is increasing. Ecology, 94, 41–50. 10.1890/12-0200.1. - DOI - PubMed

Publication types