. 2019 Apr 24;8(4):281-291.e9.
doi: 10.1016/j.cels.2018.11.005. Epub 2019 Apr 3.

Scrublet: Computational Identification of Cell Doublets in Single-Cell Transcriptomic Data

Affiliations

Scrublet: Computational Identification of Cell Doublets in Single-Cell Transcriptomic Data

Samuel L Wolock et al. Cell Syst. .

Abstract

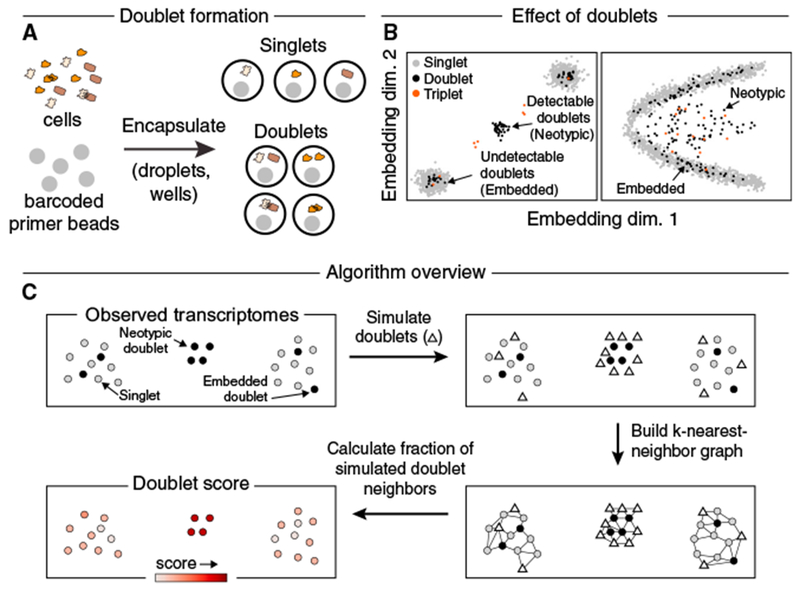
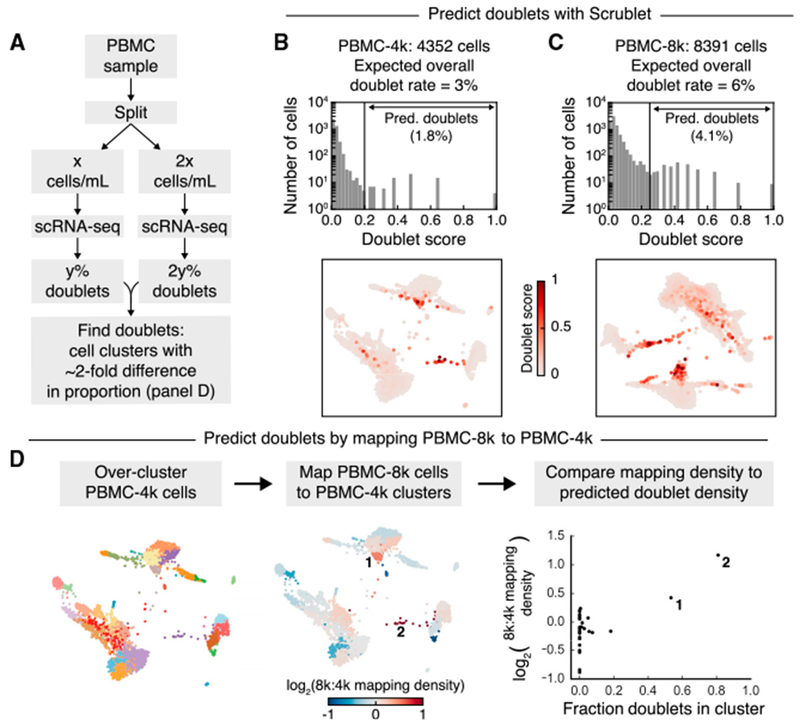
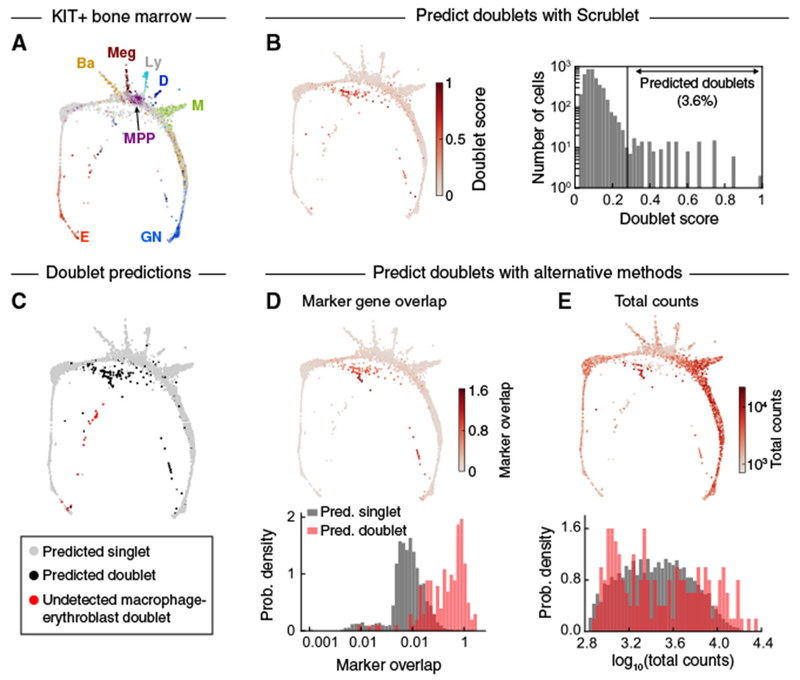
Single-cell RNA-sequencing has become a widely used, powerful approach for studying cell populations. However, these methods often generate multiplet artifacts, where two or more cells receive the same barcode, resulting in a hybrid transcriptome. In most experiments, multiplets account for several percent of transcriptomes and can confound downstream data analysis. Here, we present Single-Cell Remover of Doublets (Scrublet), a framework for predicting the impact of multiplets in a given analysis and identifying problematic multiplets. Scrublet avoids the need for expert knowledge or cell clustering by simulating multiplets from the data and building a nearest neighbor classifier. To demonstrate the utility of this approach, we test Scrublet on several datasets that include independent knowledge of cell multiplets. Scrublet is freely available for download at github.com/AllonKleinLab/scrublet.

Keywords: RNA-seq; artifact detection; bioinformatics; cell doublets; decoy classifier; high dimensional data analysis; single-cell.


Conflict of interest statement

DECLARATION OF INTERESTS

A.M.K. is a co-founder of 1Cell-Bio.

Figures

Figure 1.
Figure 1.. A Computational Approach for Identifying Doublets in Single-Cell RNA-Seq Data
(A) Schematic of doublet formation. Multiple cells are co-encapsulated with a single barcoded bead, either randomly or as aggregates, resulting in the generation of a hybrid transcriptome. (B) Multiplets involving highly similar cells (“embedded”) may be difficult to distinguish from single cells, while multiplets of dissimilar cells (“neotypic”) generate qualitatively new features, such as distinct clusters (left) or bridges (right). (C) Overview of the Scrublet algorithm. Doublets are simulated by randomly sampling and combining observed transcriptomes, and the local density of simulated doublets, as measured by a nearest neighbor graph, is used to calculate a doublet score for each observed transcriptome.
Figure 2.
Figure 2.. Application of Scrublet to Simulated Data
(A) Schematic summary of simulations for testing Scrublet. d, inter-clustervariance; σ, intra-clustervariance; n1, size of larger cluster; n2, size of smaller cluster; h, inter-branch variance. See STAR Methods for full simulation details. (B) Evaluation of doublet detector performance for varying numbers of clusters and cluster separation. After thresholding doublet scores based on the simulated doublet rate (5%), the recall (true positive rate) was measured using all doublets (left) or between-cluster doublets only (right). Points and error bars are the mean and standard deviation of 10 independent simulations, respectively. (C) Evaluation of doublet detector performance for two clusters with varying degrees of cluster size asymmetry. Panels and error bars as in (B). (D) Evaluation of doublet detector performance for a branching continuum with varying degrees of separation between the two branch endpoints. Recall was measured for all doublets (left) and when limiting to doublets formed by cells from opposite branches (right). Error bars as in (B). (E) Prediction of the detectable doublet fraction, ϕD, using the distribution of scores for the synthetic doublets. (F) Comparison of predicted ϕD to observed doublet recall for the simulations in (B).
Figure 3.
Figure 3.. Doublet Prediction for a Mixture of Human and Mouse Cells
(A) Schematic overview of species mixing experiment. (B) Identification of mixed-species doublets based on fraction of reads mapping to human or mouse transcriptome. (C) Principal-component (PC) analysis of single-cell transcriptomes, restricting to human-mouse gene orthologs. (D) Histogram of doublet scores for simulated doublets. The bimodal distribution reflects the two types of doublets: undetectable intra-species embedded doublets (left peak) and inter-species neotypic doublets (right peak). (E) Histograms of doublet scores for observed singlets (gray) and doublets (red). See also Figure S2. (F) Receiver-operator characteristic (ROC) curve for Scrublet and total transcript counts as predictors of inter-species doublets. AUC, area under the curve.
Figure 4.
Figure 4.. Doublet Prediction for Blood Cells from Eight Genotyped Human Donors
(A) Schematic overview of genotyped cell mixing experiment. (B) Force-directed graph layout of the profiled cells. Black points indicate ground truth doublets identified by Demuxlet as barcodes associated with polymorphisms from more than one individual (Kang et al., 2018). (C) Force-directed graph layout of ground truth doublet score, defined as the fraction of a cell’s neighbors that are mixed genotyped doublets. (D) Application of Scrublet to the transcriptomic data. After calculating doublet scores (i), the histogram of scores for simulated doublets was used to determine a threshold for detection of neotypic doublets (ii). Applying this threshold to observed cell barcodes (iii) yielded doublet predictions for each transcriptome (iv). ϕD, predicted detectable doublet rate. See also Figure S3. (E) Comparison of Scrublet to the ground truth doublet score, colored by genotype-based doublet labels (singlets, gray; doublets, black). (F) Comparison of detectable doublet fraction (solid black line) and actual recall (dashed black line) for a range of doublet scorethresholds and the corresponding precision (red line). TP, true positive; FN, false negative; FP, false positive. (G) Alternative doublet prediction based on co-expression of marker genes of distinct cell types. Upper: force-directed graph layout with cells colored by marker overlap score. Lower: histograms of marker overlap score for ground truth singlets (gray) and doublets (red). (H) Alternative doublet prediction based total transcript counts. Upper: force-directed graph layout with cells colored by total counts. Lower: histograms of total counts for ground truth singlets (gray) and doublets (red). (I) ROC curves (upper) and AUC scores (lower) for various doublet prediction methods. “S+TC” and “S+Local TC” are linear combinations of the Scrublet score and total counts or the Scrublet score and total counts relative to neighboring cells, respectively (see STAR Methods for details).
Figure 5.
Figure 5.. Doublet Prediction Using Multiple Concentrations of Blood Cells
(A) Schematic overview of how multiple concentrations of the same cell sample can be used to identify doublet-specific states. (B) Scrublet score histogram (upper) and force-directed graph layout (lower) for the low cell concentration (PBMC-4k) sample. See also Figure S4. (C) Same as (B), but for the high cell concentration (PBMC-8k) sample. See also Figure S4. (D) Comparison of cluster sizes in PBMC-4k and PBMC-8k samples to identify doublet-specific clusters, which are expected to be disproportionately larger in the PBMC-8k data. After clustering the PBMC-4k cells (left), each PBMC-8k cell was mapped to its most similar PBMC-4k cell, and the proportions of cells from each sample in each cluster were compared (center). This relative cluster abundance was then compared to the Scrublet predictions (right).
Figure 6.
Figure 6.. Prediction of Doublets in a Continuum of Differentiating Hematopoietic Progenitors
(A) Force-directed graph layout of KIT+ mouse bone marrow cells profiled by scRNA-seq. Cells are colored by expression of established marker genes. E, erythroid; Ba, basophil/mast cell; Meg, megakaryocyte; MPP, multipotent progenitor; Ly, lymphoid; D, dendritic cell; M, monocyte; GN, granulocytic neutrophil. Adapted from Tusi et al., 2018. (B) Force-directed graph layout colored by Scrublet score (left) and histogram of Scrublet scores (right). See also Figure S5. (C) Predicted doublets localized on force-directed graph layout. Gray, predicted singlets; black, Scrublet-predicted doublets; red, likely erythroblast-macrophage doublets (C1qa+ Hba-a1+), undetected by Scrublet due to absence of macrophage singlets in the KIT+ data. (D) Alternative doublet prediction based on coexpression of marker genes of distinct cell types. Upper: force-directed graph layout with cells colored by marker overlap score. Lower: histograms of marker overlap score for Scrublet-predicted singlets (gray) and doublets (red). (E) Alternative doublet prediction based on total transcript counts. Upper: force-directed graph layout with cells colored by total counts. Lower: histograms of total counts score for Scrublet-predicted singlets (gray) and doublets (red).

References

    1. Adamson B, Norman TM, Jost M, Cho MY, Nunez JK, Chen Y, Villalta JE, Gilbert LA, Horlbeck MA, Hein MY, et al. (2016). A multi-plexed single-cell CRISPR screening platform enables systematic dissection of the unfolded protein response. Cell 167, 1867–1882.e21. - PMC - PubMed
    1. Benjamini Y, and Hochberg Y (1995). Controlling the false discovery rate: a practical and powerful approach to multiple testing. J. R. Stat. Soc. B (Methodol.) 57, 289–300.
    1. Bernhardsson E (2013). Annoy: approximate nearest neighbors in C++/Python optimized for memory usage and loading/saving to disk (2013).
    1. Blondel VD, Guillaume J-L, Lambiotte R, and Lefebvre E (2008). Fast un-folding of communities in large networks. J. Stat. Mech. Theory Exp
    1. Cao J, Packer JS, Ramani V, Cusanovich DA, Huynh C, Daza R, Qiu X, Lee C, Furlan SN, Steemers FJ, et al. (2017). Comprehensive single-cell transcriptional profiling of a multicellularorganism. Science 857, 661–667. - PMC - PubMed

Publication types

LinkOut - more resources