. 2019 Apr 8;7(1):50.
doi: 10.1186/s40168-019-0666-x.

Characterization of the total and viable bacterial and fungal communities associated with the International Space Station surfaces

Affiliations

Characterization of the total and viable bacterial and fungal communities associated with the International Space Station surfaces

Aleksandra Checinska Sielaff et al. Microbiome. .

Abstract

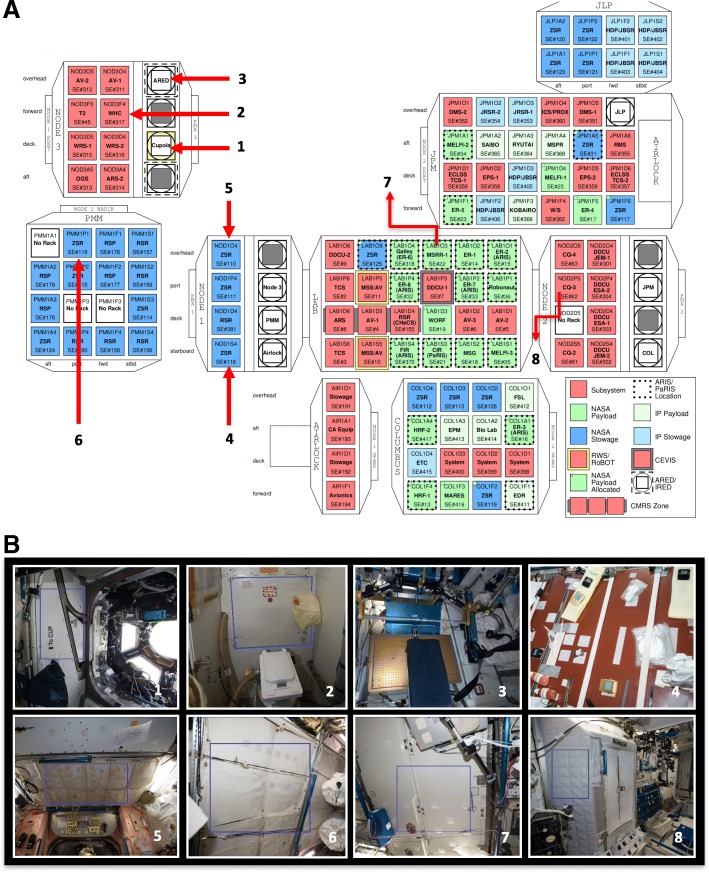
Background: The International Space Station (ISS) is a closed system inhabited by microorganisms originating from life support systems, cargo, and crew that are exposed to unique selective pressures such as microgravity. To date, mandatory microbial monitoring and observational studies of spacecraft and space stations have been conducted by traditional culture methods, although it is known that many microbes cannot be cultured with standard techniques. To fully appreciate the true number and diversity of microbes that survive in the ISS, molecular and culture-based methods were used to assess microbial communities on ISS surfaces. Samples were taken at eight pre-defined locations during three flight missions spanning 14 months and analyzed upon return to Earth.

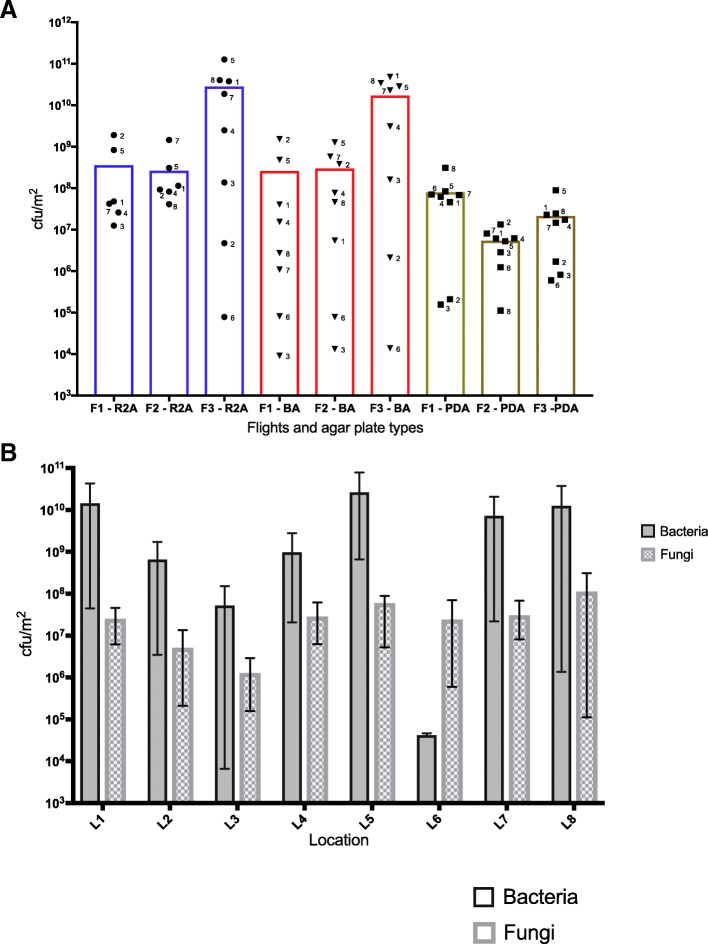
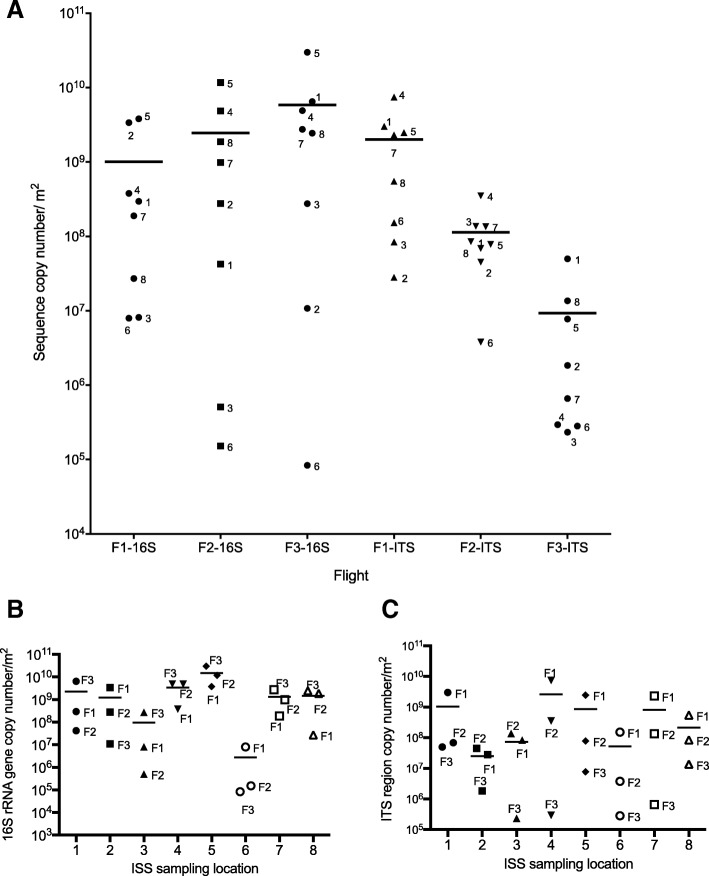
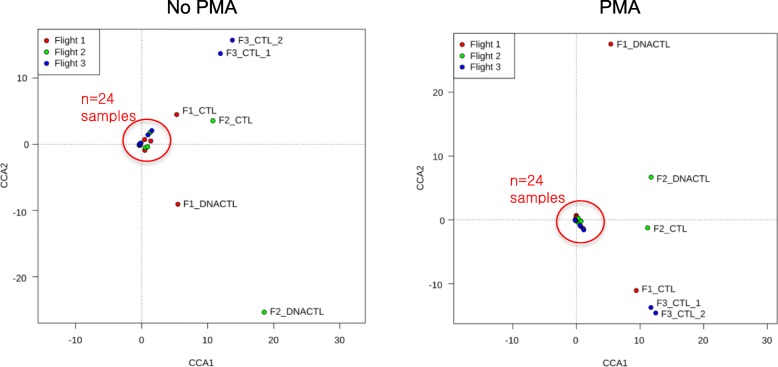
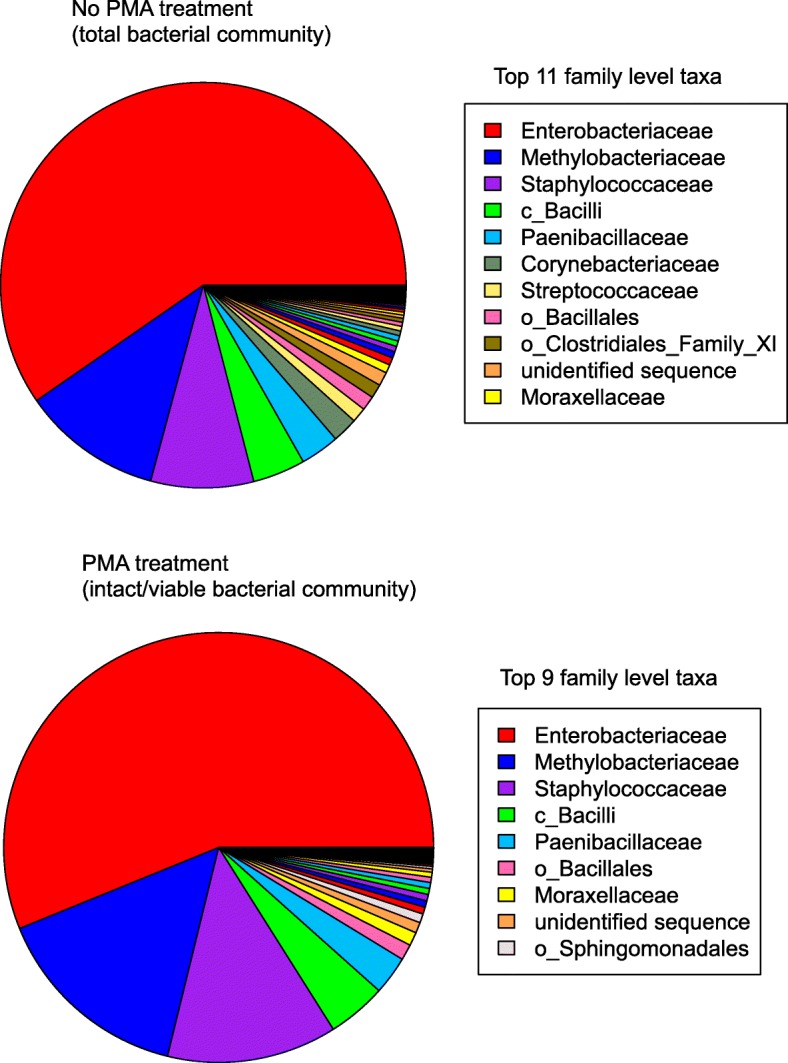
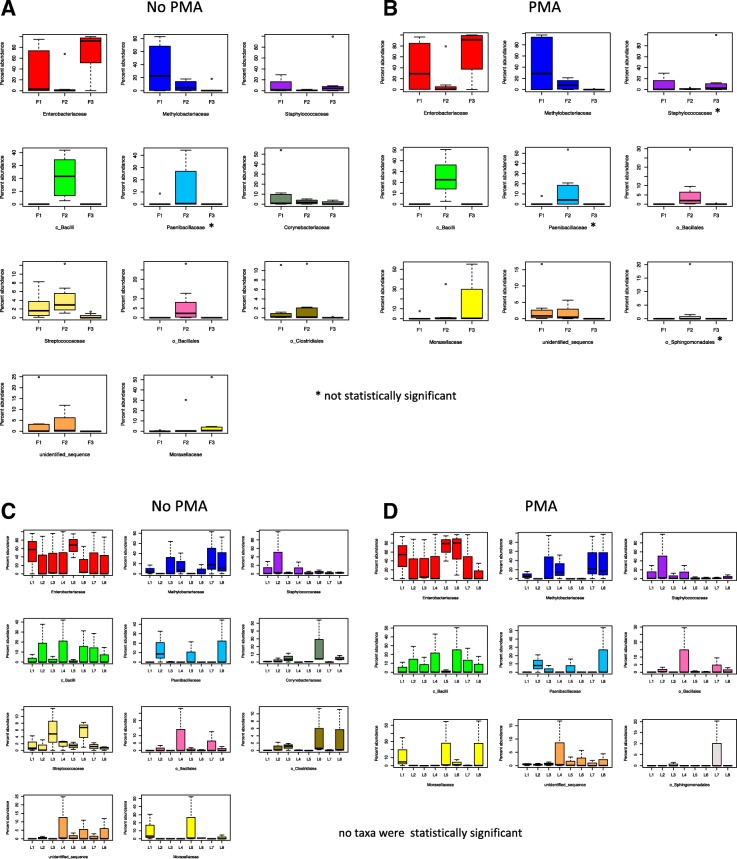
Results: The cultivable bacterial and fungal population ranged from 104 to 109 CFU/m2 depending on location and consisted of various bacterial (Actinobacteria, Firmicutes, and Proteobacteria) and fungal (Ascomycota and Basidiomycota) phyla. Amplicon sequencing detected more bacterial phyla when compared to the culture-based analyses, but both methods identified similar numbers of fungal phyla. Changes in bacterial and fungal load (by culture and qPCR) were observed over time but not across locations. Bacterial community composition changed over time, but not across locations, while fungal community remained the same between samplings and locations. There were no significant differences in community composition and richness after propidium monoazide sample treatment, suggesting that the analyzed DNA was extracted from intact/viable organisms. Moreover, approximately 46% of intact/viable bacteria and 40% of intact/viable fungi could be cultured.

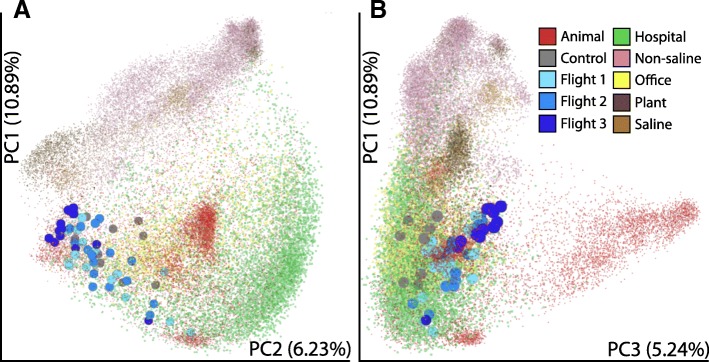
Conclusions: The results reveal a diverse population of bacteria and fungi on ISS environmental surfaces that changed over time but remained similar between locations. The dominant organisms are associated with the human microbiome and may include opportunistic pathogens. This study provides the first comprehensive catalog of both total and intact/viable bacteria and fungi found on surfaces in closed space systems and can be used to help develop safety measures that meet NASA requirements for deep space human habitation. The results of this study can have significant impact on our understanding of other confined built environments on the Earth such as clean rooms used in the pharmaceutical and medical industries.

Keywords: 16S rRNA; Built microbiome; Environmental surface; ITS; International Space Station; Microbial diversity; Microbiome; Propidium monoazide.


Conflict of interest statement

Ethics approval and consent to participate

No human subjects were analyzed and only environmental samples were collected.

Consent for publication

All authors participated in this study and given their consent for publishing the results.

Competing interests

The authors declare that they have no competing interests.

Publisher’s Note

Springer Nature remains neutral with regard to jurisdictional claims in published maps and institutional affiliations.

Figures

Fig. 1
Fig. 1
Illustration of the eight locations sampled on the ISS over three flight sampling sessions. a Schematic of the US module of the ISS depicting various nodes and modules. The red arrows point to locations sampled during this study. b Detailed images of the sampled area at each location as outlined by blue lines. Location #1, port panel next to cupola (Node 3); location #2, waste and hygiene compartment (node 3); location #3, advanced resistive exercise device (ARED) foot platform (node 3); location #4, dining table (node 1); location #5, zero G stowage rack (node 1); location #6, permanent multipurpose module (PMM) port 1 (PMM); location #7, panel near portable water dispenser (LAB); and location #8, port crew quarters, bump out exterior aft wall (node 2)
Fig. 2
Fig. 2
Cultivable bacterial and fungal burden from eight locations on the ISS over a 14-month period. a Scatter plot representing the CFU/m2 of bacteria and fungi at each location across three flight sampling events. Each column represents a Flight and the type of medium the samples were plated on. Each symbol in that column represents a location sampled during that Flight (N = 8). The colored boxes represent the different types of plates the samples were cultured on: Reasoner’s 2A (R2A) or blood agar (BA) plates to isolate bacteria and potato dextrose agar (PDA) plates to isolate fungi. The height of the colored box indicates the average CFU/m2 for samples in that group. F1 = flight 1 sampling session, F2 = flight 2 sampling session, and F3 = flight 3 sampling session. NB: There was no growth on R2A plates from location 6 sampled during F1 and F2 and from location 3 sampled during F2. b Bar graph representing the CFU/m2 based on location. The number of bacteria isolated on R2A and BA plates were averaged to obtain a number for “Bacteria.” The bars represent the average CFU/m2 at each location with the capped lines showing the lowest and highest value in that group (N = 3). The differences in averages observed in (a, b) were not statistically significantly different (Kruskal-Wallis test followed by Dunn’s post-hoc test P > 0.05). The average number of bacteria and fungi found at each location were similar
Fig. 3
Fig. 3
Intact cell membrane/viable bacterial and fungal population aboard the ISS as estimated by PMA-qPCR. a Scatter plot comparing the 16S rRNA gene (bacteria) and ITS region (fungi) copy numbers of PMA treated samples collected during flights 1, 2, and 3. Each column represents a single flight and each symbol in a column (labeled with a number) represents one of the eight locations sampled during that flight. The horizontal line in each column represents the average gene copy number/m2 for each Flight. b Scatter plot comparing 16S rRNA gene and c ITS region (fungi) copy numbers across locations. Each column “L” followed by a number represents a location and each dot in a column represents the flight it was sampled from. The horizontal line in each column represents the average copy number/m2 at that location. NB: The 16S rRNA gene copy number was not adjusted to the average number per bacterial genome. Control samples were measured and found to be at the level of 102 16S rRNA gene copies per μL. Even when the initial template volume was increased to 10 μL, the expected 20-fold increase in the gene copy numbers was not observed. In panel a, F1-ITS was statistically significantly higher than F3-ITS (P < 0.05). No statistically significant differences were observed in panel b (P > 0.05). The statistical test was performed with the Kruskal-Wallis test followed by Dunn’s post-hoc test
Fig. 4
Fig. 4
Assessment of bacterial contamination in the ISS environmental samples. Canonical correspondence analysis (CCA) highlighting the differences among species constituents found in samples, treated or untreated with PMA, that were collected from the International Space Station (Flights 1–3) and controls. “DNACTL” represents the DNA extraction control (molecular grade water extracted instead of a sample) and “CTL” represents cloth wipes that were exposed to the environment but not used to sample a surface. F1, F2, F3 denotes the flight
Fig. 5
Fig. 5
Pie chart showing the relative abundances of taxa identified on the ISS. 16S rRNA gene sequencing was performed on 24 wipes, taken from 8 locations throughout the ISS (see Fig. 1) during 3 flight sampling sessions, spanning 14 months. For each sample, half was treated with PMA (N = 24) to detect intact/viable bacteria, while the remaining half was left untreated (N = 24) to determine the total bacterial community (both dead cells/cells with a compromised cell membrane and intact/viable). The sequences obtained from both the untreated and PMA-treated samples were summarized to the family level and the relative abundances depicted in this pie chart. In total, 68 different family level taxa were detected but only the most relatively abundant taxa are listed in the legend. A full list of organisms detected can be found in Dataset S1. Those sequences that could not be resolved to the family level are prefixed with either “o” for Order or “c” for Class
Fig. 6
Fig. 6
Temporal and spatial distribution of the ISS microbiome over 14 months and across eight locations. Boxplots show the temporal (a, b) and spatial (c, d) distribution of the most relatively abundant family level taxa (as presented in Fig. 4). The box in each graph signifies the 75% (upper) and 25% (lower) quartiles and thus shows the percent abundances for 50% of the samples (N = 8). The black line inside the box represents the median. The bottom whisker represents the lowest datum still within the 1.5 interquartile range (IQR) of the lower quartile, with the top whisker representing the highest datum still within the 1.5 IQR of the upper quartile. Open circles are outliers. “o” and “c” represent sequences that could not be taxonomically assigned past the order or class level respectively. “F” indicates Flight and “L” indicates Location. a Temporal distribution over time in untreated samples. All taxa showed statistically significant changes over time except Paenibacillaceae (denoted by *). b Temporal distribution in PMA-treated samples. Taxa showed statistically significant changes over time except Paenibacillacae, Staphylococcaceae, and o_Sphingomondales (denoted by *). Spatial distribution in untreated samples (c) and in PMA treated samples (d). There were no statistically significant differences in these taxa across the eight locations. Significance was measured using ALDEx2 and based on the Benjamini-Hochberg corrected P value of the Kruskal-Wallis test (significance threshold, P < 0.05). Those sequences that could not be resolved to the family level are prefixed with either “o” for Order or “c” for Class
Fig. 7
Fig. 7
Comparison of ISS environmental microbiome with microbiomes of Earth. Principal coordinates analysis of unweighted UniFrac distances from the Earth Microbiome Project [96], the Hospital Microbiome Project ([5], Qiita study 10,172), and the Office Succession Study [105] depicting a PC1 vs. PC2 and b PC1 vs. PC3. The Hospital Microbiome Project and Office Succession Study are composed predominantly built environment samples (e.g., walls, floors, etc.). All three ISS flight sample sets group with the built environment samples. The primary separation along PC1 is environmental or plant associated samples vs. animal surface, secretion, or built environment. The primary separation along PC3 is whether a sample is associated with the animal gut

References

    1. Yamaguchi N, Roberts M, Castro S, Oubre C, Makimura K, Leys N, Grohmann E, Sugita T, Ichijo T, Nasu M. Microbial monitoring of crewed habitats in space-current status and future perspectives. Microbes Environ. 2014;29(3):250–260. doi: 10.1264/jsme2.ME14031. - DOI - PMC - PubMed
    1. Checinska A, Probst AJ, Vaishampayan P, White JR, Kumar D, Stepanov VG, Fox GE, Nilsson HR, Pierson DL, Perry J, et al. Microbiomes of the dust particles collected from the International Space Station and Spacecraft Assembly Facilities. Microbiome. 2015;3:50. doi: 10.1186/s40168-015-0116-3. - DOI - PMC - PubMed
    1. NASA: MR050L microbial analysis of ISS surfaces using the surface sampler kit (SSK) in. Edited by JSC28913 MRIDM. Houston, TX: NASA; 2005.
    1. Pace NR. Mapping the tree of life: progress and prospects. Microbiol Mol Biol Rev. 2009;73(4):565–576. doi: 10.1128/MMBR.00033-09. - DOI - PMC - PubMed
    1. Lax S, Sangwan N, Smith D, Larsen P, Handley KM, Richardson M, Guyton K, Krezalek M, Shogan BD, Defazio J, et al. Bacterial colonization and succession in a newly opened hospital. Sci Transl Med. 2017;9(391) 10.1126/scitranslmed.aah6500. - PMC - PubMed

Publication types