. 2019 Apr 18;177(3):556-571.e16.
doi: 10.1016/j.cell.2019.02.005. Epub 2019 Apr 4.

Unleashing Type-2 Dendritic Cells to Drive Protective Antitumor CD4+ T Cell Immunity

Affiliations

Unleashing Type-2 Dendritic Cells to Drive Protective Antitumor CD4+ T Cell Immunity

Mikhail Binnewies et al. Cell. .

Abstract

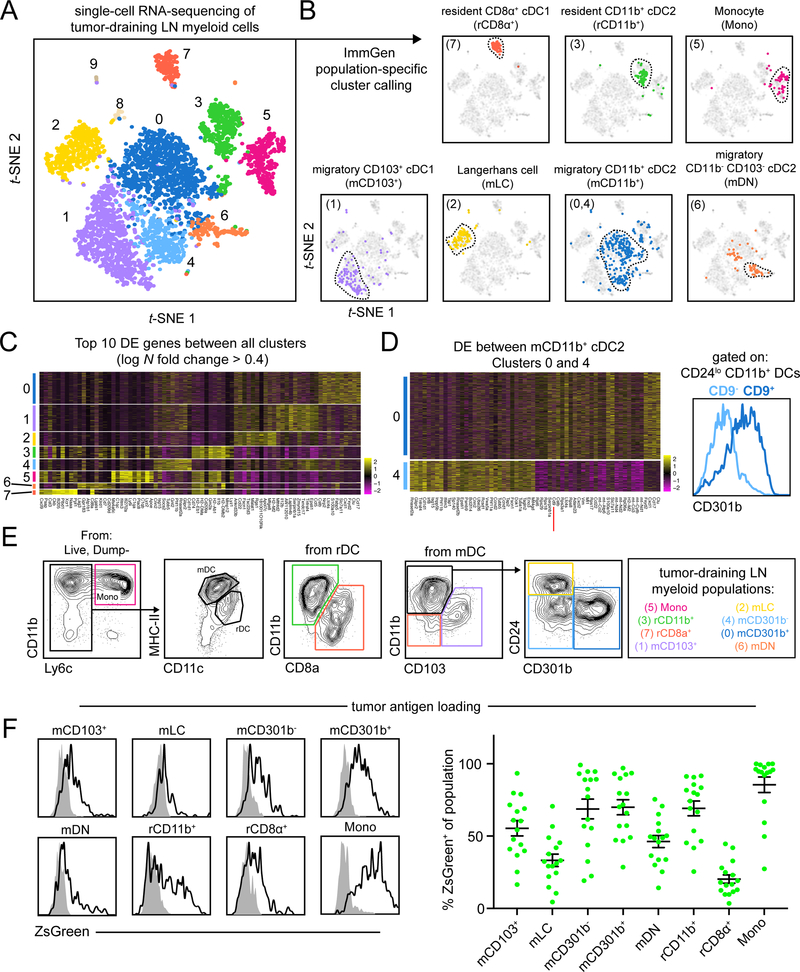
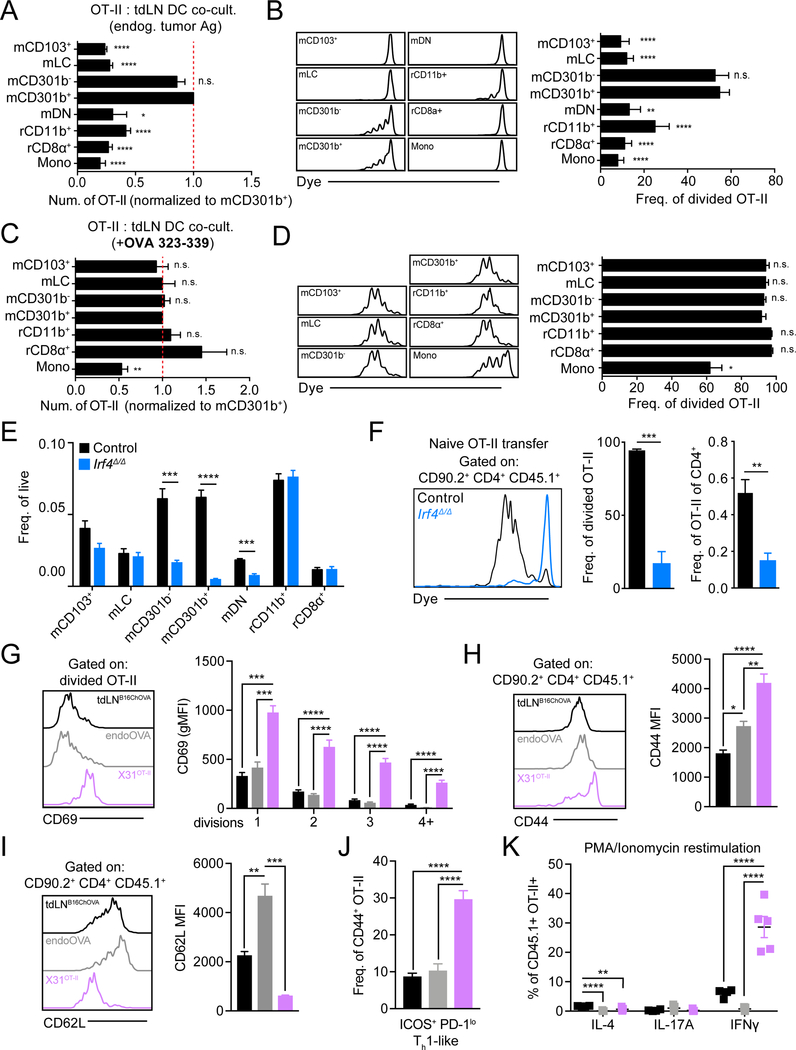
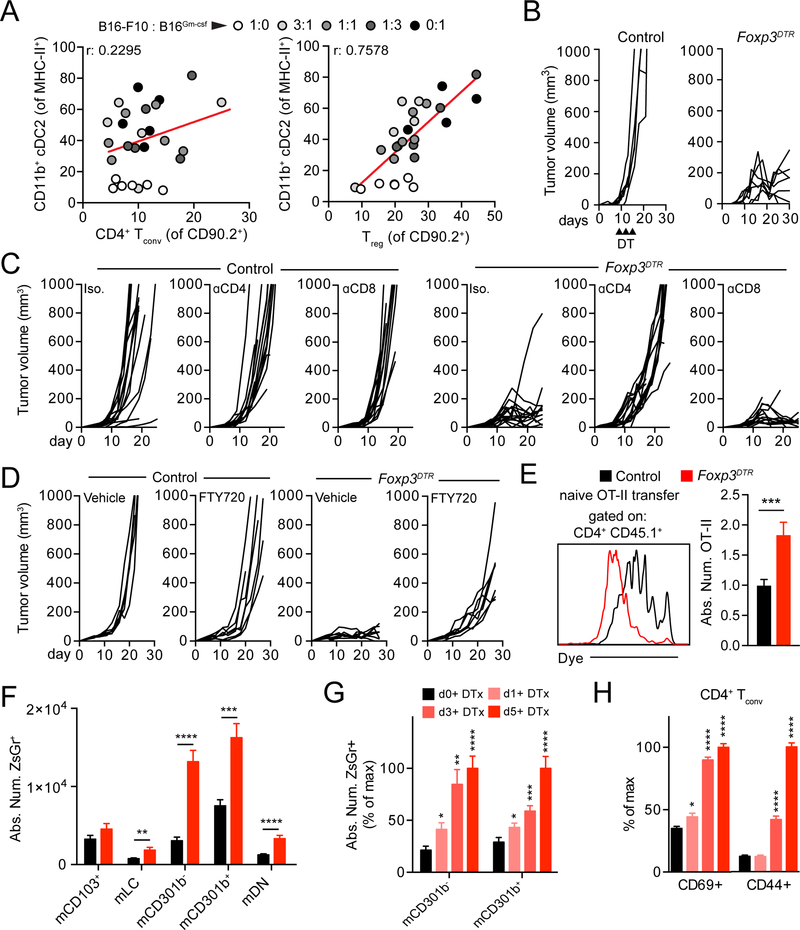
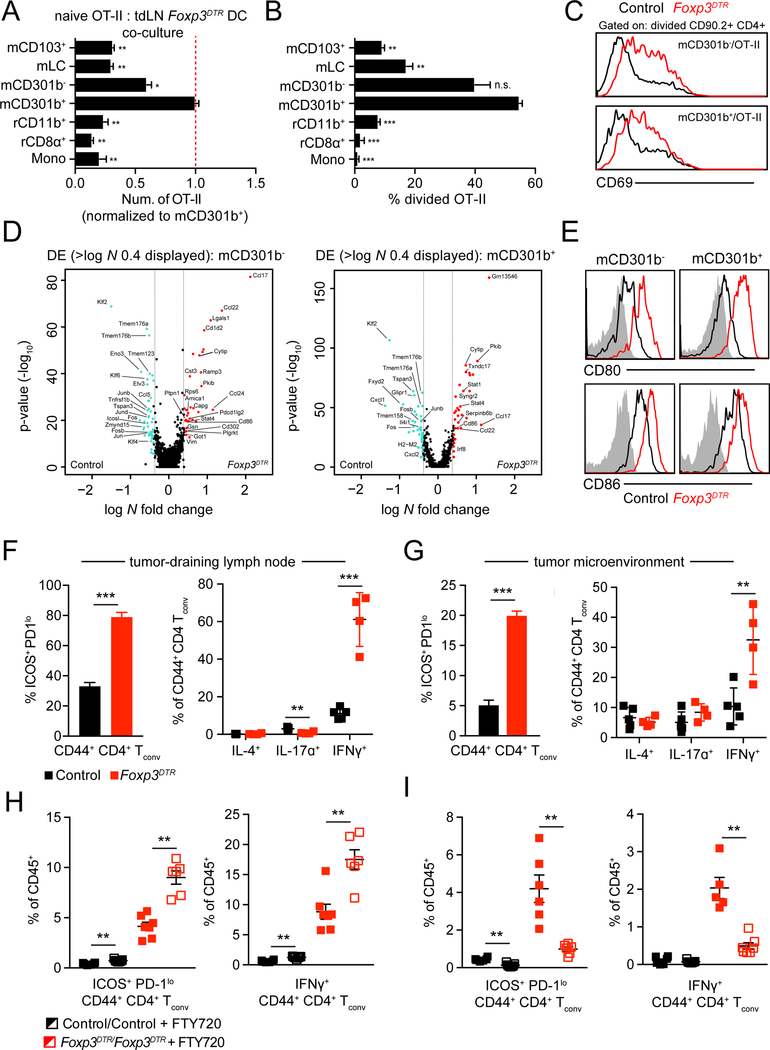
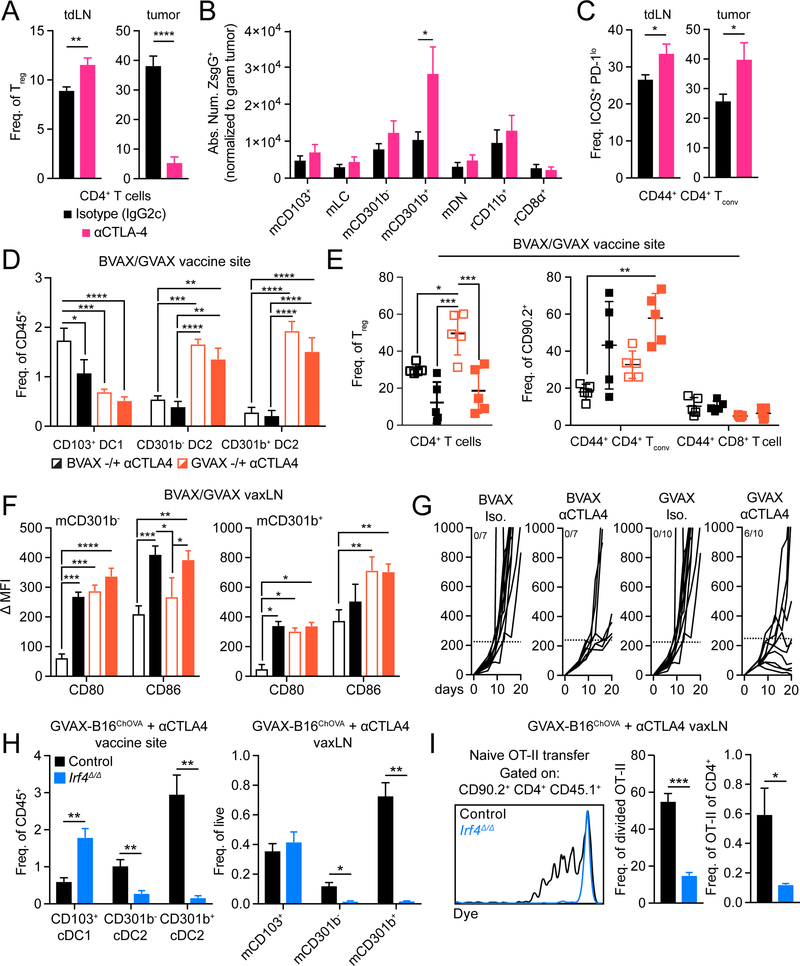
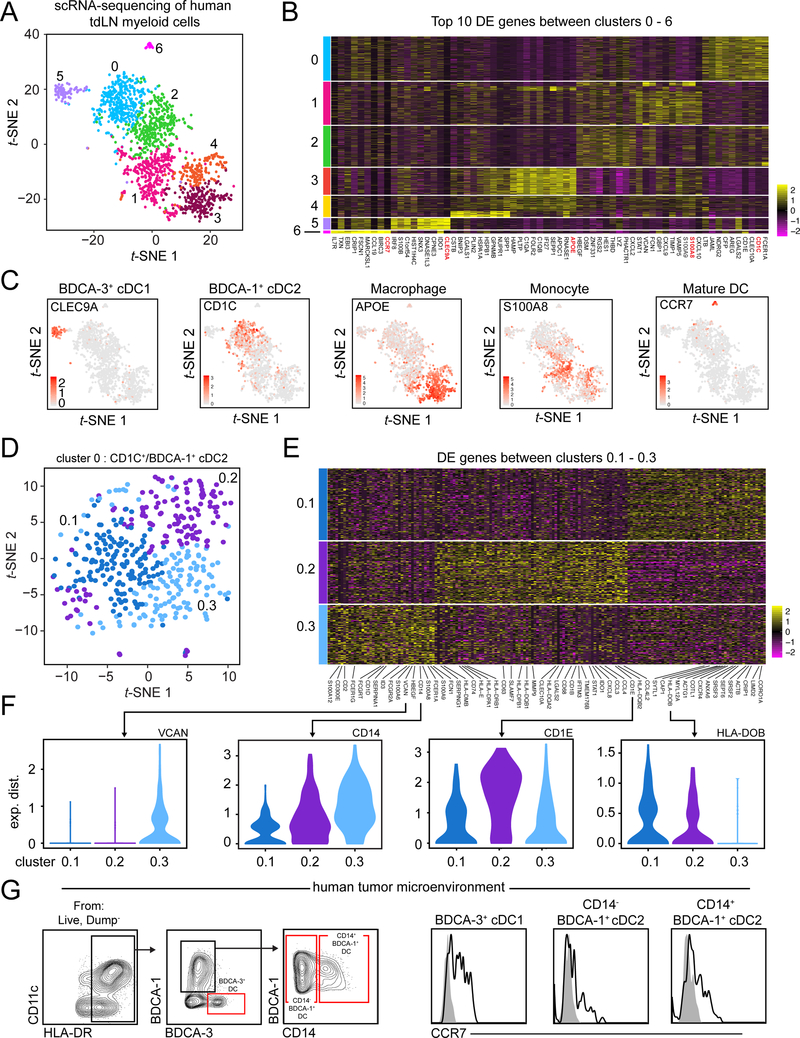
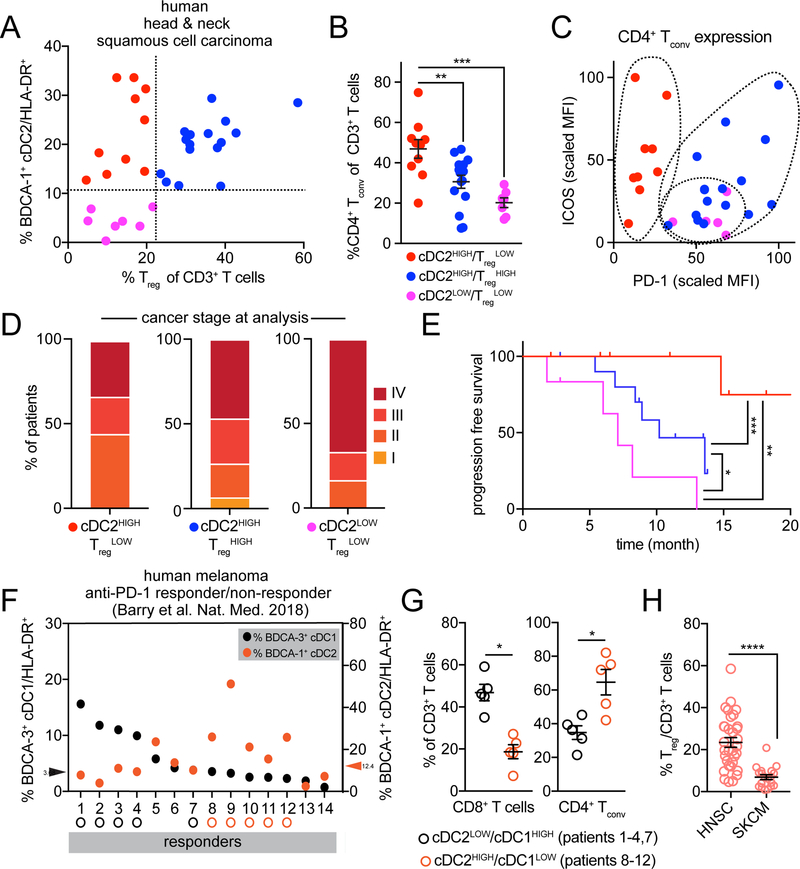
Differentiation of proinflammatory CD4+ conventional T cells (Tconv) is critical for productive antitumor responses yet their elicitation remains poorly understood. We comprehensively characterized myeloid cells in tumor draining lymph nodes (tdLN) of mice and identified two subsets of conventional type-2 dendritic cells (cDC2) that traffic from tumor to tdLN and present tumor-derived antigens to CD4+ Tconv, but then fail to support antitumor CD4+ Tconv differentiation. Regulatory T cell (Treg) depletion enhanced their capacity to elicit strong CD4+ Tconv responses and ensuing antitumor protection. Analogous cDC2 populations were identified in patients, and as in mice, their abundance relative to Treg predicts protective ICOS+ PD-1lo CD4+ Tconv phenotypes and survival. Further, in melanoma patients with low Treg abundance, intratumoral cDC2 density alone correlates with abundant CD4+ Tconv and with responsiveness to anti-PD-1 therapy. Together, this highlights a pathway that restrains cDC2 and whose reversal enhances CD4+ Tconv abundance and controls tumor growth.

Keywords: CD4(+) T cells; T cell priming; checkpoint blockade; dendritic cells; immunotherapy; regulatory T cells; tumor immunology; tumor microenvironment.


Figures

Figure 1
Figure 1
Unbiased scRNA-seq of myeloid cells in the tdLN reveals extensive heterogeneity. (A) t-SNE display and graph-based clustering of CD90.2 B220 NK1.1 CD11b+ and/or CD11c+ myeloid cells sorted from B16F10 tdLN and processed for scRNA-seq. Each dot represents a single cell. (B) Expression of ImmGen population-specific gene signatures distributed across t-SNE plot of (A). (C) Heatmap displaying top 10 DE genes for each cluster when comparing clusters 0 through 7 (ranked by fold change) (D) (left) A heatmap displaying the top 30 DE genes between clusters 0 and 4, with Cd9 highlighted by a red line. (right) A flow cytometry histogram displaying the differential surface expression of CD301b between CD9 and CD9+ CD11b+ CD24 DCs (E) Representative gating strategy used to identify myeloid populations in the tdLN (F) Representative flow cytometry histograms displaying levels of ZsGreen tumor antigen within myeloid populations in the tdLN (left). Frequency of ZsGreen+ cells within t dLN myeloid populations (right). Data pooled from two independent experiments. Figure 2
Figure 2
Figure 2
mCD301b−/+ cDC2 are uniquely able to induce anti-tumor CD4+ Tconv proliferation but fail to initiate CD4+ Tconv differentiation. (A-D) Purified CD4+ OT-II T cells were co-cultured ex vivo with sorted APC populations from tdLN and analyzed at 3 days. (A) Absolute number of live OT-II T cells recovered from co-culture, normalized and statistically compared to mCD301b+ condition (t-test). (B) Histograms of OT-II T cell dye dilution (left). Frequency of recovered OT-II T cells that had undergone division with statistical comparison to mCD301b+ condition (t-test) (right). (C) Absolute number of live OT-II T cells recovered from co-culture containing exogenous OVA peptide (323–339), normalized and statistically compared to mCD301b+ condition (t-test). (D) Histograms of OT-II T cell dye dilution (left). Frequency of recovered OT-II T cells that had undergone division with statistical comparison to mCD301b+ condition (t-test) (right). (E) Frequency of tdLN DC populations in control or Irf4−/− tumor-bearing mice. (F) Purified CD45.1+ OT-II T cells were adoptively transferred to control or Irf4−/− B16ChOVA tumor-bearing mice with tdLN harvested 3 days later to assess OT-II T cell dye dilution (left) and quantify the frequency of cells that had divided (middle) and their frequency of endogenous CD4+ T cells (right). (G-K) CD45.1+ CD4+ OT-II T cells were transferred to wild-type mice that were inoculated with B16chOVA (tdLNB16ChOVA), endoOVA, or X31pOVA and draining LNs were harvested for analysis. (G) Cell surface Cd69 levels on divided CD45.1+ CD4+ OT-II T cells (left) and quantification of MFI with each cell division as determined by dye dilution (right) 3 days following transfer. Surface CD44 (H) and CD62L (I) levels on transferred CD45.1+ CD4+ OT-II T cells (left) and quantification of MFI (right) 3 days following transfer. (J) Frequency of transferred CD45.1+ CD4+ CD44+ OT-II T cells that are ICOS+PD-1lo Th1-like. (K) Frequency of transferred CD45.1+ CD4+ CD44+ OT-II T cells that produce IL-4, IL-17A and IFNγ following PMA/Ionomycin restimulation with detection by intracellular antibody staining 7 days after transfer. Data are represented as average ± SEM unless explicitly specified. *P <0.05, **P<0.01, ***P<0.001, ****P<0.0001.
Figure 3
Figure 3
Regulatory T cell depletion enhances cDC2 migration to the tdLN and unleashes an anti-tumor CD4+ Tconv response. (A) Dot plot correlation of intratumoral CD11b+ CD301b−/+ cDC2 frequency within MHC-II+ cells against CD4+ Tconv within CD90.2+ (left) or Treg (right) within CD90.2+. Dots colored according to ratio of B16-F10:B16Gm-csf cells in the tumor. Two pooled experiments displayed. (B) Tumor growth from control and Foxp3DTR mice. Upward facing black arrowheads indicate DT treatment. Results depict tumor growth curves of individual mice. (C) Tumor growth from control or Foxp3DTR mice injected with isotype/anti-CD4/anti-CD8 depleting antibodies. Results depict tumor growth curves of individual mice. Two pooled experiments displayed. (D) Tumor growth from control or Foxp3DTR mice injected with with vehicle or FTY720. Results depict tumor growth curves of individual mice. Two pooled experiment displayed. (E) CD45.1+ CD4+ OT-II T cells were adoptively transferred into DT-treated control or Foxp3DTR B16ChOVA-tumor-bearing mice and recovered 3 days later for analysis of dye dilution (left) and quantification of absolute number of OT-II present within the tdLN (right). Three pooled experiments displayed with normalization to control. (F) Control and Foxp3DTR B16ZsGreen tumor-bearing mice were treated with DT and absolute number of ZsGreen+ migratory DC in the tdLN were analyzed at day 5 post-DT. (G) Control and Foxp3DTR B16ZsGreen tumor-bearing mice were treated with DT and absolute number of ZsGreen+ CD11b+ cDC2 in the tdLN were analyzed at day 0, 1, 3 and 5 post-DT. Data displayed as percent of maximum absolute number. Samples statistically compared to day 0 DT condition. (H) Control and Foxp3DTR B16ZsGreen tumor-bearing mice were treated with DT and analyzed for the frequency of CD4+ Tconv expressing CD69 and CD44 at day 0, 1, 3 and 5 post-DT. Data displayed as frequency of maximum expression. Samples statistically compared to day 0 DT condition. Data are represented as average ± SEM. *P <0.05, **P<0.01, ***P<0.001, ****P<0.0001.
Figure 4
Figure 4
Regulatory T cell depletion enhances cDC2 function and CD4+ Tconv differentiation. (A-C) Purified CD4+ OT-II T cells were co-cultured with tdLN APC populations sorted from tdLN of control or Foxp3DTR B78chOVA-bearing animals and harvested 3 days after plating for analysis. (A) Absolute number of live OT-II T cells recovered, normalized and statistically compared to mCD301b+ condition. (B) Frequency of recovered OT-II T cells that had undergone division, statistically compared to mCD301b+ condition (t-test). (C) Cell surface CD69 levels on divided OT-II. (D) Volcano plots displaying DE expressed genes comparing control and Foxp3DTR tdLN mCD301b (left) and mCD301b+ (right). Log N fold cutoff of 0.4 used. Genes of interest labelled. (E) Cell surface levels of CD80 and CD86 on mCD301b and mCD301b+ in control and Foxp3DTR tdLN. (F) Frequency of CD44+ CD4+ Tconv that are ICOS+ PD-1lo in control and Foxp3DTR tdLN (left). Frequency of tdLN CD44+ CD4+ Tconv producing IL-4, IL-17A or IFNγ from control or Foxp3DTR tumor-bearing mice following ex vivo restimulation (right). (G) Frequency of CD44+ CD4+ Tconv that are ICOS+ PD-1lo in control and Foxp3DTR TME (left). Frequency of CD44+ CD4+ Tconv producing IL-4, IL-17A or IFNγ in control or Foxp3DTR TME following ex vivo restimulation (right). (H, I) Control and Foxp3DTR tumor-bearing mice were treated with FTY720 or vehicle and tdLN (H) or tumor (I) were harvested to quantify frequency of CD45+ cells that are CD44+ CD4+ ICOS+ PD-1lo Tconv (left) and are IFNγ-producing CD44+ CD4+ Tconv following ex vivo restimulation (right). Representative experiment displayed. Data are represented as average ± SEM. *P <0.05, **P<0.01, ***P<0.001, ****P<0.0001.
Figure 5
Figure 5
Anti-CTLA-4 induces expansion and functional enhancement of CD11b+ cDC2. (A) Frequency of Treg within CD4+ T cells in tdLN (left) or tumor (right) from B16ZsGreen tumor-bearing mice treated with mouse IgG2c isotype or anti-CTLA-4 with a mouse IgG2c Fc. (B) Absolute number of ZsGreen+ DC in tdLN (normalized to weight of associated tumor). (C) Frequency of CD44+ CD4+ Tconv with ICOS+ PD-1lo surface phenotype in tdLN (left) or tumor (right). (D) DC frequency of CD45+ cells within the vaccine site of mice treated with BvAX+/− αCTLA-4 or GVAX +/− αCTLA-4. (E) Frequency of Treg amongst CD4+ T cells (left) and frequency of CD44+ CD4+ Tconv or CD44+ cD8+ T cells amongst CD90.2+ T cells within the vaccine site of mice treated with BVAX +/− αCTLA-4 or GVAX +/− αCTLA-4 (right). (F) Quantification of CD80 and CD86 DMFI on mCD301b (left) or mCD301b+ (right) within the vaxLN of mice treated with BVAX +/− αCTLA-4 or GVAX +/− αCTLA-4. (G) Tumor growth from mice treated with BVAX +/− αCTLA-4 or GVAX +/− αCTLA-4. Ratio represents number of mice with tumors that displayed profound response (< 250mm3). Dotted line signifies 250 mm3. Representative experiment displayed. (H) DC frequency of either CD45+ or live cells within the vaccine site (left) or vaxLN (right) of control or Irf4Δ/Δ mice treated with GVAX-B16ChOVA and anti-CTLA-4. (I) Purified CD45.1+ OT-II T cells were adoptively transferred to control or Irf4Δ/Δ mice treated with GVAX-B16ChOVA and anti-CTLA-4 and vavLN were harvested 3 days later to assess OT-II T cell dye dilution (left) and quantify the frequency of cells that had divided (middle) and their frequency of endogenous CD4+ T cells (right). Data are represented as ± average SEM. *P <0.05, **P<0.01, ***P<0.001, ****P<0.0001.
Figure 6
Figure 6
scRNA-seq of the human tdLN reveals heterogeneity within BDCA-1+ cDC2. (A) t-SNE display of CD45+ CD3 CD19/20 CD56 myeloid cells sorted from a human melanoma tdLN and processed for scRNA-seq with pDC, neutrophil, NK cell, T cell and B cell contaminants removed from graph-based clustering analysis. (B) Heatmap displaying top 10 DE genes for each cluster when comparing clusters 0 through 6 (ranked by fold change). (C) Gene overlays of markers associated with various myeloid cell types on human tdLN t-SNE. (D) t-SNE display and graph-based clustering of BDCA-1+ cDC2 (cluster 0) from (A). (E) Heatmap displaying DE genes between clusters 0.1–0.3 with genes of interested labelled. (F) Violin plots displaying expression probability differences for denoted genes within clusters 0.1–0.3. (G) Gating strategy (left) in human TME to identify BDCA-3+ cDC1, CD14 BDCA-1+ cDC2, CD14+ BDCA-1+ cDC2. Cell surface expression of CCR7 on BDCA-3+ cDC1, CD14 BDCA-1+ cDC2, CD14+ BDCA-1+ cDC2 (right).
Figure 7
Figure 7
BDCA-1+ cDC2 proportion in the human TME impacts CD4+ Tconv proportion and quality. (A) Dot plot of BDCA-1+ cDC2 frequency of HLA-DR+ cells and Treg frequency of CD3+ T cells as quantified by flow cytometry in 32 human HNSC tumor samples. Dotted lines represent demarcation of samples divided based on proportion of BDCA-1+ cDC2 (CD14−/+) and Treg. (B) The frequency of CD4+ T cells (of CD3+ T cells) within each type of TME identified in (A). (C) Surface expression of ICOS and PD-1 on CD4+ Tconv, as a normalized geometric MFI, within each type of human TME identified in (A). (D) Percent of patients with a given stage of cancer at the time of flow cytometric analysis. (E) Progression-free survival since disease diagnosis. Mantel-Cox test performed between groups. (F) 19 human melanoma tumor samples (14 anti-PD-1 responder, 5 anti-PD-1 non-responders – see S6E) were parsed based on abundance of BDCA-3+ cDC1 and plotted for proportions of both BdCA-3+ cDC1 (black) and BDCA-1+ cDC2 (orange). Responders were parsed based on those high for either BDCA-3+ cDC1 (above median split of 3.63) or BDCA-1+ cDC2 (above median split of 12.4). (G) Frequency of CD3+ T cells that are CD8+ T cells (left) and CD4+ Tconv (right) from the two groups identified in (F). (H) Proportions of Treg amongst CD3+ T cells in samples from HNSC (A-E) and skin cutaneous melanoma (SKCM) (includes anti-PD-1 responders and non-responders) (F, G). Data are represented as ± average SEM. *P <0.05, **P<0.01, ***P<0.001, ****P<0.0001.

References

    1. Alferink J, Lieberam I, Reindl W, Behrens A, Weiss S, Huser N, Gerauer K, Ross R, Reske-Kunz AB, Ahmad-Nejad P, et al. (2003). Compartmentalized production of CCL17 in vivo: strong inducibility in peripheral dendritic cells contrasts selective absence from the spleen. The Journal of experimental medicine 197, 585–599. - PMC - PubMed
    1. Allison KA, Sajti E, Collier JG, Gosselin D, Troutman TD, Stone EL, Hedrick SM, and Glass CK (2016). Affinity and dose of TCR engagement yield proportional enhancer and gene activity in CD4+ T cells. eLife 5. - PMC - PubMed
    1. Azizi E, Carr AJ, Plitas G, Cornish AE, Konopacki C, Prabhakaran S, Nainys J, Wu K, Kiseliovas V, Setty M, et al. (2018). Single-Cell Map of Diverse Immune Phenotypes in the Breast Tumor Microenvironment. Cell. - PMC - PubMed
    1. Baratin M, Foray C, Demaria O, Habbeddine M, Pollet E, Maurizio J, Verthuy C, Davanture S, Azukizawa H, Flores-Langarica A, et al. (2015). Homeostatic NF-kappaB Signaling in Steady-State Migratory Dendritic Cells Regulates Immune Homeostasis and Tolerance. Immunity 42, 627–639. - PubMed
    1. Baratin M, Simon L, Jorquera A, Ghigo C, Dembele D, Nowak J, Gentek R, Wienert S, Klauschen F, Malissen B, et al. (2017). T Cell Zone Resident Macrophages Silently Dispose of Apoptotic Cells in the Lymph Node. Immunity 47, 349–362.e345. - PubMed

Publication types

MeSH terms