. 2019 Apr 18;177(3):541-555.e17.
doi: 10.1016/j.cell.2019.02.028. Epub 2019 Apr 4.

Resident Macrophages Cloak Tissue Microlesions to Prevent Neutrophil-Driven Inflammatory Damage

Affiliations

Resident Macrophages Cloak Tissue Microlesions to Prevent Neutrophil-Driven Inflammatory Damage

Stefan Uderhardt et al. Cell. .

Abstract

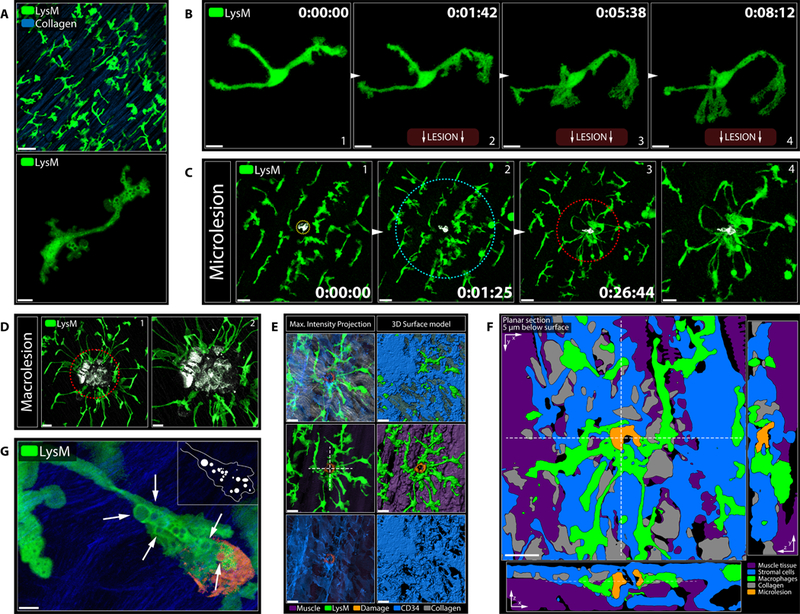
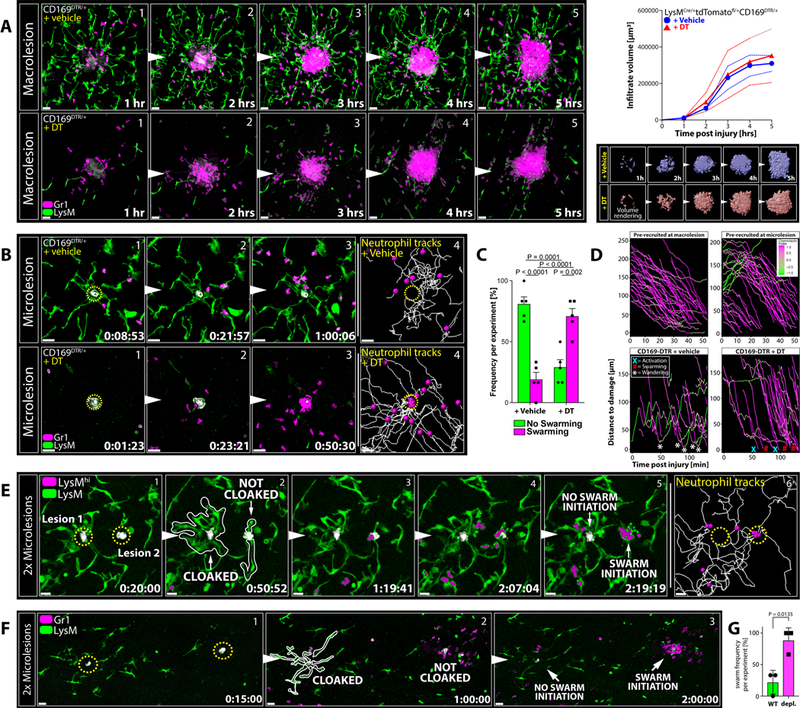
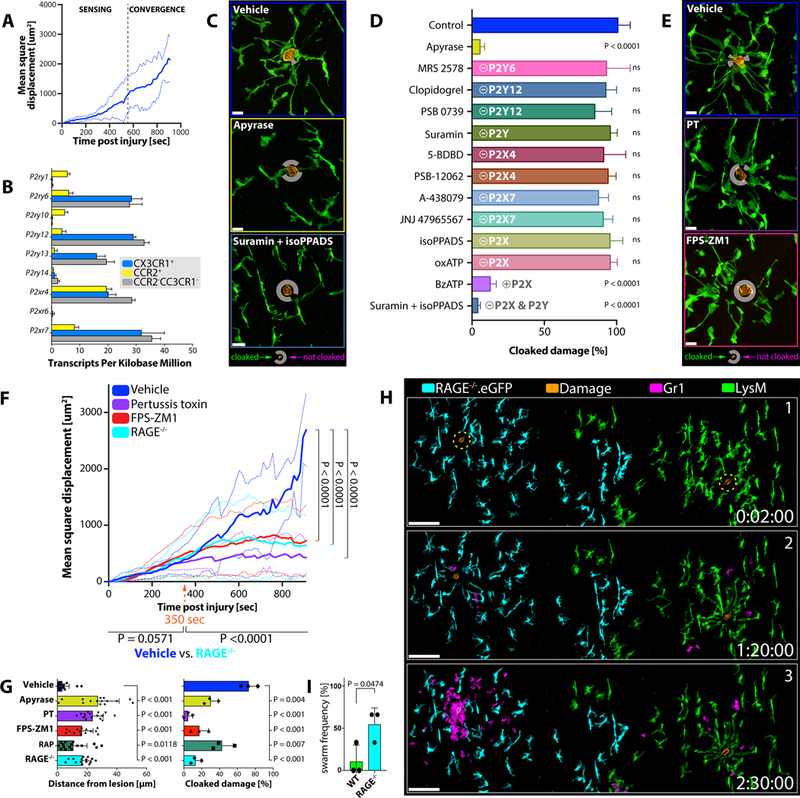
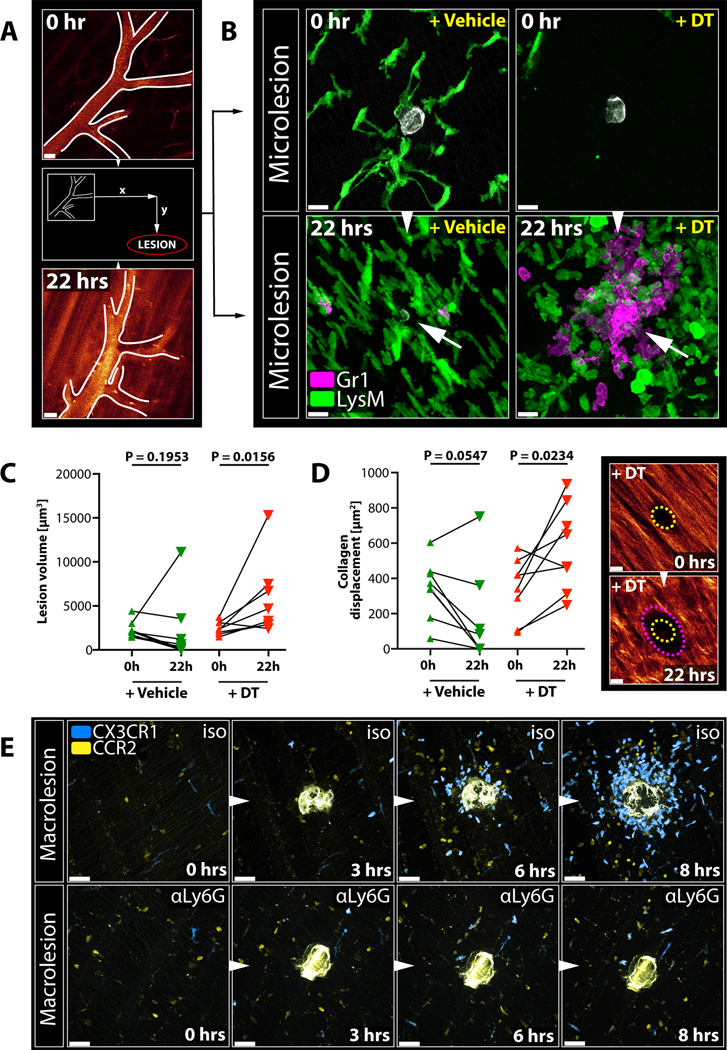
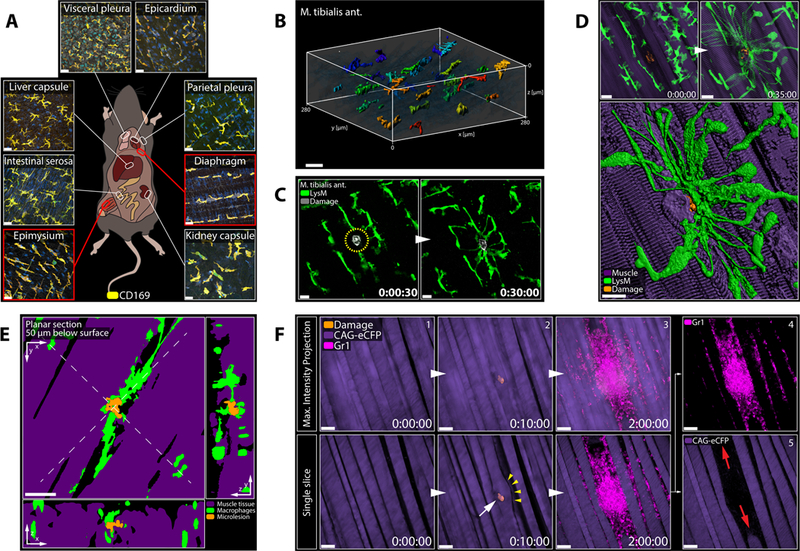
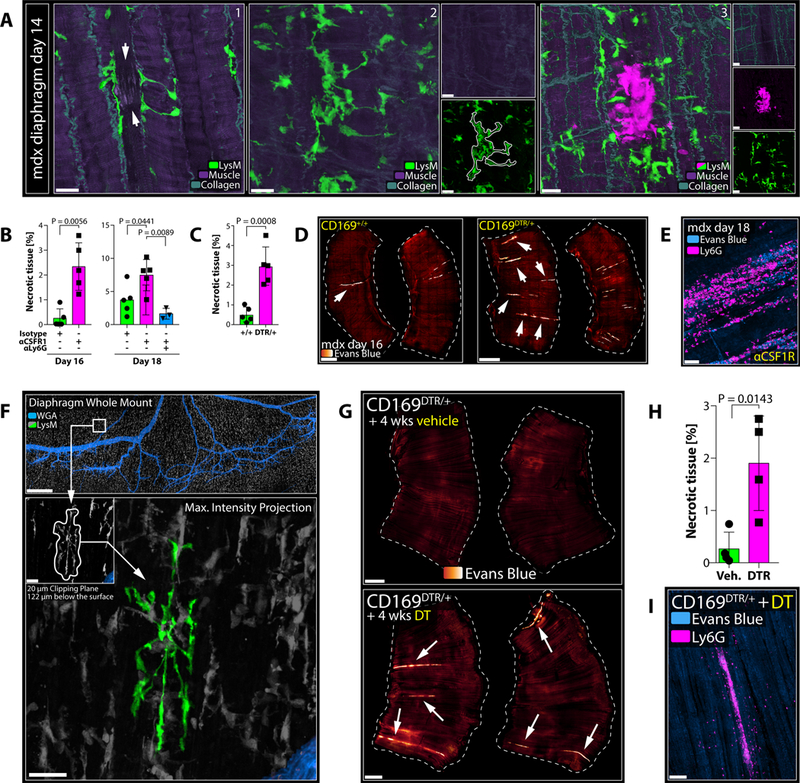
Neutrophils are attracted to and generate dense swarms at sites of cell damage in diverse tissues, often extending the local disruption of organ architecture produced by the initial insult. Whether the inflammatory damage resulting from such neutrophil accumulation is an inescapable consequence of parenchymal cell death has not been explored. Using a combination of dynamic intravital imaging and confocal multiplex microscopy, we report here that tissue-resident macrophages rapidly sense the death of individual cells and extend membrane processes that sequester the damage, a process that prevents initiation of the feedforward chemoattractant signaling cascade that results in neutrophil swarms. Through this "cloaking" mechanism, the resident macrophages prevent neutrophil-mediated inflammatory damage, maintaining tissue homeostasis in the face of local cell injury that occurs on a regular basis in many organs because of mechanical and other stresses. VIDEO ABSTRACT.

Keywords: anti-inflammation; cloaking; collateral damage; damage response; inflammation prevention; intravital imaging; neutrophil swarming; resident macrophages; tissue homeostasis; tissue protection.


Conflict of interest statement

DECLARATION OF INTERESTS

The authors declare no competing interests.

Figures

Figure 1.
Figure 1.. Endogenous Neutrophils Fail to Swarm at Microlesions.
A) Pre-recruited neutrophils (magenta) swarming at a macrolesion (grey). Scale bar, 30 μm. Representative of 3 experiments. See Movie S2B. B) Leading neutrophils (magenta) undergo cell death (cyan outline) upon contact (*) with macrolesion (grey) and initiate swarming. Scale bar, 10 μm. See Movie S2C. C) Distance-time plot of individual tracks of pre-recruited neutrophils migrating towards a macrolesion (bottom of the graph). Track color = chemotactic index; X = neutrophil death; # = swarming. Representative of 3 experiments. See Figure S1H. D) Changes in injury size (top; grey) and collagen structure (bottom) at a macrolesion with pre-recruited neutrophils over time. Scale bar, 30 μm. Representative of 2 experiments. See Movie S2E. E) Pre-recruited neutrophils (magenta) swarming at a macrolesion (top) or a microlesion (bottom). Scale bar, 30 μm. Representative of 4 experiments. See Movie S2G. F) Changes in injury size (top; grey) and collagen structure (bottom) at a microlesion with pre-recruited neutrophils over time. Scale bar, 30 μm. Representative of 3 experiments. See Movie S2H. G) Swarming behavior of endogenously recruited neutrophils (magenta) at a macrolesion (grey). Scale bar,50 μm. Representative of 2 experiments. See Movie S2I. H) Individual tracks of pre-recruited (top) versus endogenously recruited neutrophils (bottom) at microlesions (outline). Scale bar, 20 μm. Representative of 3 experiments. See Movie S2J. I) Distance-time plot of tracks of pre-recruited (left) vs. endogenously recruited (right) neutrophils migrating towards a microlesion. Track color = chemotactic index; X = neutrophil death; # = swarming; * = wandering behavior. See Figure S1H. Representative of 3 experiments. See Movie S2J.
Figure 2.
Figure 2.. Resident Tissue Macrophages are Dynamic First Responders to Tissue Damage.
A) Peritoneal serosa (top) and close-up image of an RTM (bottom) under resting conditions. Scale bars, 5 μm (top) and 50 μm (bottom). See Movie S3A. B) First minutes of an individual RTM (green) responding to a sterile tissue injury (bottom; not shown). Scale bar, 10 μm. See Movie S3B. C) RTM (green) responding to a microlesion (grey). Image (4) shows (3) in higher magnification. Circles indicate inner (red) and outer (cyan) response zone around the damage. Scale bars, 20 μm (1–3) and 10 μm (4). See Movie S3C. D) Different magnifications of RTM (green) responding to a macrolesion (grey). Scale bars, 20 μm (left) and 10 μm (right). E) Cloaking RTM and stromal cells covering a microlesion. Max intensity projection (left); 3D surface model (right). See Data File S2C. Scale bar, 20 μm. Dashed cross marks cross section in Figure 2F. Representative of > 5 experiments. F) Planar cross sections of 3D object in Figure 2E. See Data File S2D. Scale bar, 20 μm. G) Large endosomes (arrows) in a cloaking RTM (green) at a microlesion (orange). Scale bar, 5 μm.
Figure 3.
Figure 3.. Cloaking by RTM Prevents Neutrophil Activation and Subsequent Swarming.
A) RTM (green) and neutrophils (magenta) responding to macrolesions (grey) in CD169-DTR mice treated with vehicle (top; blue graph) or DT (bottom; red graph). Scale bar, 30 μm. Graphs show infiltrate volumes (means ± SEM as dashed lines) over time. Bottom pictures show surface volume renderings of infiltrates. n = 4 animals per group. B) RTM (green) and neutrophils (magenta) responding to microlesions (grey) in CD169-DTR mice treated with vehicle (top) or DT (bottom). Scale bar, 30 μm. n = 5 animals per group. See Movie S4A. C) Frequencies of neutrophil swarming (magenta) versus successful cloaking by RTM (= no swarming; green) at microlesions in vehicle-(left) or DT-treated (right) CD196-DTR mice. Two-way ANOVA; n = 5 animals per group with 5–7 microlesions per mouse; means ± SEM. D) Top: Distance-time plot showing tracks of pre-recruited neutrophils migrating towards a macro-(top left) or microlesion (top right). Bottom: Distance-time plot showing individual tracks of endogenously recruited neutrophils migrating towards a microlesion in vehicle-(bottom left) or DT-treated (right) CD169-DTR mice. X = neutrophil death; # = swarming; * = wandering behavior. See Figure S1H. E) RTM (green) and neutrophils (green/magenta) responding to two sequential microlesions (grey) set close to each other at minute 0 (left lesion 1) and at minute 20 (right lesion 2). Scale bar, 20 μm. Representative of 3 experiments. See Movie S4B. F) RTM (green) and neutrophils (magenta) responding to two micro-lesions set simultaneously in an RTM-rich (left lesion) or RTM-lacking (right lesion) area in partially RTM-depleted mice. Scale bar, 30 μm. Representative of 3 experiments with 3 sets of lesions per mouse. See Figure S3K–S3O. G) Frequency of neutrophil swarm initiations in RTM-rich (WT) versus RTM-depleted (depl.) areas within the same field-of-view (Figure 3F). Unpaired t test; n = 3 animals per group with 3 microlesion sets per mouse; means ± SEM.
Figure 4.
Figure 4.. Sequential Sensing of Damage-Associated Alarmins Drives Cloaking.
A) Mean square displacement of individual RTM pseudopods moving towards a micro-lesion over time. Data pooled from three independent tracking experiments. See Figure S4A–S4B. B) P2 receptor expression in different phagocyte populations isolated from peritoneal tissues of Cx3cr1gfp/+Ccr2rfp/+ mice (n = 3). Normalized reads per kilobases; means ± SEM. C) RTM (green) responses 30 minutes after damage induction (orange) in mice pre-treated with vehicle (top), apyrase (mid) or suramin/isoPPADS (bottom). n = 3–5 animals per group with 2–3 lesions per mouse. Scale bar, 15 μm. White circles mark un-cloaked areas. D) Comparison of RTM cloaking capacities upon inhibitor treatment. n = 2–3 animals per group with 2–3 lesions per mouse. One-way ANOVA; each condition compared to the naïve control; means ± SEM. E) RTM (green) responses 30 minutes after damage (orange) induction in mice treated with vehicle (top), PT (mid) or FPS-ZM1 (bottom). n = 3–5 animals per group with 2–3 lesions per mouse. Scale bar, 15 μm. F) Mean square displacement of individual RTM pseudopods moving towards a microlesion in WT mice treated with vehicle (blue), FPS-ZM1 (red) or pertussis toxin (purple), and RAGE−/−(cyan) mice over time. Data pooled from three independent tracking experiments for each condition. Two-way ANOVA; means ± SEM. See Figure S4C. G) Distances of pseudopods to microlesions (left) and physically cloaked area (right; pooled data from three independent experiments) 30 minutes after damage induction in WT mice treated with vehicle (blue), apyrase (yellow), pertussis toxin (PT; purple), FPS-ZM1 (red) or RAGE Antagonist Peptide (RAP; green), or RAGE−/−(cyan) mice. Two-way ANOVA; means ± SEM. See Figure S4C. H) Responses of wildtype RTM (green) versus RAGE−/−.eGFP RTM (cyan) to simultaneously induced microlesions (orange) and subsequent neutrophil behavior (magenta). See Figure S4D. Scale bar, 100 μm. Representative of 3 experiments with 3 sets of lesions per mouse. I) Frequency of neutrophil swarm initiations in wild type (WT) versus RAGE-deficient (RAGE−/−) areas. Unpaired t test; n = 3 animals per group with 3 lesion sets per mouse; means ± SEM.
Figure 5.
Figure 5.. Failure of Cloaking Causes Collateral Damage and Requires Containment by Migratory Monocytes.
A) Vessel structure used as a reference point to map microlesions and re-image them 22 hours later. Scale bar, 30 μm. B) RTM (green) and endogenous neutrophil responses (magenta) to microlesions (grey) right after damage induction and 22 hours later in CD169-DTR mice treated with vehicle (left) or DT (right). Arrows show late microlesions. Representative of 2 experiments. Scale bar, 20 μm. C) Size changes of individual microlesions over time in vehicle-(left) or DT-treated CD169-DTR mice over time. Wilcoxon test on matched samples (n = 5–7). Representative of 2 experiments. D) Collagen displacement at microlesions over time in vehicle-(left) or DT-treated CD169-DTR mice over time. Wilcoxon test on matched samples (n = 5–7 individual lesions). Representative of two independent experiments. Images show representative lesion in a DT-treated CD169-DTR mouse right after damage induction (top; yellow outline) and 22 hours later (bottom; magenta outline). Scale bar, 10 μm. E) Dynamic response of migratory CX3CR1+ (blue) or CCR2+ (yellow) monocytes to a macro-lesion in isotype-treated (“iso”; top) or neutrophil-depleted (“αLy6G”; bottom) Cx3cr1gfp/+Ccr2rfp/+ reporter mice. Scale bar, 30 μm. Representative of 3 experiments each. See Movie S5B.
Figure 6.
Figure 6.. RTM Cloak Damaged Muscle Fibers.
A) Confocal images showing various RTM populations in naïve LysM-gfp mice. Representative of 2 experiments. Scale bar, 30 μm. B) 3D reconstruction of RTM distribution in the tibialis anterior muscle. Object color = distance on y-axis. Scale bar, 30 μm. C) Endomysial RTM (green) responding to a microlesion (grey) in the tibialis anterior muscle. Scale bar, 20 μm. Representative of 3 experiments. D) Endo-and perimysial RTM (green) responding to a partially damaged myofiber (top = max intensity projection; bottom = 3D reconstruction). See Data File S3A. Scale bar, 20 μm. E) Planar cross sections of 3D object in Figure 6D. See Data File S3B. Scale bar, 20 μm. F) Pre-recruited neutrophils (magenta) swarming at a partially damaged myocyte (purple). Top = max intensity projection; bottom = single slice through plane of damage. Arrows show ruptured myofiber. Scale bar, 50 μm. Representative of 3 experiments.
Figure 7.
Figure 7.. RTM Cloak Damaged Muscle Fibers.
A) Diaphragms isolated from mdx mice at day 14 of age. White arrows show damaged muscle fibre with cloaking RTM processes. Representative of > 3 experiments. Scale bar, 20 μm. B) Extent of necrosis in diaphragms of mdx mice on day 16 (left) or day 18 (right), treated with isotype (green), anti-CSFR1 (magenta) or anti-CSFR1/anti-Ly6G (blue). Unpaired t test (day 16); one-way ANOVA (day 18); n = 3–5 animals per group; means ± SEM. Representative of 2 experiments. C) Extent of necrosis in diaphragms of CD169+/+ (green) or CD169DTR/+ (magenta) mdx mice on day 16, treated with DT. Unpaired t test; n = 5 animals per group; means ± SEM. Representative of 2 experiments. D) Diaphragms from CD169+/+ or CD169DTR/+ mdx mice on day 16. Arrows show necrotic tissues (orange-to-white). Scale bar, 1000 μm. E) Neutrophil infiltrates (magenta) in necrotic muscle (blue). Scale bar, 50 μm. F) Representative confocal image of a Ce3D-cleared diaphragm; cloaking RTM highlighted in green. Scale bars, 500 μm (top) and 30 μm (bottom). See Movie S7A. G) Diaphragms from adult CD169-DTR mice after long-term treatment with vehicle (left) or DT (right). Arrows show necrotic tissues (orange-to-white). Scale bar, 1000 μm. H) Quantification of necrosis in diaphragms of CD169-DTR mice after long-term treatment with vehicle (green) or DT (right). Unpaired t test; n = 4 animals per group; means ± SEM. Representative of 2 experiments. I) Neutrophil infiltrates (magenta) in necrotic muscle (blue) in CD169-DTR mice after long-term DT-treatment. Scale bar, 100 μm.

Comment in

References

    1. Afonso PV, Janka-Junttila M, Lee YJ, McCann CP, Oliver CM, Aamer KA, Losert W, Cicerone MT, and Parent CA (2012). LTB4 is a signal-relay molecule during neutrophil chemotaxis. Dev Cell 22, 1079–1091. - PMC - PubMed
    1. Amit I, Winter DR, and Jung S (2016). The role of the local environment and epigenetics in shaping macrophage identity and their effect on tissue homeostasis. Nat Immunol 17, 18–25. - PubMed
    1. Arnold L, Henry A, Poron F, Baba-Amer Y, van Rooijen N, Plonquet A, Gherardi RK, and Chazaud B (2007). Inflammatory monocytes recruited after skeletal muscle injury switch into antiinflammatory macrophages to support myogenesis. J Exp Med 204, 1057–1069. - PMC - PubMed
    1. Brandes M, Klauschen F, Kuchen S, and Germain RN (2013). A systems analysis identifies a feedforward inflammatory circuit leading to lethal influenza infection. Cell 154, 197–212. - PMC - PubMed
    1. Cekic C, and Linden J (2016). Purinergic regulation of the immune system. Nat Rev Immunol 16, 177–192. - PubMed

Publication types

Substances