. 2019 Apr 18;177(3):722-736.e22.
doi: 10.1016/j.cell.2019.02.030. Epub 2019 Apr 4.

Insulin Receptor Associates with Promoters Genome-wide and Regulates Gene Expression

Affiliations

Insulin Receptor Associates with Promoters Genome-wide and Regulates Gene Expression

Melissa L Hancock et al. Cell. .

Abstract

Insulin receptor (IR) signaling is central to normal metabolic control and dysregulated in prevalent chronic diseases. IR binds insulin at the cell surface and transduces rapid signaling via cytoplasmic kinases. However, mechanisms mediating long-term effects of insulin remain unclear. Here, we show that IR associates with RNA polymerase II in the nucleus, with striking enrichment at promoters genome-wide. The target genes were highly enriched for insulin-related functions including lipid metabolism and protein synthesis and diseases including diabetes, neurodegeneration, and cancer. IR chromatin binding was increased by insulin and impaired in an insulin-resistant disease model. Promoter binding by IR was mediated by coregulator host cell factor-1 (HCF-1) and transcription factors, revealing an HCF-1-dependent pathway for gene regulation by insulin. These results show that IR interacts with transcriptional machinery at promoters and identify a pathway regulating genes linked to insulin's effects in physiology and disease.

Keywords: HCFC1; INSR; RNA polymerase II; coregulator host cell factor-1; gene promoter; insulin receptor signaling; nuclear receptor tyrosine kinase; transcription factor.


Conflict of interest statement

Declaration of Interests

The authors declare no competing interests.

Figures
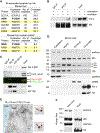
Figure 1.
Figure 1.. IR associates with RNA Polymerase II on chromatin.
(A) Proteins that co-IP with IRβ in mouse liver, or liver nuclear extract. The list shows the top hits identified by mass spectrometry, highlighting Pol II subunits RPB1 and RPB2 in yellow. (B) Co-immunoprecipitation of IRβ and Pol II in HepG2 cells with or without sonication and nuclease treatment. (C) Co-immunoprecipitation showing preferential association of IRβ with hyperphosphorylated Pol II. The CTD has 52 heptad repeats: the blot is probed with antibodies recognizing Ser5P (red) or non-phosphorylated (green) repeats, and shows hyperphophorylated (0) and hypophosphorylated (a) forms. The related receptor IGF1Rβ serves as a negative control that showed no evident association with Pol II. (D) Mouse liver fractionation shows IRα and β in cytoplasmic, membrane, soluble nuclear, and chromatin-bound fractions. Other proteins are markers confirming effective fractionation. While Pol II is highly enriched in chromatin, a longer exposure shows its presence also in the soluble nuclear fraction. IRα non-specific bands are marked n.s. (E) Immunogold EM labeling of nuclear IRβ (arrows) and IRα (arrowheads) proximity in HepG2 cells. Scale bar: 100 nm; 50 nm for insets. (F) Human liver fractionation shows IRβ in non-nuclear and nuclear fractions. See also Figures S1 and S2.
Figure 2.
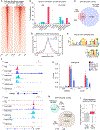
Figure 2.. Genome-wide analysis reveals high enrichment of IR on gene promoters.
(A) Heatmaps of IRβ and Pol II S5P ChIP-seq peaks near the TSS in HepG2 cells. Raw read densities were used, and each horizontal line shows a separate IRβ-bound gene locus. (B) IRβ ChIP-seq peaks classified by human genomic annotations (hg19). (C) Overlap of IRβ and Pol II S5P ChIP-seq peaks. (D) ChIP-seq density plot for IRβ and Pol II S5P at IRβ-bound loci. (E) Top consensus sequences identified by de novo motif discovery at IRβ sites within promoters. (F) ChIP-seq distribution for IRβ, Pol II S5P, and chromatin modifications, at representative gene loci, TIMM22 and LARS. Histone modification data are from ENCODE Consortium. (G) ChIP-qPCR confirmation of IRβ promoter binding for representative genes. Amplified DNA fragment positions (5’ ends) are shown relative to the TSS. n=4. (H) Overlap of IRβ with H3K4me3 or H3K27me3 ChIP-seq peaks genome-wide. (I) Expression level of IRβ-bound targets compared to average total gene expression based on our RNA-seq data in HepG2 cells. ***P<0.001 (Mann Whitney Wilcoxon test). See also Figure S3 and Table S1.
Figure 3.
Figure 3.. IR target genes are highly enriched for insulin-related functions.
(A) Top functional pathways of genes with IRβ-bound promoters, in Reactome database hierarchical levels 2 and 3, grouped according to related functional categories. (B) Top disease pathways of genes with IRβ-bound promoters in MSigDB database. Numbers of IRβ-bound and total genes within each pathway are shown.
Figure 4.
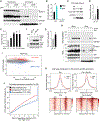
Figure 4.. Insulin regulation of IR chromatin binding, dysregulation in insulin resistance, and insulin-regulated expression of IR-bound genes.
(A) Western analysis of IRβ in liver membrane or chromatin-bound fraction from wild-type or ob/ob mice injected with glucose or saline control solution. (B) Quantitation of IRβ in chromatin-bound fraction in response to glucose. n=3, **P<0.01 (two-tailed t-test). (C) Western analysis of IRβ in liver chromatin-bound fraction from mice injected with insulin or saline control solution. (D) Quantitation of chromatin-bound IRβ in response to insulin. n=5, *P<0.05 (two-tailed t-test). (E) Quantitation of nuclear IRβ in response to insulin treatment over time in HepG2 cells. (See Figure S4E for immunoblot image.) n=3, *P<0.05, **P<0.01 (vs. 0 min control, one-way ANOVA with Dunnett’s post hoc analysis). (F) Co-immunoprecipitation of IRβ and Pol II S5P in HepG2 cells with 10 min insulin or control treatment. (G) Quantitation of Pol II S5P associated with IRβ. n=4, **P<0.01 (two-tailed t-test). (H) Western analysis of cell surface-biotinylated IRβ in membrane and nuclear fractions of HepG2 cells with 10 min insulin or control treatment. (I) MA plot of normalized counts showing differentially expressed genes (DEGs) with FDR<0.001 in response to 4h insulin treatment. (J) Activating/repressive function prediction for IRβ by Binding and Expression Target Analysis (BETA). IRβ ChIP-seq sites are integrated with RNA-seq gene expression data from HepG2 cells with control or insulin treatment. Red and blue lines represent up-regulated and down-regulated genes; dashed line represents non-DEGs as background. Genes are ranked based on the regulatory potential scores of their IR binding sites, and significance of up- or down-regulated gene distributions compared to non-DEGs is determined by the Kolmogorov-Smirnov test. (K) ChIP-seq peak distribution for IRβ and Pol II S5P on IRβ-bound genes that are up-regulated by insulin. Graphs shows average distribution, while horizontal lines on the heatmaps show individual promoters. See also Figure S4.
Figure 5.
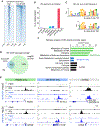
Figure 5.. IR binding to promoters in SH-SY5Y neuroblastoma cells.
(A) Heatmaps of IRβ and Pol II S5P ChIP-seq peaks near the TSS in SH-SY5Y cells. Each horizontal line shows a separate IRβ-bound gene locus. (B) IRβ ChIP-seq peaks classified based on human genomic annotations (hg19). (C) Top consensus sequences identified by de novo motif discovery at IRβ sites within promoters. (D) Overlap of IRβ ChIP-seq peaks between SH-SY5Y and HepG2 cells. (E) ChIP-seq distribution for IRβ in HepG2 (black) and SH-SY5Y (blue) cells, showing examples of cell-type specific peaks, as well as those present in both cell types. (F) Pathway analysis for genes with IRβ ChIP-seq promoter peaks (± 500 bp from TSS) that are unique to HepG2 or SH-SY5Y cells, or in both cell lines (overlap). See also Table S2.
Figure 6.
Figure 6.. IR interacts physically and functionally with transcriptional coregulator HCF-1.
(A) Co-immunoprecipitation of IR (C-terminal FLAG tag), endogenous HCF-1 (antibody against the N-terminus, CST 69690), and endogenous Pol II S5P in cells expressing increasing concentrations of IR-FLAG. No association was seen with CREB negative control. (B) Comparison of top consensus sequences identified by de novo motif discovery at HCF-1 or IRβ sites within promoters in HepG2 cells. (C) ChIP density plots for IRβ and HCF-1 at IRβ-bound loci in HepG2 cells. (D) Overlap of genes bound to IRβ and HCF-1 within promoter regions (±500 bp from TSS) in HepG2 cells. Significance calculated by hypergeometric test. (E) ChIP-seq peak distribution for IRβ, HCF-1, and H3K4me3 at representative gene loci GSK3A and TIMM22. (F) Sequential ChIP-qPCR using antibody against IRβ, followed by antibody against IgG or HCF-1 at GSK3A and TIMM22 promoters and negative control distal regions (regions underlined in green in panel E). A control locus that binds HCF-1 but not IRβ is in Figure S5H. n=3. (G) IRβ ChIP-qPCR in HepG2 cells transfected with HCF-1 or control siRNA. For each position, ChIP binding normalized to input is shown as fold-change to TIMM22 negative control. n=3, *P<0.05, **P<0.01, ***P<0.001 (two-tailed t-test). (H) LARS promoter-driven luciferase reporter in cells expressing HCF-1 or control siRNA, in response to 24h insulin or control treatment. LARS promoter mutations altered the IRβ and HCF-1 consensus motif as shown. n=5, *P<0.05, ***P<0.001 (Two-way ANOVA with Tukey’s post hoc analysis). (I) RT-qPCR of Lars expression in primary mouse hepatocytes expressing HCF-1 or control siRNA, and with 3h insulin or control treatment. n≥4, **P<0.01, ***P<0.001 (Two-way ANOVA with Tukey’s post hoc analysis). See also Figures S5 and S6 and Tables S3 and S4.
Figure 7.
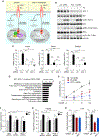
Figure 7.. HCF-1-dependent signaling pathway mediates downstream effects of insulin.
(A) Left: In the model illustrated, insulin binding to IR activates canonical kinase signaling, as well as IR nuclear translocation and association with transcription machinery at gene promoters. Interactions of IR within the complex may potentially be direct or indirect. Right: Loss of HCF-1 prevents IR association with promoters, without causing obvious impairment of canonical PI3K-AKT kinase signaling. (B) Western analysis of protein phosphorylation in HepG2 cells expressing HCF-1 or control siRNA, with 10 min insulin treatment. (See Figure S7A for quantitation.) (C) Gene expression measured by RT-qPCR in response to 24h insulin treatment in HepG2 cells expressing IR, HCF-1, or control siRNA. Results are graphed for the top 3 insulin-responsive genes from Figure S7D. n=3, **P<0.01, ***P<0.001 (Two-way ANOVA with Tukey’s post hoc analysis). (D) Top functional pathways of insulin-induced genes with promoters co-bound by IRβ and HCF-1 in HepG2 cells. Shown are categories in Reactome database hierarchical levels 2 and 3. (E) Cell proliferation rates in HepG2 cells transfected with IR, HCF-1, or control siRNAs, and treated with increasing concentrations of insulin for 24h. n=10, ***P<0.001 (vs. control siRNA, Two-way ANOVA with Dunnett’s post hoc analysis). (F) Cap-dependent translation measured with a bicistronic luciferase reporter in cells transfected with IR, HCF-1, or control siRNA, in response to 24h insulin treatment. n=5, *P<0.05, **P<0.01 (two-tailed t-test). (G) Triglyceride level in HepG2 cells expressing IR, HCF-1, or control siRNA, with 24h insulin treatment. *P<0.05, **P<0.01 (two-tailed t-test). (H) Free fatty acid or triglyceride level in livers from mice injected with adeno-associated virus expressing IR, HCF-1, or control shRNA. n=5, *P<0.05, ***P<0.001 (vs control shRNA; One-way ANOVA with Dunnett’s post hoc analysis). See also Figure S7 and Table S5.

Comment in

References

    1. Adelman K and Lis JT (2012). Promoter-proximal pausing of RNA polymerase II: emerging roles in metazoans. Nat Rev Genet 13, 720–731. - PMC - PubMed
    1. Afgan E, Baker D, van den Beek M, Blankenberg D, Bouvier D, Cech M, Chilton J, Clements D, Coraor N, Eberhard C, et al. (2016). The Galaxy platform for accessible, reproducible and collaborative biomedical analyses: 2016 update. Nucleic Acids Res 44, W3–W10. - PMC - PubMed
    1. Altindis E, Cai W, Sakaguchi M, Zhang F, GuoXiao W, Liu F, De Meyts P, Gelfanov V, Pan H, DiMarchi R, Kahn CR (2018) VIRαl insulin-like peptides activate human insulin and IGF-1 receptor signaling: A paradigm shift for host-microbe interactions. Proc Natl Acad Sci USA 115, 2461–2466. - PMC - PubMed
    1. Ambrosini G, Groux R, and Bucher P (2018). PWMScan: a fast tool for scanning entire genomes with a position-specific weight matrix. Bioinformatics 34, 2483–2484. - PMC - PubMed
    1. Babu M, Gagarinova A, and Emili A (2011). Array-based synthetic genetic screens to map bacterial pathways and functional networks in Escherichia coli. Methods Mol Biol 781, 99–126. - PubMed

Publication types

MeSH terms