. 2019 Apr 18;177(3):782-796.e27.
doi: 10.1016/j.cell.2019.02.023. Epub 2019 Apr 4.

Engineering a Model Cell for Rational Tuning of GPCR Signaling

Affiliations

Engineering a Model Cell for Rational Tuning of GPCR Signaling

William M Shaw et al. Cell. .

Abstract

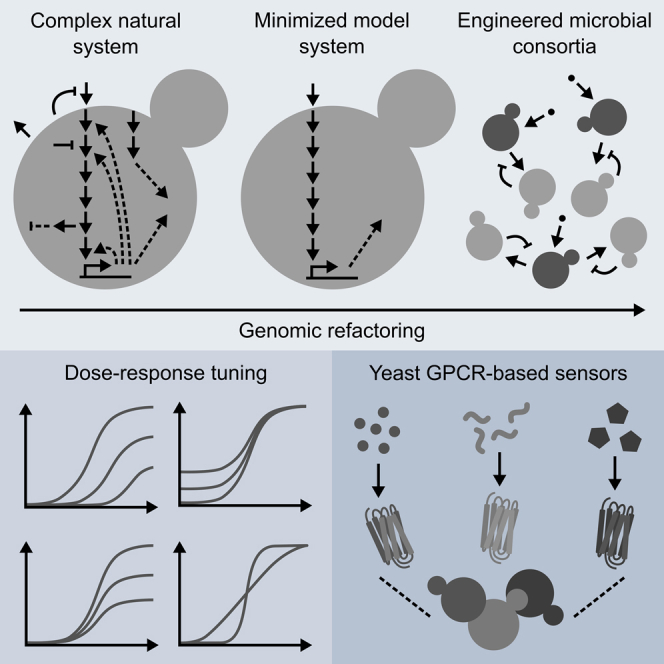
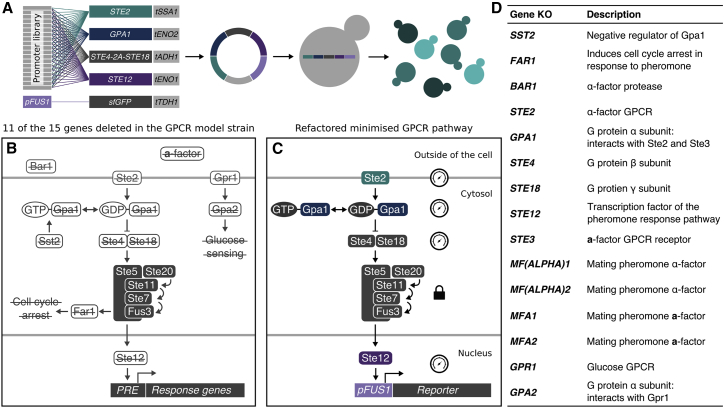
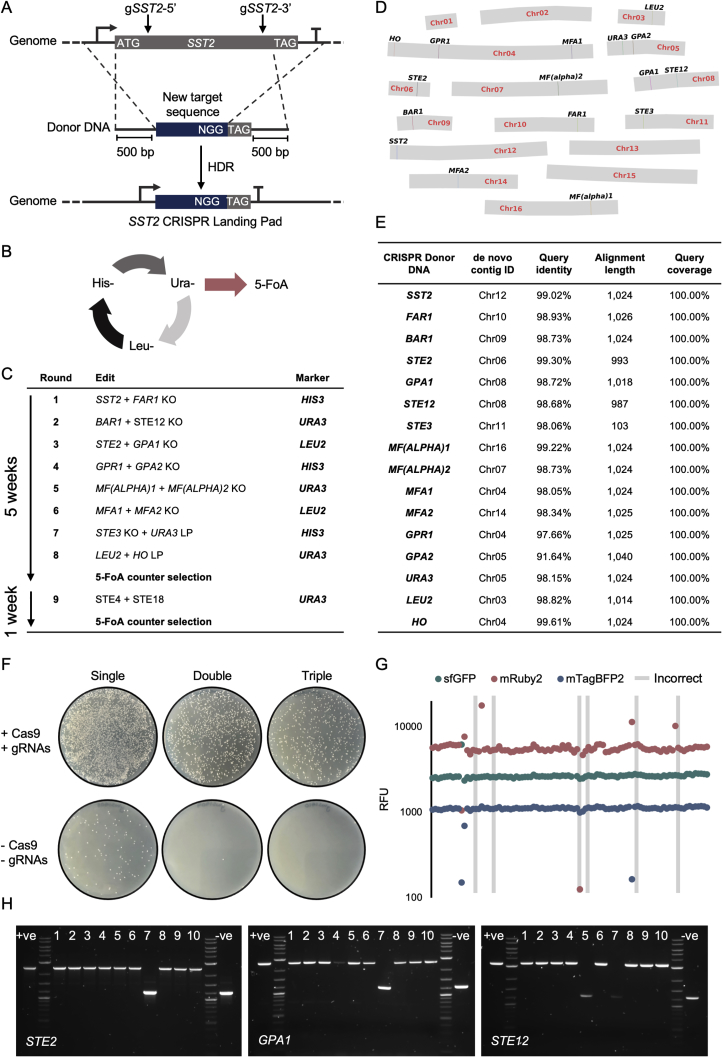
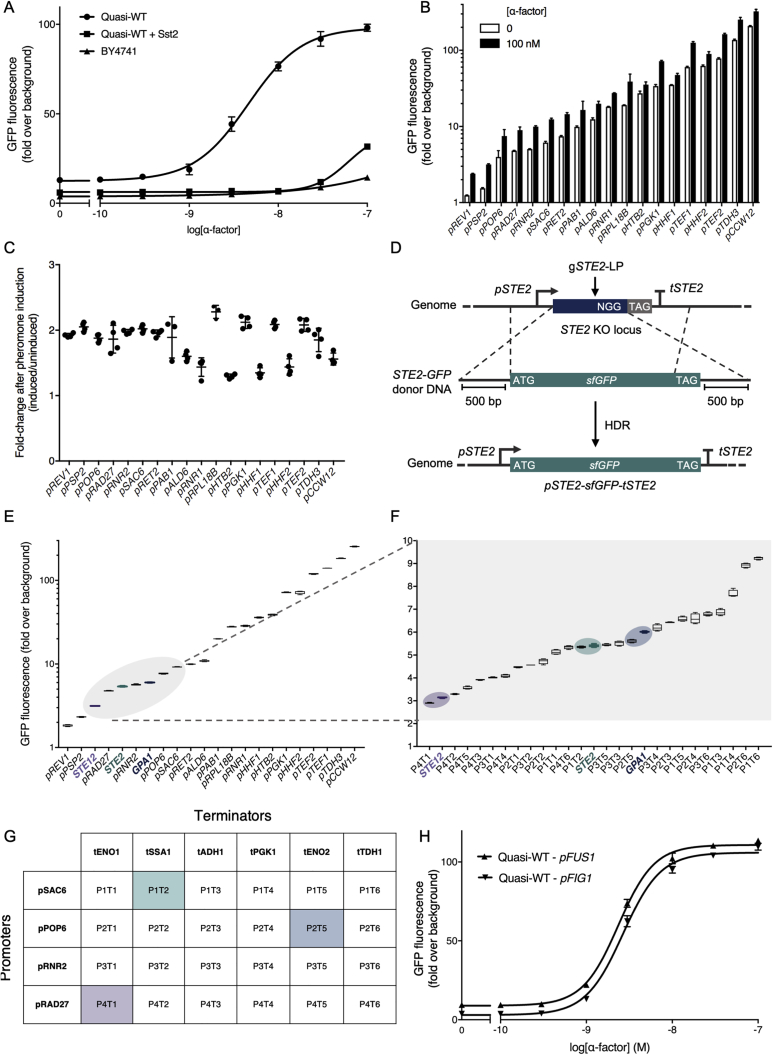
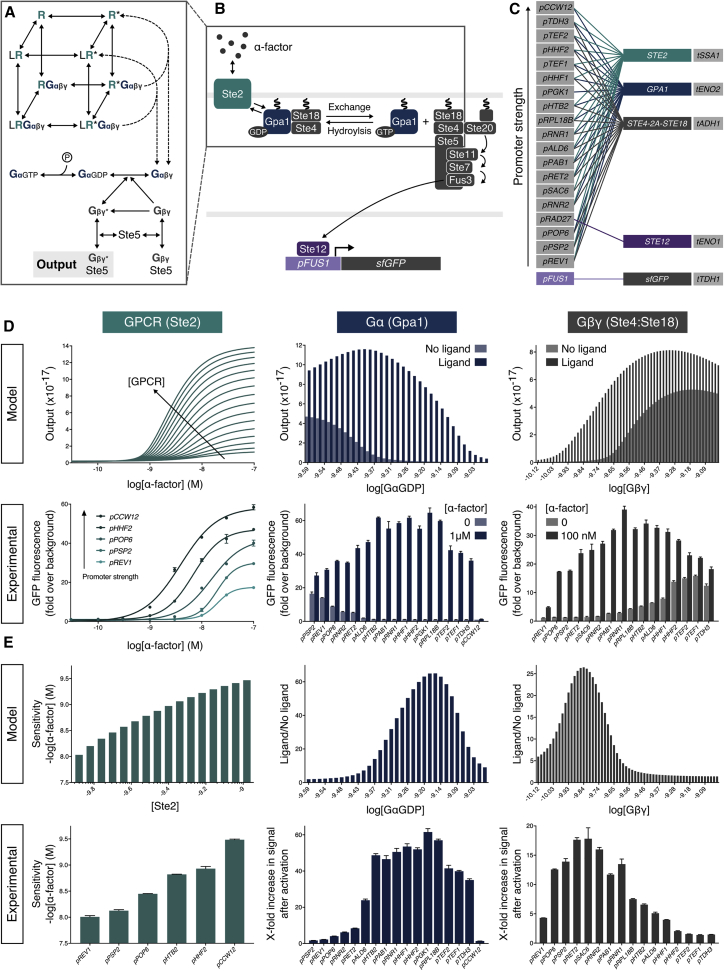
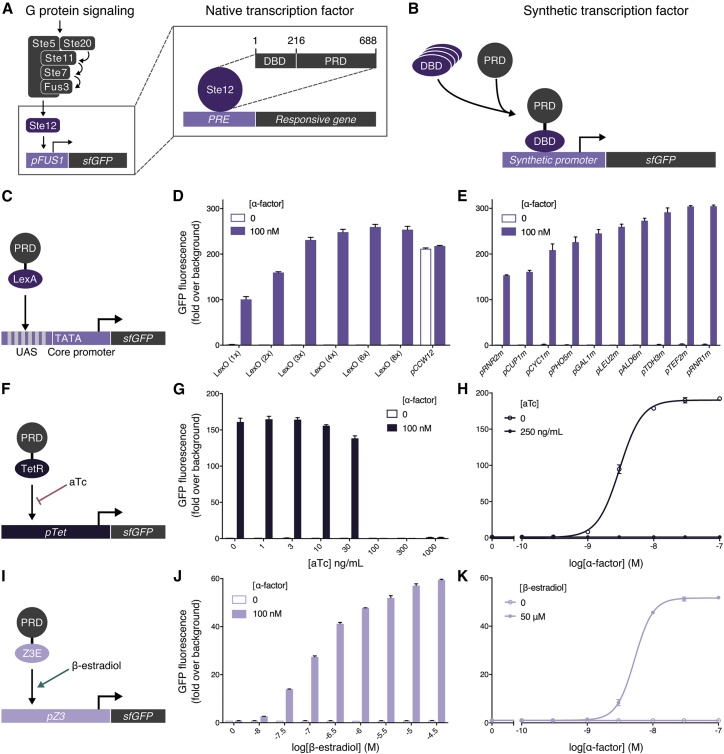
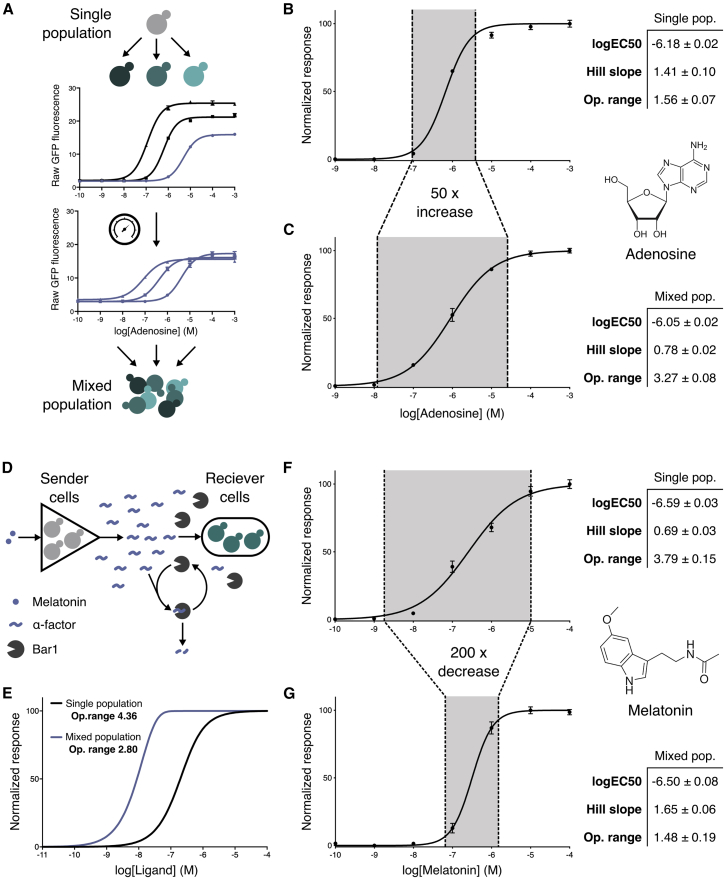
G protein-coupled receptor (GPCR) signaling is the primary method eukaryotes use to respond to specific cues in their environment. However, the relationship between stimulus and response for each GPCR is difficult to predict due to diversity in natural signal transduction architecture and expression. Using genome engineering in yeast, we constructed an insulated, modular GPCR signal transduction system to study how the response to stimuli can be predictably tuned using synthetic tools. We delineated the contributions of a minimal set of key components via computational and experimental refactoring, identifying simple design principles for rationally tuning the dose response. Using five different GPCRs, we demonstrate how this enables cells and consortia to be engineered to respond to desired concentrations of peptides, metabolites, and hormones relevant to human health. This work enables rational tuning of cell sensing while providing a framework to guide reprogramming of GPCR-based signaling in other systems.

Keywords: G protein-coupled receptor; Saccharomyces cerevisiae; biosensor; cell signaling; cell-to-cell communication; genome engineering; synthetic biology.


Figures

None
Graphical abstract
Figure 1
Figure 1
A Model GPCR Strain for Probing Pathway Performance (A) Pathway variants are generated by assembling the key signaling components into a single multigene cassette, using a library of well-characterized promoters to vary the expression, and then chromosomally integrating into the model strain, yWS1922, to reconstitute a minimized GPCR signaling pathway. (B) 11 of the 15 genes deleted from the yeast mating and glucose-sensing pathways in the model strain, leaving only the core signaling elements of the MAPK cascade intact. (C) A refactored signaling pathway, consisting of a minimized set of signaling components for transmitting a unidirectional signal from the cell surface to the nucleus. Gauges and padlocks represent components we have chosen to vary or keep fixed, respectively. (D) The 15 gene deletions in the model strain, serving six key purposes: (1) to remove negative feedback within the signaling pathway (SST2), (2) to prevent unwanted cell-cycle arrest (FAR1), (3) to prevent ɑ-factor signal degradation (BAR1), (4) to be refactored with synthetic tools (STE2, GPA1, STE4, STE18, and STE12), (5) to remove mechanisms for pheromone-based communication (MF(ALPHA)1+2, MFA1+2, and STE3), and (6) to remove all other instances of GPCR/G-protein signaling (GPR1 and GPA2). See also Figure S1.
Figure S1
Figure S1
Cell Line Development, Related to Figure 1 (A-C) Strategy for engineering the GPCR model strains. (A) To generate the 15 gene KOs in Figure 1D, double strand breaks (DSBs) were generated between the start and stop codon of the ORF of each gene using CRISPR/Cas9. Donor DNA was provided as a template for homology-directed repair (HDR), comprising 500 bp homology arms flanking a unique 20 bp Cas9 targeting sequence followed by a CGG protospacer adjacent motif (PAM) sequence. The resulting KOs represent a precise substitution of the open reading frame with a unique landing pad (LP) to enable future editing at each locus. A further 3 edits were performed at the URA3, LEU2, and HO loci to prepare the cells for efficient multiplexed integration of YTK plasmids by installing a landing pad between the two arms of homology. (B) To rapidly iterate through the 18 genomic edits a marker cycling strategy was employed. Once an edit, facilitated by CRISPR/Cas9 carried on a 2μ plasmid containing one of the three auxotrophic markers, URA3, LEU2 and HIS3, had been confirmed by colony PCR, the next set of edits would immediately be performed by transforming the donor DNA and CRISPR/Cas9 machinery supplied on a plasmid using the next marker in the cycle, removing the need to cure cells of the previous marker. A 3-marker cycle was sufficient to remove all trace of a marker before it was reused in the cycle. (C) Edits were implemented in a pairwise manner, totaling 8 rounds of editing to generate the yWS677 strain and an additional round to generate the yWS1922 strain. 12 colonies were screened for each pairwise edit, yielding at least one correct colony at each round. Editing of yWS677 and yWS1922 was followed by counterselection of the URA3 CRISPR apparatus by 5-FoA to generate clean strains. The final strain was validated for loss of all CRISPR plasmids via replica plating on Ura-, Leu- and His- media and colony PCR. (D+E) Nanopore sequencing of the yWS677 stain (D) De novo contigs assembled using Smartdenovo from reads corrected by Canu, representing the full set of 16 chromosomes from S. cerevisiae, confirmed by exact alignment to S288C reference genome using a minimum alignment length of 100 bp. All discrepancies with the reference genome are highlighted and correspond to the 16 edits described in E. No other discrepancies were detected, suggesting precise CRISPR/Cas9 editing during the 8 rounds. (E) A list of the expected changes and confirmation of their correct positioning within the yWS677 genome. Note all alignments are approximately 1000 bp in length, as this was the size of the donor DNA transformed, except for STE3. Due to cloning issues with the STE3 KO donor DNA, a smaller fragment generated from oligonucleotides was used instead. (F-H) Efficient (Re)integration of DNA at the genomic CRISPR landing pads in yWS677. (F) Single, double, and triple integration of URA3, LEU2, and HIS3 maker cassettes at the URA3, LEU2, and HO loci, encoding sfGFP, mRuby2, and mTagBFP2, with and without Cas9 and the sgRNAs required to generate DSBs at their respective LP. (G) Green, red, and blue fluorescence of 96 random colonies from the CRIPSR-aided triple integration. 90/96 colonies correct for triple integration. The remaining 6 colonies contained a mixture of multiple integrations, or missing fluorescence proteins. Experimental measurements are sfGFP, mRuby2, and mTagBFP2 levels per cell determined by flow cytometry. (H) Colony PCR verification of the multiplexed re-integration of STE2, GPA1, and STE12 into yWS677 using markerless CRISPR/Cas9 editing to create the Quasi-WT strain. 8/10 random transformants were correct for the triple gene re-integration. 5-FoA counter selection was used to cure a confirmed strain of the CRISPR plasmid, and direct Sanger sequencing of the 3 genes was performed to confirm their identity to validate the Quasi-WT strain.
Figure S2
Figure S2
Initial Pathway Refactoring, Related to Figure 2 (A) ɑ-factor dose-response curve of the pheromone response pathway in BY4741 (WT yeast), Quasi-WT, and Quasi-WT overexpressing Sst2, using the FUS1 promoter driving the expression of sfGFP. The poor response of BY4741 compared to Quasi-WT is due to the role of Sst2. (B-G) Here, we determine the promoter combinations for refactoring Ste2, Gpa1, and Ste12 in yWS677 (Ste4 and Ste18 were refactored in yWS1922 after establishing the expression of Ste2, Gpa1, and Ste12 in yWS677). To do this, we substituted the native STE2, GPA1, and STE12 ORFs in yWS677 for the sfGFP ORF to serve as a proxy for native expression, enabling us to select promoter/terminator combinations from the YTK system for refactoring the minimized pheromone response pathway. (B) Before using YTK constitutive promoters, their performance under pheromone induction was measured to ensure it had no effect. 19 constitutive promoters from the YTK system were measured driving expression of sfGFP, with and without induction using 100 nM ɑ-factor peptide, in the Quasi-WT strain, after the standard assay time of 4 hours. (C) Relative fluorescence change (induced/uninduced) due to pheromone induction calculated from (B). A similar response was observed for all promoters, suggesting a common trait responsible for the increase in sfGFP fluorescence, likely caused by morphological changes as part of the pheromone response, leading to system wide increase in total protein. (D) Using LPs previously introduced at the gene KO sites, the sfGFP ORF was introduced between the native regulatory elements of STE2, GPA1, and STE12 to serve as a proxy for relative gene expression. (E) The GFP fluorescence levels of the STE2, GPA1, and STE12 ORF-GFP substitution strains were compared to the 19 constitutive promoters of the YTK system also driving the expression of sfGFP, integrated at the URA3 locus of yWS677. The gray ellipse highlights 4 constitutive promoters with similar expression levels to the 3 genes; pSAC6, pPOP6, pRNR2, and pRAD27. (F) An expanded promoter/terminator library including all 6 terminators within the YTK toolkit in combination with the pSAC6, pPOP6, pRNR2, and pRAD27 promoters to provide a larger profile of sfGFP expression levels to match with the native expression of STE2, GPA1, and STE12. (G) Selection of promoter/terminator combinations both unique to each other and similar to native expression of STE2 (green), GPA1 (blue), and STE12 (purple) chosen for the initial refactoring of the minimized pheromone response pathway (Figure 3, Design 1). (H) Characterizing two of the most used pheromone responsive promoters. ɑ-factor dose-response curve of the pheromone response pathway Quasi-WT background using the FUS1 and FIG1 promoters. As pFUS1 demonstrated more intrinsic leak this promoter was used to explore points of tuning in the pheromone response pathway, as discreet changes would be more measurable. Experimental measurements are sfGFP levels per cell determined by flow cytometry and shown as the mean ± standard deviation from triplicate isolates. Curves were fitted using GraphPad Prism variable slope (four parameter) nonlinear regression fit.
Figure 2
Figure 2
Model-Guided Tuning for Optimal G Protein Signaling (A) Cubic ternary complex model of G protein signaling in the minimized pheromone response pathway. (B) The minimized α-factor signaling pathway. Binding of the ligand (α-factor) to its specific GPCR (Ste2) on the cell surface leads to GDP-GTP exchange on the Gɑ subunit (Gpa1) and the release of the Gβγ dimer (Ste4 and Ste18), recruiting the MAP-kinase cascade to the membrane and facilitating the induction of the pathway via Ste20, ultimately resulting in the phosphorylation of the Ste12 transcription factor to induce gene expression via the pheromone responsive FUS1 promoter. (C) Promoter combinations used for refactoring Ste2, Gpa1, and Ste4-2A-Ste18. (D) α-Factor dose-response characteristics from individually varying the GPCR (green), Gα (blue), and Gβγ (gray) concentrations computationally and expression levels experimentally. (E) Analysis of dose-response characteristics, demonstrating trends in the expression profiles of the refactored signaling components. Sensitivity is defined as the lowest concentration to produce a 2-fold change in GFP expression over background. See Figure S3 for a quantitative plot of Ste2, Gpa1, and Ste4-2A-Ste18 expression versus pathway output. Experimental measurements are sfGFP levels per cell determined by flow cytometry and shown as the mean ± SD from triplicate isolates. Curves were fitted using GraphPad Prism variable slope (four parameter) nonlinear regression fit. See also Figure S2.
Figure S3
Figure S3
Quantitative Plots of Ste2, Gpa1, and Ste4-2A-Ste18 Expression versus Pathway Output, Related to Figure 2 (A) ɑ-factor dose-response of the minimized pathway designs where the intracellular levels of GPCR are varied using a promoter library driving the expression of Ste2. Promoter identity is plotted as heatmap of GFP fluorescence from data in Figure S2B. Experimental measurements are sfGFP levels per cell determined by flow cytometry and shown as the mean ± standard deviation from triplicate isolates. Curves were fitted using GraphPad Prism variable slope (four parameter) nonlinear regression fit. (B) Sensitivity of the Ste2 pathway variants to ɑ-factor. Sensitivity was determined from the fitted curve, defining sensitivity as the lowest concentration for which a > 2-fold change in GFP expression is seen. (C) Experimental ON/OFF response of the minimized pathway designs where the intracellular levels of Gɑ are varied using a promoter library driving the expression of Gpa1. (D) Experimental maximum x-fold change in signal for Gpa1 promoter library. (E) Experimental ON/OFF response of the minimized pathway designs where the intracellular levels of Gβγ are varied using a promoter library driving the expression of Ste4-2A-Ste18. (F) Experimental maximum x-fold change in signal for Ste4-2A-Ste18 promoter library. Promoter identity is plotted as x-value of GFP fluorescence from data in Figure S2B. Curves fitting using a 6th order smoothing polynomial with 3 neighbors on each side. Experimental measurements are sfGFP levels per cell determined by flow cytometry and shown as the mean ± standard deviation from triplicate isolates.
Figure S4
Figure S4
Redirecting the Pheromone Response to Synthetic Promoters, Related to Figure 3 (A+B) Experimental changes to the expression of Ste12. (A) A library of 17 constitutive promoters, from the YTK system, driving the expression of Ste12 with and without the overexpression of Dig1 and Dig2 in all combinations. The spotted yeast are direct transformants of two plasmids; the first containing the refactored pathway, with Ste12 under varying strengths of promoter, and the second containing either a blank spacer sequence, Dig1, Dig2, or Dig1 and Dig2 under the control of strong promoters. In the absence of Dig1 or Dig2 overexpression, expressing Ste12 with anything greater than a low-medium strength promoter was toxic to the cells. (B) It has previously been reported that Dig1 and Dig2 sit in a fine balance with Ste12, and the presence of these two negative regulators positively affect transcription by stabilizing inactive Ste12 (Houser et al., 2012). These data support these findings and suggests that increasing the concentration of Ste12 in the cells may lead to a large pool of unregulated transcription factor that may be constitutively activating the 100+ genes usually upregulated in the pheromone response, leading to cellular burden and toxicity (Dolan and Fields, 1990). As there is a fine balance between Ste12 and the two negative regulators, tuning the maximum signal output via the expression of Ste12 would require parallel tuning of both Dig1 and Dig2. Due to the combinatorial complexity of this problem we chose alternative approaches for modulating the signal amplitude and kept the expression Ste12 and synthetic transcription factors fixed at low levels using the RAD27 promoter. (C) Decoupling the pheromone response pathway from PRE-containing genes using the LexA-PRD transcription factor targeting a synthetic promoter (LexO(6X)-pLEU2m). Fold-change in transcription of the refactored components, STE2, GPA1 and STE2/sTF, the negative regulators of Ste12, DIG1 and DIG2, and several of the most highly-upregulated genes in the pheromone response, FIG1, PRM2, CIK1 (Su et al., 2010), in the Quasi-WT and Design 4 strains, with and without pheromone induction, as determined by RT-qPCR. The dotted line represents no fold-change. (D-G) Sensitivity of the Quasi-WT response is largely due to Ste12-mediated transcriptional feedback of Ste2, Gpa1, and Ste12. (D) Native transcriptional feedback of the Ste2, Gpa1, and Ste12 in the pheromone response pathway after stimulation. (E) Linear range within a time-course experiment measuring sfGFP fluorescence from STE2, GPA1, and STE12 regulatory elements after stimulation with 100 nM ɑ-factor, fitted with a linear curve. The third minimized pathway (Figure 4C, Design 3) was used to upregulate native gene expression in response to ɑ-factor. (F) Model of Ste2 and Gpa1 feedback using different strengths of positive feedback on the expression of Ste2 and Gpa1, using values for Ste2 feedback 1 order of magnitude greater than Gpa1 as determined by the time-course experiments. (G) Reconstructing the Quasi-WT response in the first minimized pathway design by introducing transcriptional feedback of Ste2, Gpa1, and Ste12, controlled by the pheromone inducible FUS1 promoter. The differences between Design 1 and Quasi-WT seems to be largely due to the positive feedback of native Ste12-activated promoters for Ste2, Gpa1, and Ste12. (H) Overexpression of Ste2 in the Design 4 strain with one or two additional integration vectors expressing Ste2 from a strong promoter (pCCW12). Although 2x and 3x Ste2 should be present in the system, the activation at 1e-10 M ɑ-factor remains unchanged. This also seems to be the limit for the Quasi-WT response, suggesting the receptor is at the physical limit of ɑ-factor detection and further Ste2 in the system will not be able to detect lower than this value. (I+J) Growth rates of the wild-type, model, and refactored strains. (I) Growth rates of the base strains, demonstrating no significant difference between BY4741 parental strain and the yWS677 strain. However, a significant increase in growth was seen in the yWS1922 strain compared to both BY4741 and yWS677. (J) Growth rates of the Quasi-WT and Design 4 Ste2 overexpression strains, demonstrating no significant difference between the four strains. Experimental measurements are sfGFP levels per cell determined by flow cytometry and shown as the mean ± standard deviation from triplicate isolates. Unless indicated, curves were fitted using GraphPad Prism variable slope (four parameter) nonlinear regression fit. GraphPad Prism one-way analysis of variance (ANOVA) used to determine statistical significance between growth rates (p < 0.05, ∗∗p < 0.005, ∗∗∗p < 0.0005).
Figure 3
Figure 3
Modulating the Maximum Pathway Output Using Synthetic Transcription Factors (A) The native pheromone-responsive transcription factor, Ste12, composed of a DNA binding domain (DBD; 1-215) and pheromone-responsive domain (PRD; 216-688), targets a mating response gene via the pheromone-response element (PRE). (B) sTFs are created from fusion of orthogonal DBDs and the Ste12 PRD that can then be targeted to synthetic promoters. (C) Fusion of the full-length bacterial LexA repressor with the Ste12 PRD controls the expression of a modular promoter with an interchangeable UAS and core promoter region, upstream of sfGFP. (D and E) Maximum α-factor-activated pathway expression mediated by the LexA-PRD sTF driving the expression from synthetic promoter variants with UAS (D) and core promoter (E) modules modified, respectively. (F) Fusion of the TetR bacterial repressor with the Ste12 PRD targets a synthetic promoter with 7 repeats of the TetO binding site and the minimal LEU2 promoter, driving aTc-repressible expression of sfGFP. (G) Inducing maximum α-factor-induced expression of the TetR-PRD-mediated signaling pathway over a range of aTc concentrations. (H) α-Factor dose-response curve of the TetR-PRD-mediated pathway with and without aTc. (I) A fusion of the PRD to the Z3E transcription factor (itself a fusion of Zif268 DBD and the human estrogen receptor ligand binding domain) targets the pZ3 promoter (a modified GAL1 promoter with six Zif268 binding sites) (McIsaac et al., 2014) driving β-estradiol-conditional expression of sfGFP. (J) Inducing maximum α-factor-induced expression of the Z3E-PRD-mediated signaling pathway over a range of β-estradiol concentrations. (K) α-Factor dose-response curve of the Z3E-PRD-mediated pathway with and without β-estradiol. Experimental measurements are sfGFP levels per cell determined by flow cytometry and shown as the mean ± SD from triplicate isolates. Curves were fitted using GraphPad Prism variable slope (four parameter) nonlinear regression fit. See also Figure S4.
Figure 4
Figure 4
Tuning the Minimized Response Pathway through Iterative Refactoring (A) α-Factor dose-response curves for the 4 sequential minimized pathway designs compared to the Quasi-WT response. (B) Dose-response characteristics for the 4 minimized pathway designs compared to Quasi-WT. Tightness is defined as the reciprocal of basal activity and the dynamic range is defined as (maximum output/basal activity). Sensitivity and operational range were determined from the fitted curve, defining sensitivity as the lowest concentration for which a >2-fold change in GFP expression is seen, and operational range as the concentration span between the sensitivity and the lowest concentration that gives a GFP expression within 2-fold of the maximum. All values were then normalized to the minimum measurable value and the maximum calculated value in the dataset. (C) Domesticating the S. pombe Mam2 receptor in yWS677. The conditions identified during the 3-week optimization of the α-factor response with Ste2 receptor were directly applied to the design of the Mam2 sensor strain, enabling construction in less than a week. (D) P-factor dose-response curves of the Mam2 sensor (light blue) compared to the wild-type Mam2 response in its native S. pombe background (black) using previously obtained data from Croft et al. (2013). Slight differences in curve shape are likely due to differences in assay length and choice of reporter. Experimental measurements are sfGFP levels per cell determined by flow cytometry and shown as the mean ± SD from triplicate isolates. S. pombe Mam2 dose-response taken from Croft et al. (2013) and represents P-factor-dependent transcription of β-galactosidase using the sxa2 promoter, taking measurements 16 h after stimulation. Curves were fitted using GraphPad Prism variable slope (four parameter) nonlinear regression fit. See also Figure S5.
Figure S5
Figure S5
Final GPCR-Based Sensor Toolkit Format, Parts List, and Workflow, Related to Figure 4 Here, a module refers to either a cassette or multigene cassette that integrates into the yeast genome at one of the 3 sites provided in the YTK system starter set (URA3, LEU2 or HO loci). All parts and cloning steps conform to the YTK MoClo standard (Lee et al., 2015). (A) A list of parts and formatting of the multigene cassette used for generating the minimized GPCR pathway (URA3 module) which integrates at the URA3 loci, indicating the instances where promoters (pYTK) and terminators (tYTK) from the YTK system are used. Spacer sequences are provided to exclude components in the instances where they are not required. Alternatively, components can be transferred to the additional LEU2 or HO modules for combinatorial pathway refactoring, to reduce cloning requirements. (B) Additional parts for use with the LEU2 and HO modules, for integrating at LEU2 and HO loci, respectively. (C) Assembling and integrating the URA3 module for generating a minimized GPCR sensor in the yWS677 model strain, following the YTK hierarchical assembly strategy (see Lee et al., 2015 for more details). (D) Multiple modules can be integrated simultaneously with the aid of CRISPR/Cas9-mediated DSB at the URA3, LEU2 and HO landing pads. Once co-transformed with the other modules, the transient expression of Cas9 and appropriate gRNAs (no yeast marker or replicon) significantly increases the efficiency of double and triple plasmid integrations to practical levels (See Figures S1F and S1G).
Figure S6
Figure S6
Linearizing and Digitizing the A2BR and MTNR1A Sensors Using Intracellular Feedback Loops, Related to Figure 5 (A-D) Screening the A2BR and MTNR1A receptors against a chimeric Gpa1-Gɑ library to identify optimal coupling to the pheromone response pathway. Sensors were created using the optimized conditions identified for Design 4, taking less than a week to create. (A) Coupling of the A2BR receptor to the Gpa1-Gɑ library in the presence and absence of saturating concentrations of adenosine (100 μM). (B) Coupling of the MTNR1A receptor to the chimeric Gpa1-Gɑ library in the presence and absence of saturating concentrations of melatonin (100 μM). As the wild-type Gpa1 coupled well to both A2BR and MTNR1A all future experiments were performed using this G protein. (C) Adenosine dose-response curve of the A2BR sensor strain, demonstrating a comparatively high Hill slope. (D) Melatonin dose-response curve of the MTNR1A sensor strain, demonstrating a comparatively low Hill slope. (E-L) Overlaying synthetic feedback (FB) loops onto the minimized sensing pathway to achieve linearization and digitization of A2BR and MTNR1A, respectively. (E) Negative feedback loops using the expression of Sst2, Gpa1, Msg5, and Dig1 as an output of pathway activation (Bardwell, 2004, Bashor et al., 2008, Galloway et al., 2013). (F+G) Feedback of negative regulators of the pheromone response pathway to linearize the dose-response of the A2BR receptor. (H) Hill slope values from the normalized curves of the 4 negative feedback conditions and no feedback control. Although feedback of the negative regulators had a significant impact on the response, when the output of each response was normalized, the effect on the Hill slope was minimal. (I) Positive feedback loops using the expression of Ste50, Ste4-2A-Ste18, and MTNR1A receptor as an output of pathway activation (Bardwell, 2004, Bashor et al., 2008, Galloway et al., 2013). Although Ste11 has been demonstrated as a viable candidate for positive feedback, it was omitted from the list as it was also shown to cause a large fitness defect when used in this manner (Ingolia and Murray, 2007). (J+K) Feedback of positive regulators of the pheromone response pathway to digitize the dose-response of the MTNR1A receptor. (L) Hill slope values from the normalized curved of the three positive feedback conditions and no feedback control. Feedback of these signaling components had a very small effect on the response of the system. Experimental measurements are sfGFP levels per cell determined by flow cytometry and shown as the mean ± standard deviation from triplicate isolates. Curves were fitted using GraphPad Prism variable slope (four parameter) nonlinear regression fit.
Figure 5
Figure 5
Engineered Consortia for Tuning the Operational Range of Heterologous GPCR Sensors (A) Engineered cells combined to produce a system with an extended operational range. First, a range of cells are produced with different sensitivities to a ligand by expressing the GPCR at different levels. Second, the ligand responses are tuned to produce equivalent maximum outputs. Third, the cells are combined in equal parts to create a mixed population of cells whose average expression has an extended operational range. (B) The dose-response of the human A2BR receptor to adenosine in a single yeast strain, operational over 1.6 orders of magnitude. (C) The extended dose-response of a consortia of three engineered strains, operational over 3.3 orders of magnitude. (D) A mixed population of yeast strains engineered as amplifier and reporters is designed to create a digital response from an otherwise linear sensor. In response to ligand, amplifier cells release α-factor that is detected by reporter cells constitutively secreting the α-factor degrading protease, Bar1. The presence of Bar1 degrades low levels of α-factor preventing reporter strain activation until levels of α-factor are high enough to saturate the capacity of Bar1-mediated degradation. (E) Computational model of the amplifier-reporter system response to increasing ligand (L) with Bar1-mediated threshold response included. (F) The broad dose-response of the human MTNR1A receptor to melatonin, operational over 3.8 orders of magnitude. (G) Digitized melatonin sensing with the two-strain system, operational over 1.5 orders of magnitude. Operational range is defined as the concentration span between 5% and 95% of the activated response. Experimental measurements are sfGFP levels determined by a plate reader and shown as the mean ± SD from triplicate isolates. Curves were fitted using GraphPad Prism variable slope (four parameter) nonlinear regression fit. See also Figures S6 and S7.
Figure S7
Figure S7
Linearizing and Digitizing the A2BR and MTNR1A Response, Respectively, Related to Figure 5 (A+B) Unnormalized sfGFP fluorescence is used to account for differences in growth rate between strains. (A) Adenosine dose-response of several adenosine sensors expressing A2BR using the weak RPL18B (low sensitivity), medium HHF2 (mid sensitivity), and strong CCW12 (high sensitivity) promoters. Experimental measurements are sfGFP levels per cell determined by flow cytometry and shown as the mean ± standard deviation from triplicate isolates. (B) Adenosine dose-dependent OD measurements of the three different sensitivity A2BR sensor strains after the standard 6 h assay time. To account for any differences in the growth rate between the different strains when activated or inactive, all future sfGFP measurements for experiments using microbial consortia were taken as the unnormalized fluorescence of the population using a plate reader. All strains set up at the starting OD of 0.175 at time 0 h and measurements were taken at 6 h. In this way, sfGFP fluorescence represents both growth rate and sfGFP production rate. (C-E) Tuning the expression of Bar1 in the two-cell amplifier-reporter system. (C) Varying the concentration of Bar1 in the two-cell amplifier-reporter model. (D) Experimentally varying the expression of Bar1 in the two-cell amplifier-reporter system using a select promoter library. (E) Hill slope values from computationally and experimentally varying the levels of Bar1 in the amplifier-reporter system. (F-H) Digitizing and fine-tuning the MTNR1A sensor response. (F) Melatonin dose-response of the MTNR1A sensor strain in a monogenic population of cells. (G) Digitization of the MTNR1A response via ɑ-factor mediated cell-cell communication. In response to melatonin, the first cell produces large quantities of ɑ-factor peptide that is then detected by the second cell, which responds by producing sfGFP. (H) Fine tuning the MTRN1A digital response by reducing the receptor expression in the first cell, so that the logEC50 matches the response of the single cell system. By lowering the expression of the MTNR1A receptor in the first cell using the ALD6 promoter, we were able to shift the potency (logEC50) of the melatonin dose-response right by 1.5 orders of magnitude, to match the potency of the first, single cell system, while maintaining a high Hill slope. Data normalized to the minimum and maximum values within each dataset. Unnormalized, raw fluorescence readings were taken using a plate reader to account for growth during the 6h assay. Results are means ± standard deviation from triplicate isolates. Experimental measurements are sfGFP levels determined by a plate reader and shown as the mean ± standard deviation from triplicate isolates. Curves were fitted using GraphPad Prism variable slope (four parameter) nonlinear regression fit.
Figure 6
Figure 6
Applications of Tunable Yeast GPCR Sensor Strains (A) Selectivity of the MTNR1A sensor strain to melatonin and intermediates in the melatonin biosynthesis pathway from Germann et al. (2016). (B) A linearized MTNR1A sensor population consisting of two strains with different sensitives to linearize the dose-response of melatonin sensing in the range of concentrations appropriate for microbial production as reported by Germann et al. (C) Measuring the production of melatonin from the spent media of 88 different yeast producer strains using the MTNR1A sensor consortia and LC-MS. (D) The measured production of melatonin from the 88 producer strains, from Germann et al. (2016), as determined from measurements from the sensor consortia and LC-MS. A linear y = x curve was fitted to the dataset. (E) Detection of the P. brasiliensis pheromone peptide (PbPeptide) using the P. brasiliensis Ste2 homolog (PbSte2). (F and G) PbPeptide dose-response of the single cell PbSte2 sensor (F) compared to the two-cell amplifier-receiver consortia (G). (H) Potency (logEC50), Hill slope, and operational range values of the single and mixed cell populations compared to data from Ostrov et al. (2017). Experimental measurements are sfGFP levels per cell determined by flow cytometry (A–D) and GFP levels determined by a plate reader (E–H) and shown as the mean ± SD from triplicate isolates. Curves were fitted using GraphPad Prism variable slope (four parameter) nonlinear regression fit. See Table S1 for a list of GPCRs shown to functionally couple in S. cerevisiae that could be used for sensor applications.

Comment in

References

    1. Adeniran A., Sherer M., Tyo K.E.J. Yeast-based biosensors: design and applications. FEMS Yeast Res. 2015;15:1–15. - PubMed
    1. Adeniran A., Stainbrook S., Bostick J.W., Tyo K.E.J. Detection of a Peptide Biomarker by Engineered Yeast Receptors. ACS Synth. Biol. 2018;7:696–705. - PMC - PubMed
    1. Aldridge B.B., Burke J.M., Lauffenburger D.A., Sorger P.K. Physicochemical modelling of cell signalling pathways. Nat. Cell Biol. 2006;8:1195–1203. - PubMed
    1. Alvaro C.G., Thorner J. Heterotrimeric G Protein-coupled Receptor Signaling in Yeast Mating Pheromone Response. J. Biol. Chem. 2016;291:7788–7795. - PMC - PubMed
    1. Andrianantoandro E., Basu S., Karig D.K., Weiss R. Synthetic biology: new engineering rules for an emerging discipline. Mol. Syst. Biol. 2006;2 2006.0028. - PMC - PubMed

Publication types

MeSH terms