. 2019 Apr 22;29(8):1379-1386.e4.
doi: 10.1016/j.cub.2019.03.011. Epub 2019 Apr 4.

Noisy Cell-Size-Correlated Expression of Cyclin B Drives Probabilistic Cell-Size Homeostasis in Fission Yeast

Affiliations

Noisy Cell-Size-Correlated Expression of Cyclin B Drives Probabilistic Cell-Size Homeostasis in Fission Yeast

James O Patterson et al. Curr Biol. .

Abstract

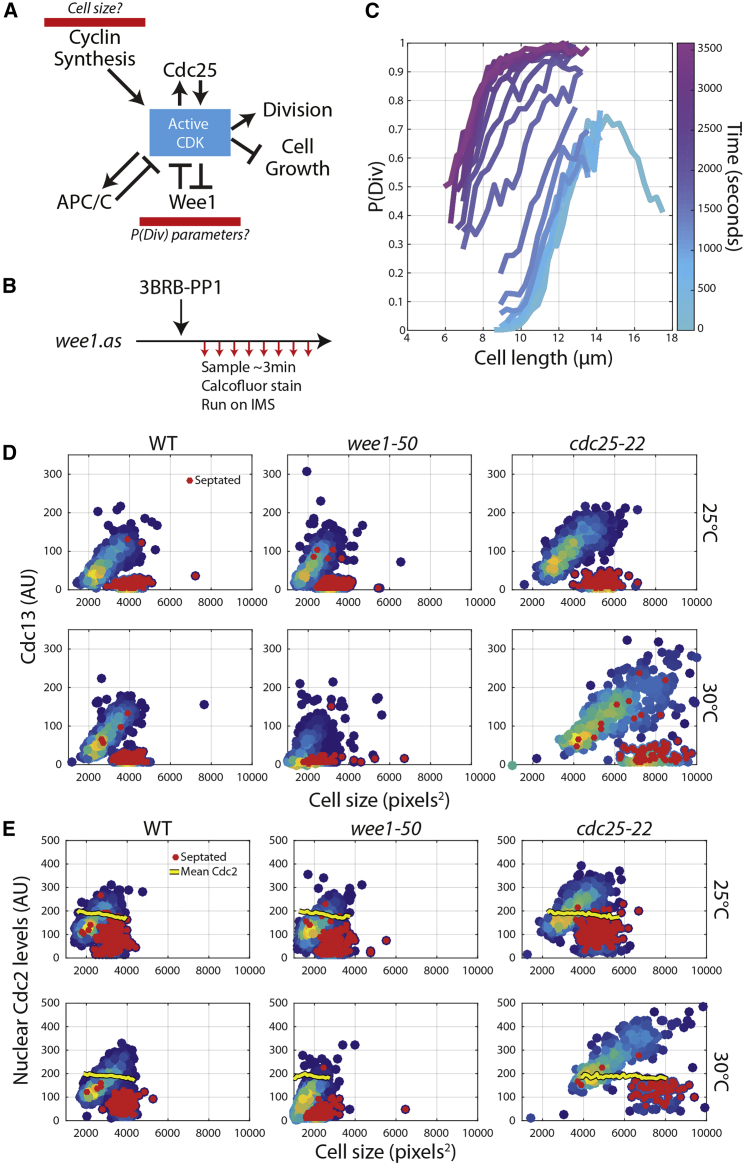
How cells correct deviations from a mean cell size at mitosis remains uncertain. Classical cell-size homeostasis models are the sizer, timer, and adder [1]. Sizers postulate that cells divide at some threshold size; timers, that cells grow for a set time; and adders, that cells add a constant volume before division. Here, we show that a size-based probabilistic model of cell-size control at the G2/M transition (P(Div)) can generate realistic cell-size homeostasis in silico. In fission yeast cells, Cyclin BCdc13 scales with size, and we propose that this increases the likelihood of mitotic entry, while molecular noise in its expression adds a probabilistic component to the model. Varying Cdc13 expression levels exogenously using a newly developed tetracycline inducible promoter shows that both the level and variability of its expression influence cell size at division. Our results demonstrate that as cells grow larger, their probability of dividing increases, and this is sufficient to generate cell-size homeostasis. Size-correlated Cdc13 expression forms part of the molecular circuitry of this system.

Keywords: CDK; cell division; cell growth; cell size; cyclin; cyclin-dependent kinase; mitosis; single-cell biology; systems biology.


Figures

None
Graphical abstract
Figure 1
Figure 1
A P(Div) Model of Cell Size Control Generates Cell-Size Homeostasis (A) Schematic of the P(Div) model. The basis of the model is that as cells grow larger, their probability of division increases. (B) Plot of the fraction of septated cells (a surrogate for P(Div)) for WT cells grown in Edinburgh minimal media (EMM) at 32°C. Data were acquired on an Imagestream system following calcofluor staining. Red points indicate the proportion of cells within a 1 μm size bin that are septated. The black line represents a Hill curve fit to the red data points by non-linear fit within MATLAB. Hill coefficient = 10.25, EC50 = 12.6, N = 275087. (C) Relative frequency plot of cell size at division from simulated data. Simulations are initiated with 20 cells roughly at the mean birth size and run for 1,000 min. All cells grow according to an exponential function that results in size doubling within ∼120 min. Simulations result in >1,000 individual full cell cycles. The probability of cell division at a certain cell size is sampled from a Hill curve with a maximum probability of 0.1, EC50 of 14, and Hill coefficient of 14. (D) Fantes plot of cell-size homeostasis. Data points are colored by the density of points. The cell population is simulated as in (C). (E) P(Div) plots derived from simulation data. Div/min curve is not experimentally accessible, and P(Sept) curve is equivalent to data shown in (B). The cell population is simulated as in (C). (F) Generalized schematic of the P(Div) model as a dose response function with size as input and P(Div) as output. (G) Plot of a Hill function with Hill coefficient = 14 and EC50 varied. (H) Plot of a Hill function with EC50 = 10 and Hill coefficient varied. (I) Heatmaps of relevant extracted cell-size control parameters when Hill coefficient and EC50 are varied in silico. In silico cell growth proceeds as in (E). See also Figure S1, Table S1, and Data S1.
Figure 2
Figure 2
The Cell-Cycle Control Network Could Provide a Molecular Explanation for the P(Div) Model of Cell-Size Control (A) Potential molecular inputs that would explain the P(Div) model. (B) Schematic of the experiment. Wee1.as cells were grown in EMM at 25°C. Time 0 corresponds to the addition of 3BRB-PP1 to the culture flask. Cells were subsequently sampled and prepared for IMS acquisition every ∼3 min. (C) P(Div) curves from each sample time point with time of sampling from addition of 3BRB-PP1 indicated by the color of the line. N > 5,000 cells per line. (D) Cdc13 levels presented here are derived from mean nuclear intensity. Septation state is assigned from calcofluor stained images and is marked by red data points. Colors of other data points indicate the density of the data point (dark blue, few; yellow, many). Cells were grown in EMM and at permissive (25°C) and semi-permissive (30°C) as annotated. N > 500 cells for all strains. (E) Scatterplots of nuclear Cdc2-sfGFP levels versus cell size in annotated mutants and temperatures. The yellow line represents the rescaled mean intensity of Cdc2-sfGFP (window size, 100 pixels2). The mean has been rescaled so that it can be observed on the same plot as the scatter of mean nuclear Cdc2-sfGFP levels. Septation state is assigned from calcofluor stained images and is marked by red data points. Colors of other data points indicate the density of the data point. Cells were grown in EMM and at permissive (25°C) and semi-permissive (30°C) as annotated. N > 400 cells for all strains. See also Figure S2, Table S1, and Data S1.
Figure 3
Figure 3
Heterogeneity in Cdc13 Levels Could Explain the Increasing P(Div) with Cell Size (A) Schematic of the experiment. Cells are shifted to 30°C for a short period of time to inhibit division (see example image). The scale bar indicates 10 μm. (B) Scatterplot of Cdc13 levels versus cell size. The subplot above the large plot indicates mean Cdc13 levels within the 8 annotated bins. Error bars indicate the standard deviation of data within the bin. N > 500 cells for each condition. (C) Relative frequency plots of Cdc13-sfGFP levels within annotated size bins in (B), and relative frequency plots are kernel density plots. (D) Scatterplot of Cdc13 fluorescence versus size focused on the region containing the dividing cell. Solid, colored lines represent the calculated within-size-bin Cdc13 threshold required to trigger anaphase (calculated as the mean of the brightest 10 cells within the bin). The dashed black line represents the calculated mean threshold of the intra-size-bin thresholds (180 AU). (E) P(Septation) is calculated as the proportion of cells within the size bin at 25°C that feature a septum. The scatterplot of P(Septation) versus P(Cdc13 > Threshold) is shown, with color indicating the corresponding size bin. (F) P(Equal Cdc13) is calculated as the proportion the 25°C Cdc13-sfGFP population with intensities falling within the yellow bar in (C)—purple line. P(Cdc13 > Threshold) is calculated as the proportion of cells at 30°C with Cdc13 levels >180 AU. The scatterplot of P(Equal Cdc13) versus P(Cdc13 > Threshold) is shown, with color indicating the corresponding size bin. See also Table S1 and Data S1.
Figure 4
Figure 4
Variability in Cdc13 Levels Is Rate Limiting for Cell-Size Fidelity at G2/M (A) Schematic of the experiment. Cells are grown in EMM+L to steady state at 25°C and are subsequently washed and grown in 2.5 × 10−3 μg/mL tet overnight before imaging. (B) Example stills from imaged cells. The scale bar indicates 10 μm. (C) Scatterplots of Cdc13-sfGFP levels versus cell size in WT and tet-dosed cells. The yellow bar is placed at the 1st decile of cell size at division. N > 500 cells for each condition. Black overlaid data points indicate septation. Red data points, 25°C; blue data points, 30°C. (D) Boxplot of cell size at division in annotated strains and tet concentrations. (E) Boxplot Cdc13-sfGFP levels in 30°C condition at size corresponding to yellow line in (B) +/−100 pixels2. (F) Plot of 1st decile of cell size at division versus mean Cdc13-sfGFP levels from distribution in (D) and (E). Colors indicate the tet concentration (and the red point indicates the WT cell). (G) Plot of CoV of size at division versus CoV of Cdc13-sfGFP levels from distribution in (D) and (E). Colors indicate the tet concentration (and the red point indicates the WT cell). See also Figures S3 and S4, Table S1, and Data S1.

References

    1. Wood E., Nurse P. Sizing up to divide: mitotic cell-size control in fission yeast. Annu. Rev. Cell Dev. Biol. 2015;31:11–29. - PubMed
    1. Wood E., Nurse P. Pom1 and cell size homeostasis in fission yeast. Cell Cycle. 2013;12:3228–3236. - PMC - PubMed
    1. Martin S.G., Berthelot-Grosjean M. Polar gradients of the DYRK-family kinase Pom1 couple cell length with the cell cycle. Nature. 2009;459:852–856. - PubMed
    1. Moseley J.B., Mayeux A., Paoletti A., Nurse P. A spatial gradient coordinates cell size and mitotic entry in fission yeast. Nature. 2009;459:857–860. - PubMed
    1. Pan K.Z., Saunders T.E., Flor-Parra I., Howard M., Chang F. Cortical regulation of cell size by a sizer cdr2p. eLife. 2014;3:e02040. - PMC - PubMed

Publication types

Substances