. 2019 Apr 18;74(2):393-408.e20.
doi: 10.1016/j.molcel.2019.02.003. Epub 2019 Apr 4.

A Combined Approach Reveals a Regulatory Mechanism Coupling Src's Kinase Activity, Localization, and Phosphotransferase-Independent Functions

Affiliations

A Combined Approach Reveals a Regulatory Mechanism Coupling Src's Kinase Activity, Localization, and Phosphotransferase-Independent Functions

Ethan Ahler et al. Mol Cell. .

Abstract

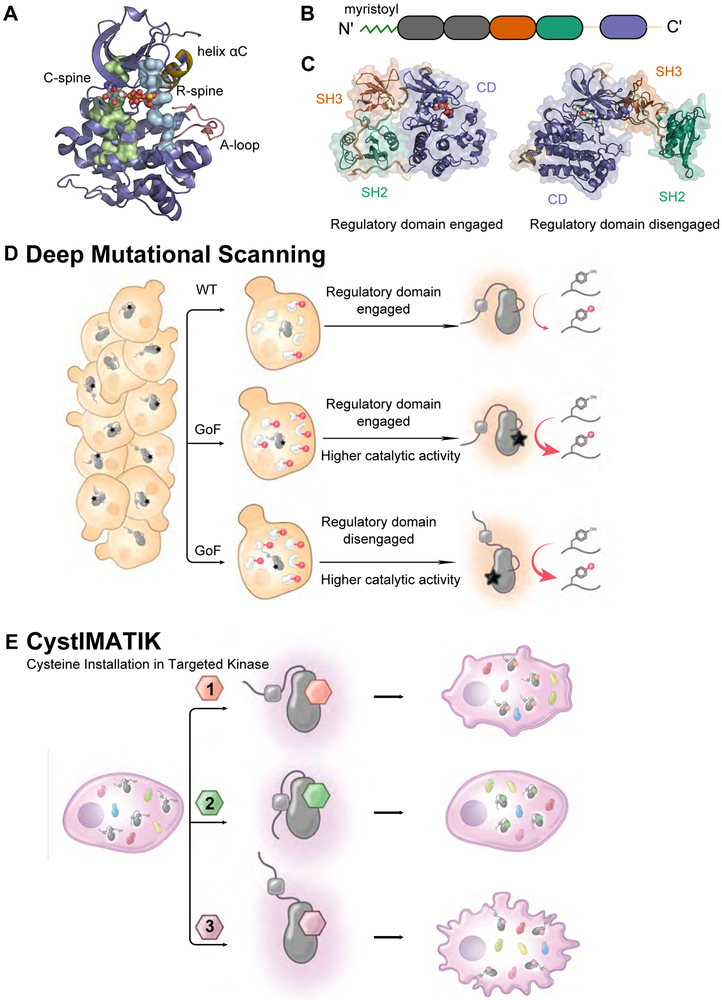
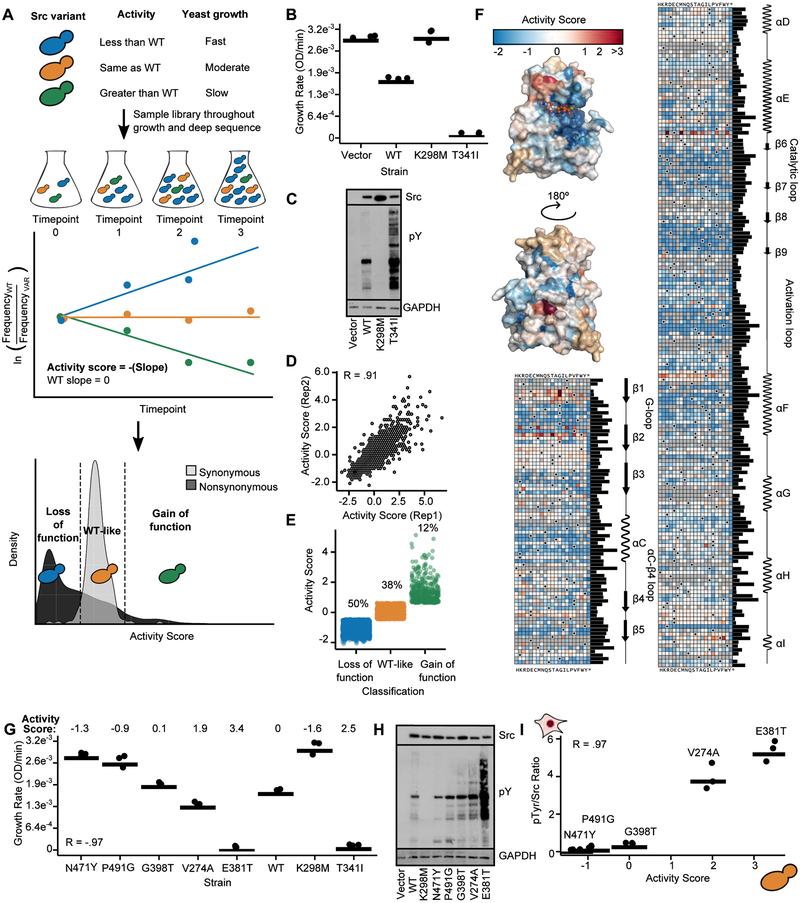
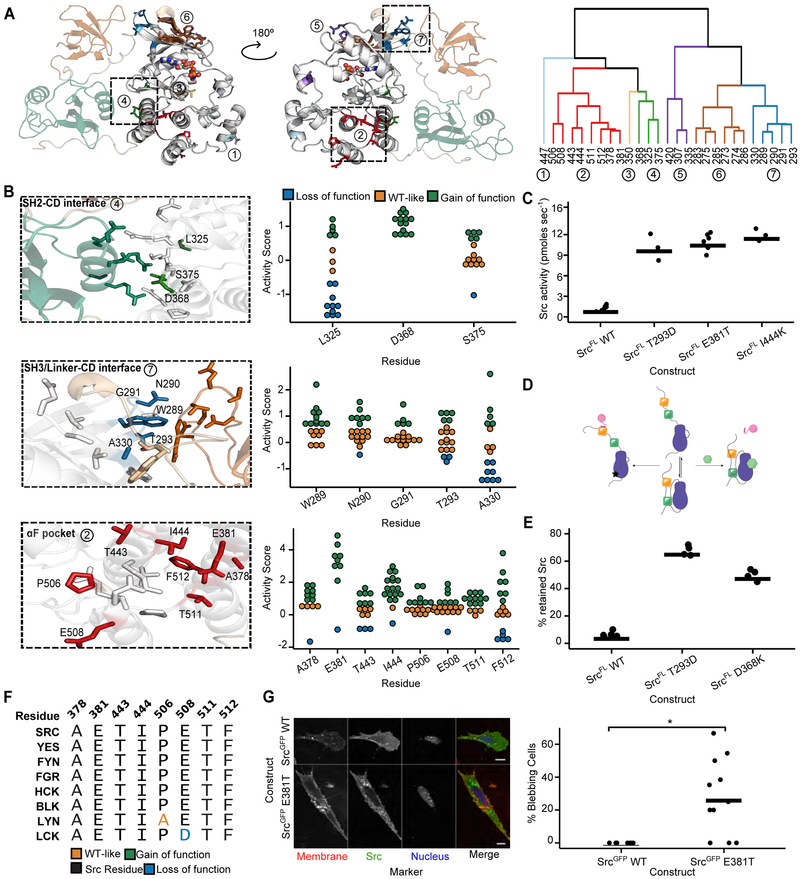
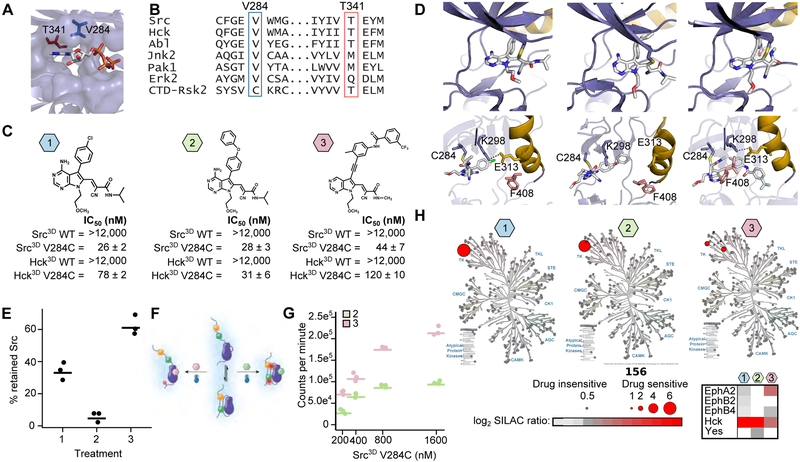
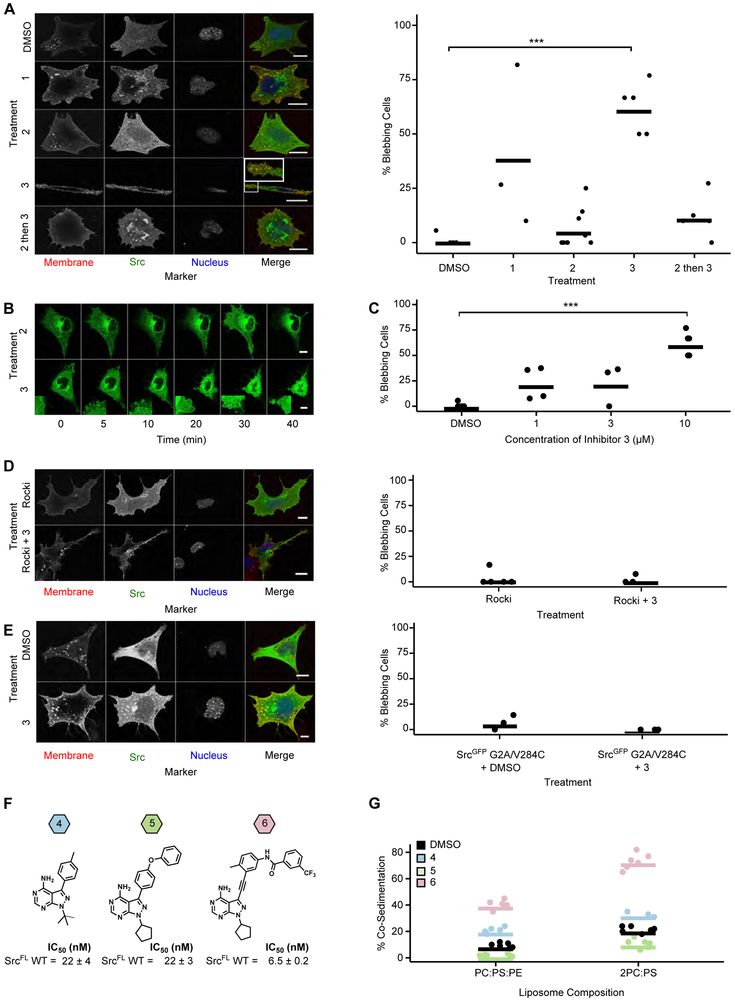
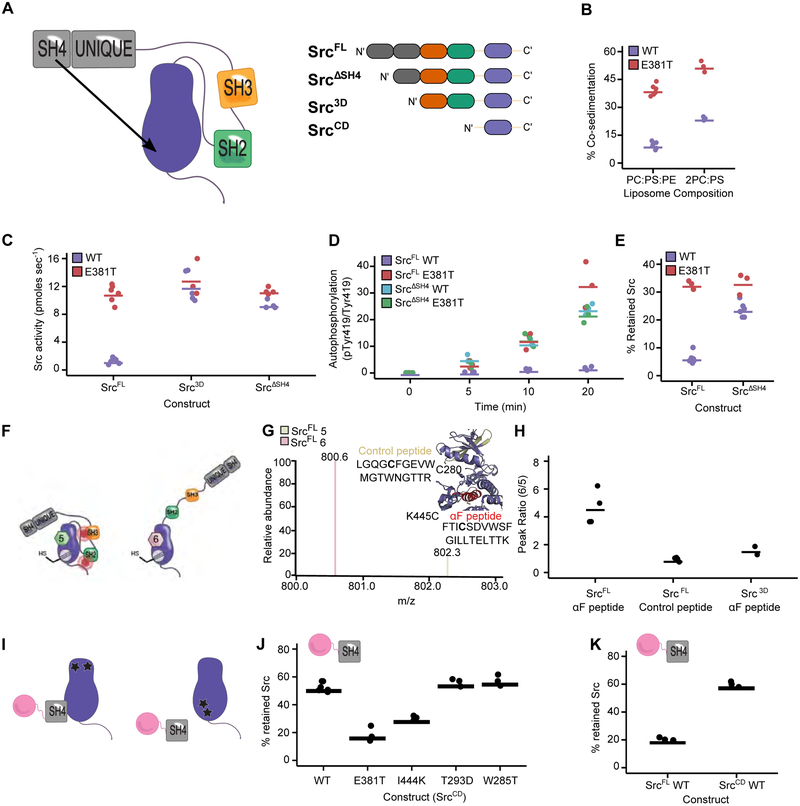
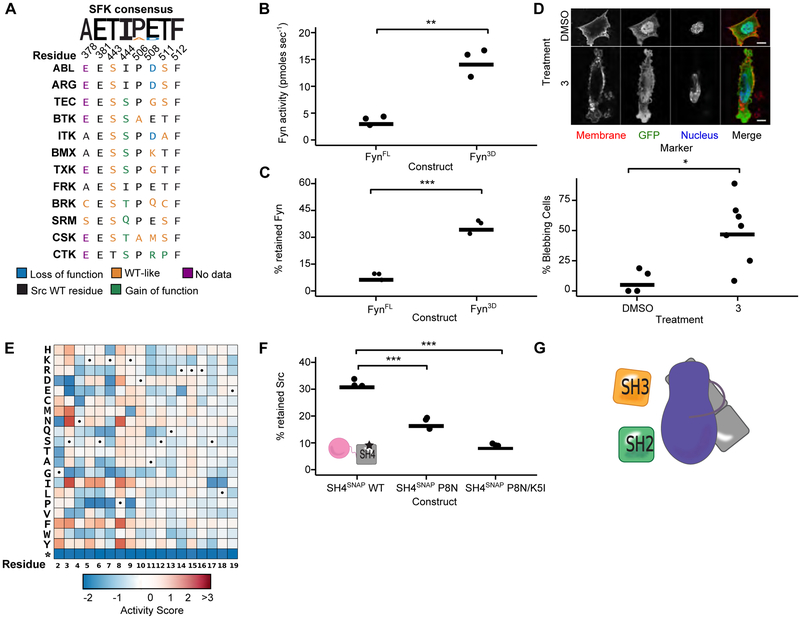
Multiple layers of regulation modulate the activity and localization of protein kinases. However, many details of kinase regulation remain incompletely understood. Here, we apply saturation mutagenesis and a chemical genetic method for allosterically modulating kinase global conformation to Src kinase, providing insight into known regulatory mechanisms and revealing a previously undiscovered interaction between Src's SH4 and catalytic domains. Abrogation of this interaction increased phosphotransferase activity, promoted membrane association, and provoked phosphotransferase-independent alterations in cell morphology. Thus, Src's SH4 domain serves as an intramolecular regulator coupling catalytic activity, global conformation, and localization, as well as mediating a phosphotransferase-independent function. Sequence conservation suggests that the SH4 domain regulatory interaction exists in other Src-family kinases. Our combined approach's ability to reveal a regulatory mechanism in one of the best-studied kinases suggests that it could be applied broadly to provide insight into kinase structure, regulation, and function.

Keywords: Src; activity; allostery; kinase; regulation.


Figures

Figure 1.
Figure 1.. Dissection of intramolecular kinase regulation using a multidisciplinary approach.
A. Structural features of Src’s catalytic domain (CD) (PDB: 3DQW), showing the C-spine (Catalytic, green), R-spine (regulatory, blue), helix αC (yellow), and the activation (A, pink)-loop. B. Linear schematic of Src kinase (Unq = Unique domain). C. Src kinase in the closed, autoinhibited (left, PDB: 2SRC) and an open (right, PDB: 1Y57) global conformation. The SH3 domain is shown in orange, the SH2 domain in green and the CD in purple. D. Deep mutational scanning for the simultaneous measurement of the activity of nearly all possible single mutants of a kinase. E. Cysteine Installation for Modulating Allostery and Targeted Inhibition of Kinases (CystIMATIK), a method for selectively modulating intramolecular regulatory domain interactions and global conformation of a drug-sensitized kinase with conformation-selective, ATP-competitive probes.
Figure 2.
Figure 2.. Multiplex measurement of the activity of 3,506 single amino acid Src variants.
A. Schematic of a yeast growth-based deep mutational scan (DMS) of the Src catalytic domain. B. Individually-assessed growth curves for yeast expressing Srcmyr WT, K298M, T341I, or a control vector (n=3). C. Src and phospho-tyrosine (pTyr) immunoblots of yeast expressing Srcmyr variants for 24 hr. D. Scatterplot showing activity score correlations between two independent transformations of the Srcmyr variant library (Pearson’s R = 0.91). E. Activity scores for variants classified as gain-of-function (n=403, green), WT-like (n=1288, orange), or loss-of-function (n=1681, blue). F. Position-averaged activity scores mapped onto the Src catalytic domain (PDB: 3DQW). Nonsense mutants were excluded from the average score. Sequence-activity map of Src catalytic domain. Black dots in the map indicate the WT amino acid, gray tiles indicate missing data. Bar graph indicates relative evolutionary conservation at each position as determined by Kullback-Leibler entropy. Secondary structure and functional motif annotations were obtained from the ProKinO database. G. Dot plot of individually assessed growth rates compared to activity scores for a panel of Srcmyr variants (n=3; Pearson’s R = −.97). Growth rates for WT, K298M, and T341I from Figure 2B are shown for comparison. H. Src and phospho-tyrosine immunoblots of yeast expressing Srcmyr variants. I. Correlation between yeast DMS-derived activity scores and the ratio of phospho-tyrosine/Src levels in HEK293Ts for a panel of Srcmyr variants (n=3; Pearson’s R = 0.97; Figures S1E, S1F). Points represent individual measurements and the horizontal lines indicate the mean of all measurements. See also Figure S1, Tables S2 and S3.
Figure 3.
Figure 3.. Large-scale mutagenesis data reveal Src’s regulatory interfaces.
A. Hierarchical clustering of Src residues with at least five gain-of-function mutations based on spatial coordinates of the atomic centroids of each sidechain (right panel) projected onto the Src structure (left panel, PDB: 2SRC). B. Structural detail (left panels) and activity scores (right panels) for every variant at each residue comprising clusters that overlap with the SH2-CD (cluster 4, top), SH3/Linker-CD (cluster 7, middle) and αF pocket (cluster 2, bottom) interfaces (PDB: 2SRC). In the left panels, CD residues that are not part of a cluster are shown in white, SH2-linker residues in tan, SH2 residues in green, and SH3 residues in orange. C. Phosphotransferase activity of purified SrcFL WT, T293D, E381T, or I444K (n=3-6). D. Schematic of the SH3 pulldown assay. To detect global conformation, Src is incubated with an immobilized SH3 domain ligand. Closed, SH3-engaged Src is unable to bind to the resin, whereas open, SH3-disengaged Src binds. After washing, retained Src is eluted and quantified by western blot or in-gel fluorescence. E. Percent retained Src in the SH3 pulldown assay with purified SrcFL WT, T293D, or D368K (n=3-6). F. Sequence alignment of Src-family kinase αF pocket residues. G. Representative micrographs (left) and percent bleb quantification (right) for SYFs expressing either SrcGFP WT or SrcGFP E381T. Scale bars = 10 μm. Each point represents a replicate transfection with multiple cells imaged and scored in a double-blind fashion. Horizontal lines indicate the mean of all replicates. See Table S5 for the total number of replicates and cells analyzed. *p <0.05. See also Figure S2.
Figure 4.
Figure 4.. Cysteine Installation for Modulating Allostery and Targeted Inhibition of Kinases (CystIMATIK).
A. Structure of the CD of Src (PDB: 2SRC) bound to AMP-PNP. Positions that are important for sensitivity to CystIMATIK probes are shown as sticks (T341 (red) and V284 (blue)). B. Sequence alignment of Src and Hck with various kinases and the C-terminal kinase domain of p90 ribosomal protein S6 kinase, CTD-RSK2. C. CystIMATIK probes 1-3. IC50 values (n=3, mean ± s.e.m), determined in the presence of 1 mM ATP, for Src3D WT, Src3D V284C, Hck3D WT, and Hck3D V284C are shown below each probe. Hck is numbered according to analogous Src residue. D. Crystal structures of the SrcCD V284C-1 (left; PDB:5SWH), SrcCD V284C-2 (middle; PDB:5TEH) and SrcCD V284C-3 (right; PDB:5SYS) complexes. Top panels: 1-3 are shown as sticks colored by atom. Bottom panels: Helix αC (yellow) and the Phe (pink) of the DFG motif are shown. C284, K298, and E313 are depicted as sticks. E. Percent retained Src in the SH3 pulldown assay for SrcFLAG V284C-expressing HEK293s treated with CystIMATIK probe 1, 2, or 3 (n=3). F. SH2 domain accessibility assay using Csk. Src3D V284C-CystIMATIK probe complexes are incubated with Csk and γ32P-ATP, and radioactive phosphate transfer to Src3D V284C is quantified. Closed, SH2-engaged Src cannot be phosphorylated by Csk whereas open, SH2-disengaged Src is efficiently phosphorylated by Csk. G. Quantification of Csk’s phosphorylation of the Src3D V284C-2 and Src3D V284C-3 complexes. H. Kinome profiling of CystIMATIK probes 1-3. Profiled kinases are represented by grey circles and interacting kinases by red circles. For interacting kinases, circle size scales with log2 SILAC ratio of DMSO control over 10 μM of each CystIMATIK probe (a mean log2 SILAC ratio >1 cut-off was applied; n=3). The heatmap shows all kinase targets for each CystIIMATIK probe. For 4E, 4G, points represent individual measurements and the horizontal lines indicate the mean of all measurements. See also Figure S3 and Table S7.
Figure 5.
Figure 5.. Conformational changes at the ATP-binding site drive phosphotransferase-independent cellular blebbing.
A. Representative micrographs (left) and percent bleb quantification (right) for SrcGFP V284C-expressing SYFs treated for 15 min with DMSO, CystIMATIK probe 1, 2, 3, or pre-treated with 2 for 15 min, followed by 3. B. Representative micrographs from time course experiments performed with SrcGFP V284C-expressing SYFs treated with CystIMATIK probe 2 or 3. Insets show membrane blebs. C. Percentage of SrcGFP V284C-expressing SYFs treated with 1, 3, or 10 μM 3 for 15 min showing blebs. Values for DMSO and 10 μM conditions were used previously in Figure 5A. D. Representative micrographs (left) and percent bleb quantification (right) for SrcGFP V284C-expressing SYFs pretreated with the Rock inhibitor GSK429286A, and then treated with DMSO or 3 for 15 minutes. E. Representative micrographs (left) and percent bleb quantification (right) for SrcGFP G2A/V284C-expressing SYFs treated with DMSO or 3 for 15 minutes. F. Structures of probes 4, 5, and 6 and IC50 values for SrcFL WT determined in the presence of 1 mM ATP (n=3, mean ± s.e.m). G. Quantification of Src immunoblots for co-sedimentation assays performed with apo SrcFLAG, SrcFLAG-4, SrcFLAG-5, or SrcFLAG-6, and lipsosomes composed of 1:1:1 phosphatidylcholine, phosphatidylserine and phosphatidylethanolamine (PC:PS:PE) or 2:1 PC and PS (2PC:PS) (Figures S4H, S4I). In all micrographs, scale bars = 10 μm. For 5A-5E, each point represents a replicate treatment with multiple cells imaged and scored in a double-blind fashion. See Table S5 for the total number of replicates and cells analyzed. Horizontal lines indicate the mean of all replicates. ***p < 0.001. See also Figure S4.
Figure 6.
Figure 6.. Direct interaction of the SH4 and catalytic domain regulates Src activity and dictates cellular phenotype.
A. Proposed SH4 domain “fastener” model (left) and the Src constructs used for biochemical characterization (right). B. Quantification of Src immunoblots for co-sedimentation assays performed with SrcFLAG WT or SrcFLAG E381T, and liposomes composed of PC:PS:PE or 2PC:PS. C. Phosphotransferase activity of purified SrcFL, Src3D or SrcΔSH4 with either the WT or E381T sequence. (n=4-6). Values for SrcFL WT and E381T were used previously in Figure 3C. D. Autophosphorylation quantification of SrcFL or SrcΔSH4 with either the WT or E381T sequence at various time points after ATP addition (n=3). E. Percent retained Src in the SH3 pulldown assay with purified SrcFL or SrcΔSH4 with either the WT or E381T sequence (n=3-5). Values for SrcFL WT were used previously in Figure 3E. F. Model showing the global conformation of SrcFL K445C-5 or SrcFL K445C-6. G. Isotope-coded maleimide labeling of SrcFL K445C. An example mass spectrum of the light and heavy maleimide-labeled peptide containing K445C (αF peptide). The inset shows the location of the αF and control peptides. H. Peak intensity ratios of the maleimide-labeled αF and control peptides from the SrcFL K445C-5 or SrcFL K445C-6 complexes (n=4). Peak intensity ratios of the maleimide-labeled αF peptide from the Src3D K445C-5 or Src3D K445C-6 complexes (n=2) are also shown. I. SH4 pulldown assay schematic. Src variants are incubated with the immobilized SH4 domain (residues 1-18) of Src and the amount of retained Src is quantified after washing and elution. SrcCD variants with mutations outside (left) and within (right) the αF pocket are shown. J. Percent retained Src in the SH4 pulldown assay with purified SrcCD WT, E381T, I444K, T293D, or W285T (n=3). K. Percent retained Src in the SH4 pulldown assay with purified SrcCD WT or SrcFL WT (n=3). Points represent individual measurements and the horizontal lines indicate the mean of all measurements. See also Figure S5.
Figure 7.
Figure 7.. Functional characterization of the SH4 domain/αF pocket interaction.
A. Sequence alignment of SH4 domain-lacking human non-receptor tyrosine kinases (SH4-) at αF pocket residues. Colors indicate classification of the analogous mutation from the Src DMS. B. Phosphotransferase activity of purified FynFL WT or Fyn3D WT (n=3). C. Percent retained Fyn in the SH3 pulldown assay with purified FynFL WT or Fyn3D WT (n=3). D Representative micrographs (top panel) and percent bleb quantification (bottom panel) for Fynmyr-expressing SYFs treated with DMSO or CystIMATIK probe 3 for 15 min. E. DMS of Src’s SH4 domain. Dots indicate WT amino acid at that residue. F. Percent retained SrcTAMRA-3D in an SH4 pulldown assay with immobilized WT, P8N, or P8N/K5I SH4 domain (n=3). G. Proposed model of SH4 domain-mediated autoinhibition (myristoyl (green), unstructured SH4 and Unique (gray), SH3 (orange), SH2 (green), and CD (purple)). For 7D, each point represents a replicate treatment with multiple cells imaged and scored in a double-blind fashion. Horizontal lines indicate the mean of all replicates. See Table S5 for the total number of replicates and cells analyzed. *p <0.05; **p < 0.01, ***p < 0.001. See also Figure S6.
Scheme 1:
Scheme 1:
a) Diisopropylamine, n-BuLi, ethyl formate, THF, −78 °C; b) Ammonium hydroxide, 1,4-Dioxane, 60 °C; c) K3PO4, PdCl2(dppf)2. 4-Chlorophenylboronic acid, 1, 4-Dioxane/H2O, 85 °C (microwave); d) K3PO4, PdCl2(dppf)2. 4-Phenoxyphenyl boronic acid, 1, 4-Dioxane/H2O, 85 °C (microwave); e) 2-cyano-N-isopropylacetamide, DB U, THF, RT.
Scheme 2:
Scheme 2:
a) 2-Bromoethyl methyl ether, CS2CO3, DMF, 50 °C; b) Diisopropylamine, n-BuLi, ethyl formate, THF, −78 °C to RT; c) 3-(Trifluorome thyl)benzoic acid, EDCI, HOAt, DMF, RT; d) KF, MeOH, RT; e) PdCl2(PPh3)2, CuI, Et3N, DMF, 50 °C; f) 2-Cyano-N-methylacetamide, DBU, THF, RT.

References

    1. Bjorge JD, Bellagamba C, Cheng H-C, Tanaka A, Wang JH, and Fujita DJ (1995). Characterization of Two Activated Mutants of Human pp60c-srcThat Escape c-Src Kinase Regulation by Distinct Mechanisms. Journal of Biological Chemistry 270, 24222–24228. - PubMed
    1. Boggon TJ, and Eck MJ (2004). Structure and regulation of Src family kinases. Oncogene 23, 7918–7927. - PubMed
    1. Charras GT (2008). A short history of blebbing. J Microsc 231, 466–478. - PubMed
    1. Devkota S, Joseph RE, Boyken SE, Fulton DB, and Andreotti AH (2017). An Autoinhibitory Role for the Pleckstrin Homology Domain of Interleukin-2-Inducible Tyrosine Kinase and Its Interplay with Canonical Phospholipid Recognition. Biochemistry 56, 2938–2949. - PMC - PubMed
    1. Florio M, Wilson LK, Trager JB, Thorner J, and Martin GS (1994). Aberrant protein phosphorylation at tyrosine is responsible for the growth-inhibitory action of pp60v-src expressed in the yeast Saccharomyces cerevisiae. Molecular Biology of the Cell 5, 283–296. - PMC - PubMed

Publication types

Substances