. 2019 Apr 16;27(3):940-954.e6.
doi: 10.1016/j.celrep.2019.01.009. Epub 2019 Apr 4.

Transfer of Functional Cargo in Exomeres

Affiliations

Transfer of Functional Cargo in Exomeres

Qin Zhang et al. Cell Rep. .

Abstract

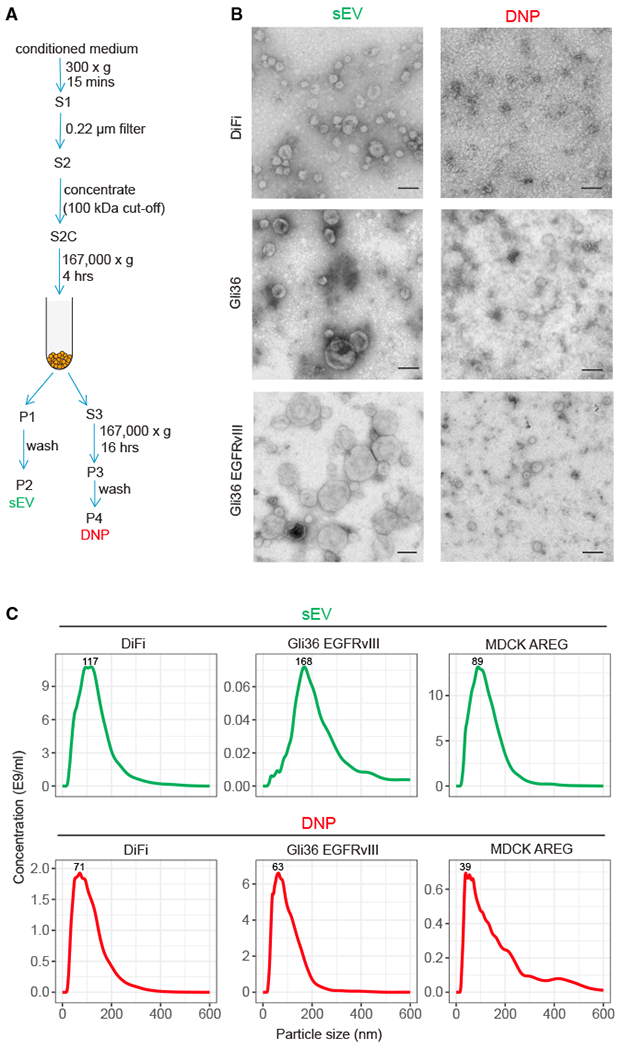
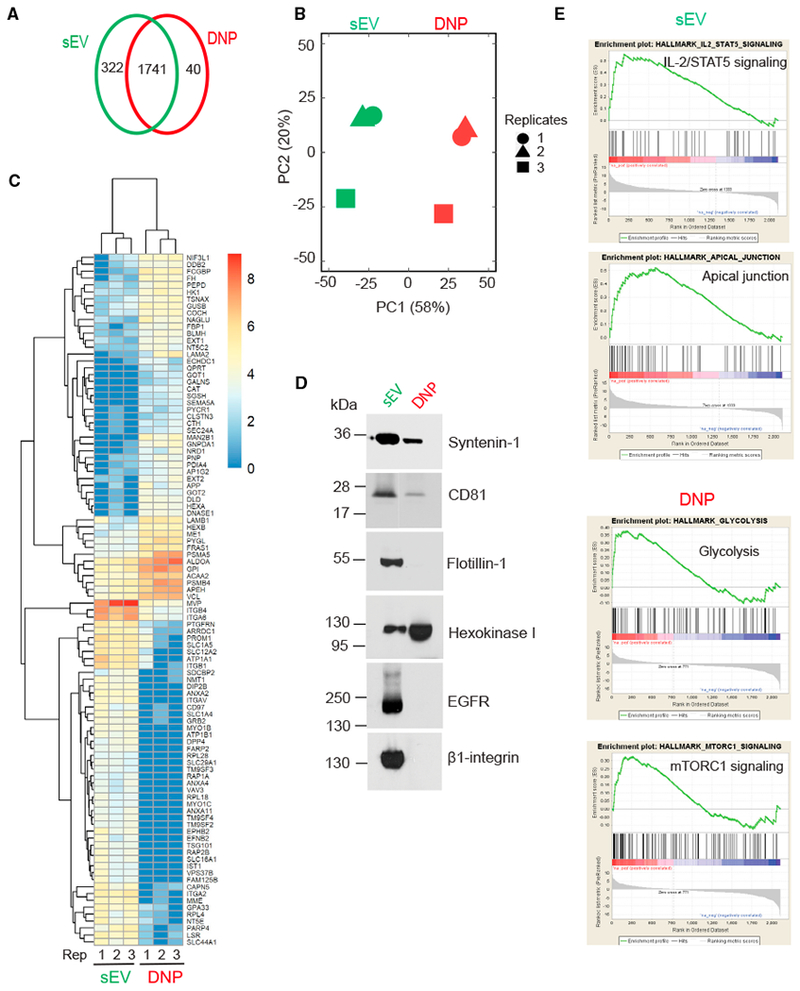
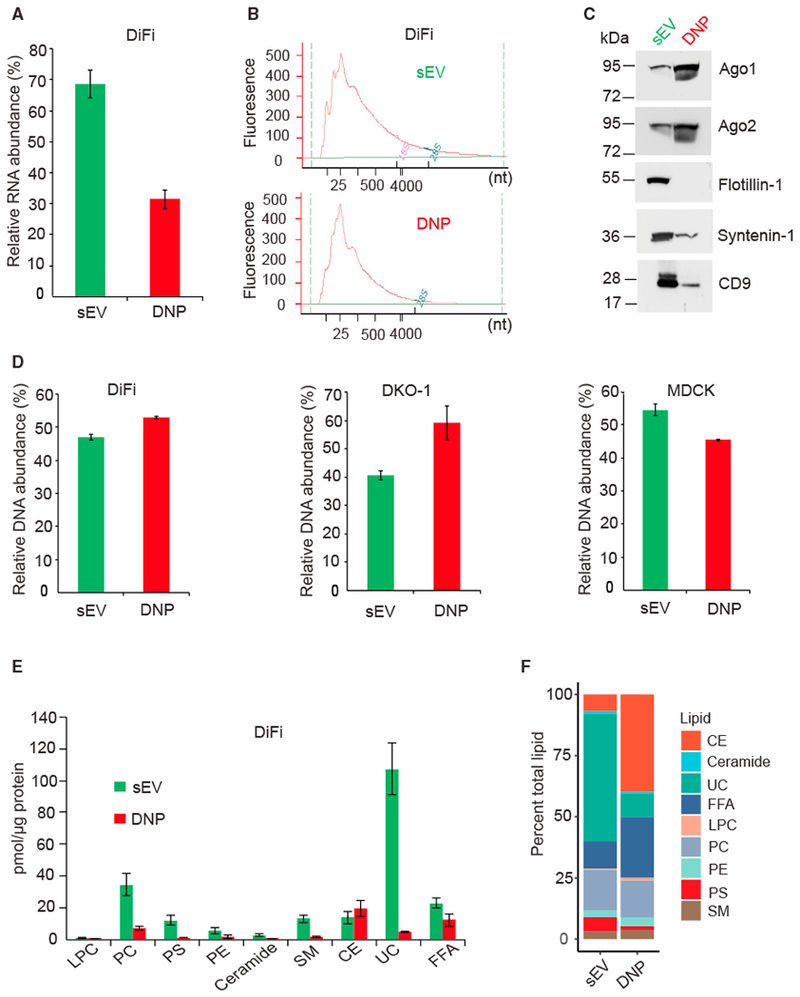
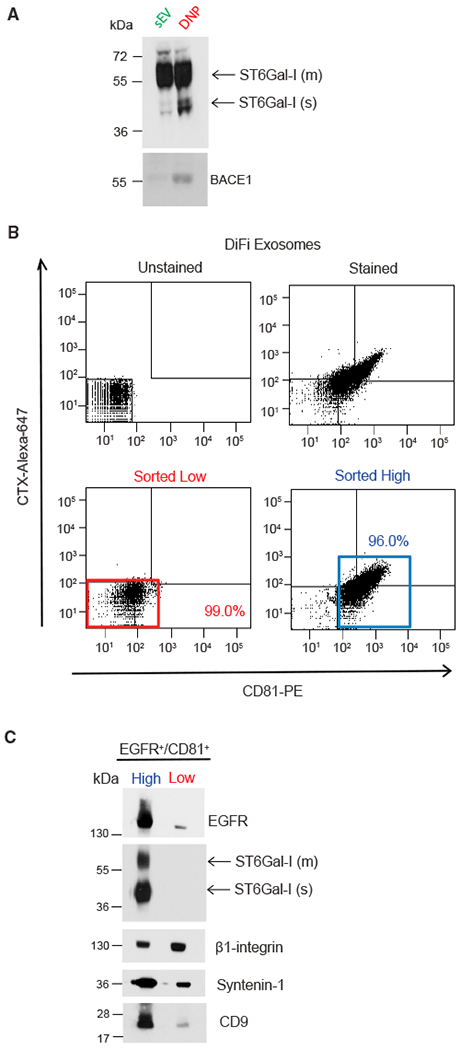
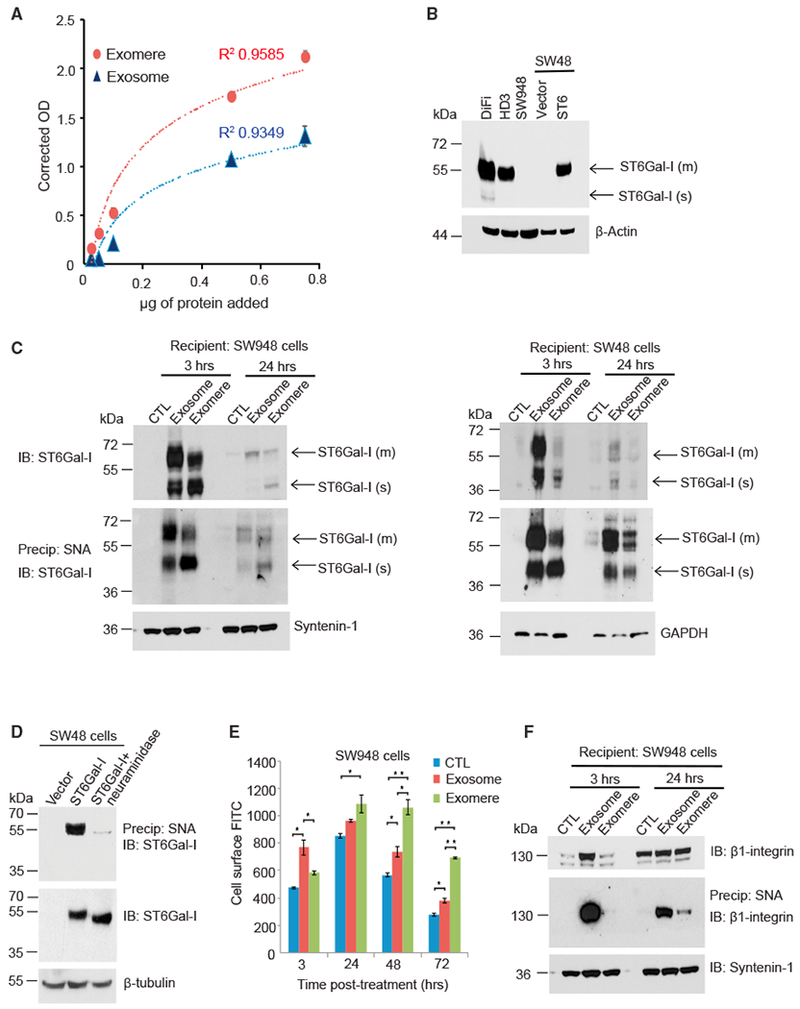
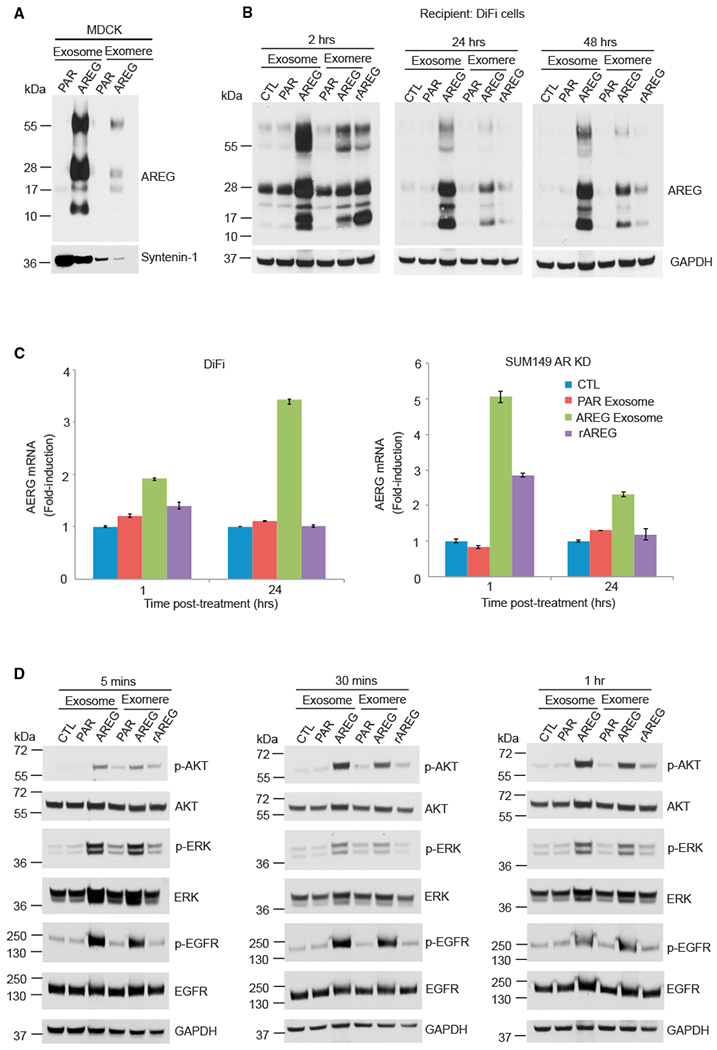
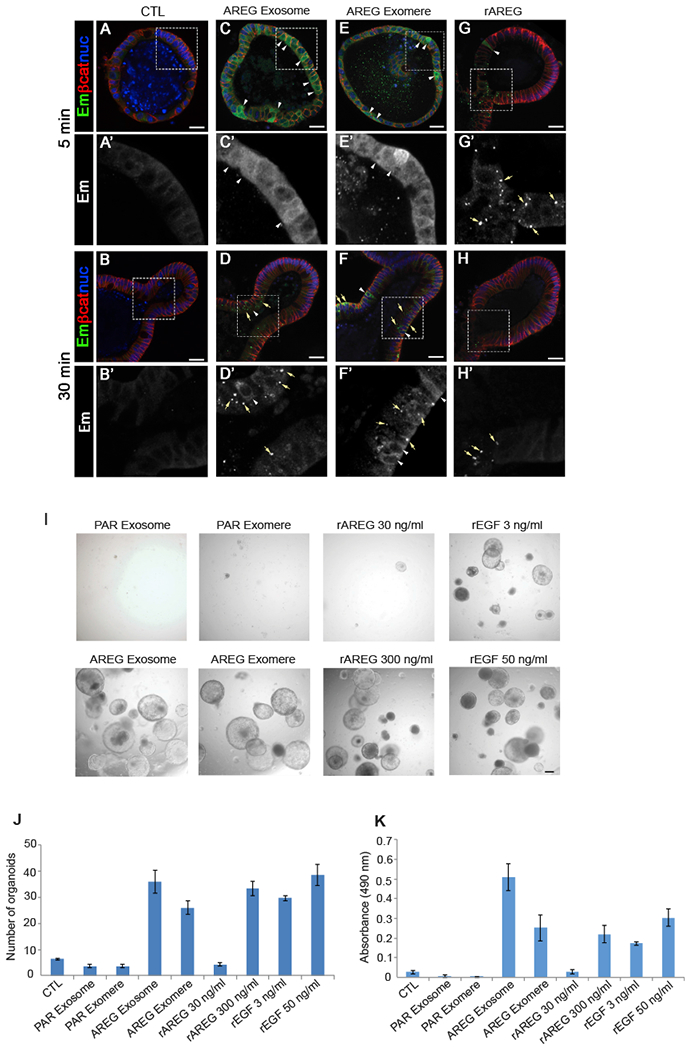
Exomeres are a recently discovered type of extracellular nanoparticle with no known biological function. Herein, we describe a simple ultracentrifugation-based method for separation of exomeres from exosomes. Exomeres are enriched in Argonaute 1-3 and amyloid precursor protein. We identify distinct functions of exomeres mediated by two of their cargo, the β-galactoside α2,6-sialyltransferase 1 (ST6Gal-I) that α2,6- sialylates N-glycans, and the EGFR ligand, amphiregulin (AREG). Functional ST6Gal-I in exomeres can be transferred to cells, resulting in hypersialylation of recipient cell-surface proteins including β1-integrin. AREG-containing exomeres elicit prolonged EGFR and downstream signaling in recipient cells, modulate EGFR trafficking in normal intestinal organoids, and dramatically enhance the growth of colonic tumor organoids. This study provides a simplified method of exomere isolation and demonstrates that exomeres contain and can transfer functional cargo. These findings underscore the heterogeneity of nanoparticles and should accelerate advances in determining the composition and biological functions of exomeres.

Keywords: Argonautes; EGFR; ST6Gal-I; amphiregulin; exomeres; exosomes; extracellular vesicles; fluorescence-activated vesicle sorting; organoids; β1-integrin.


Conflict of interest statement

DECLARATION OF INTERESTS

The authors declare no competing interests.

Figures

Figure 1.
Figure 1.. Biophysical Properties of Secreted sEVs and DNPs
(A) Schema for isolation of small extracellular vesicles (sEVs) and distinct nanoparticles (DNPs) using differential ultracentrifugation. S, supernatant; P, pellet. (B) Negative stain transmission electron microscopy (TEM) imaging of DNPs and sEVs. Representative images are shown. Scale bars: 100 nm. (C) Size distribution profiles of DNPs and sEVs by nanoparticle tracking analysis (NTA). See also Figures S1 and S2.
Figure 2.
Figure 2.. Proteomic Profiling of sEVs and DNPs
(A) Venn diagram of unique and common proteins identified in DNPs and sEVs isolated from DiFi cell conditioned medium. Data represent three independent biological replicates. Equal amounts of protein in sEVs and DNPs were used for the analysis. (B) Principal-component analysis (PCA) of normalized proteins. (C) Heatmap of top 100 proteins differentially expressed by sEVs and DNPs. (D) Immunoblot of representative proteins identified in DNPs and sEVs with the indicated antibodies. Equal amounts of protein were loaded. (E) Representative GSEA analyses showing signaling pathways in sEVs and DNPs. See also Tables S1, S2, S3, and S4.
Figure 3.
Figure 3.. Distinct Nucleic Acid and Lipid Composition of sEVs and DNPs
(A) Relative abundance of RNA isolated from DNPs and sEVs derived from DiFi cells. One biological experiment was performed in triplicate. Data are presented as mean ± SEM. RNA was isolated from equal amounts of total protein in sEVs and DNPs. (B) Size distribution of RNA isolated as shown in (A). (C) Immunoblot for Argonaute proteins and exosomal markers in DNPs and sEVs derived from DiFi cells. Equal amounts of proteins were loaded. (D) Relative abundance of DNA isolated from DNPs and sEVs derived from cell lines indicated. Three independent biological experiments were performed for DKO-1 cells. For DiFi and MDCK parental cells, one biological experiment with three technical replicates was performed. Data are presented as mean ± SEM. DNA was isolated from equal amounts of total protein in sEVs and DNPs. (E) Amount of each lipid class detected in DiFi cell-derived DNPs and sEVs. Lipidomic analysis was performed by ESI-MS. Two biological experiments were performed. Data are presented as mean ± SEM. Equal amounts of total protein in sEVs and DNPs were used for the analysis. (F) Individual lipid molecular species were quantified by comparisons to the internal standards (see STAR Methods).LPC, lysophosphatidylcholine; PC, choline glycerophospholipid; PE, ethanolamine glycerophospholipid; PS, serine glycerophospholipid; CE, cholesteryl ester; SM, sphingomyelin; Cer, ceramide; UC, unesterified cholesterol; FFA, free fatty acid. See also Figures S3 and S4.
Figure 4.
Figure 4.. ST6Gal-I Is Present in Exomeres and in a Subset of Exosomes
(A) Immunoblot of ST6Gal-I and BACE1 in exosomes and exomeres with the indicated antibodies. Equal amounts of proteins from exosomes and exomeres were loaded. m, membrane; s, soluble. (B) FAVS analysis of exosomes derived from DiFi cells. Dot plot of baseline fluorescent intensities from FAVS analysis of exosomes. No stain (upper left). Total fluorescent intensities from FAVS analysis of exosomes stained with a phycoerythrin-labeled CD81 antibody (x axis) and an Alexa 647-labeled EGFR antibody (cetuximab [CTX]) (y axis) (upper right). Percentages of gated populations from 10,000 total events are shown. Post-sort analysis of double-stained low-intensity (red box, lower left) and high-intensity (blue box, lower right) events. (C) Immunoblot of flow-sorted exosomes. The same number of sorted vesicles were lysed, separated on a SDS/PAGE gel, and immunoblotted with the indicated antibodies. m, membrane; s, soluble. See also Figure S5.
Figure 5.
Figure 5.. ST6Gal-I in Exomeres and Exosomes Is Functional in Recipient Cells
(A) Exosomes and exomeres contain sialyltransferase activity. Varying amounts of DiFi cell-derived exosomes or exomeres were added to a sialyltransferase activity kit (R&D Systems), which measures the transfer of sialic acid from CMP-sialic acid to an acceptor substrate. Three independent biological experiments were performed, and data are presented as mean ± SEM. (B) Immunoblot analysis of ST6Gal-I levels in colon cancer cell lines. SW48 cells were stably transduced with control vector or with ST6Gal-I expression construct lentiviral particles. m, membrane; s, soluble. (C) ST6Gal-I in exomeres and exosomes is delivered to recipient cells. Exosomes and exomeres derived from DiFi cells were applied to SW948 and SW48 cells and cells were harvested at different time points. Lysates were either directly used for immunoblotting to detect ST6Gal-I (top), or incubated with agarose-conjugated Sambucus nigra agglutinin (SNA) lectin (bottom). α2,6-Sialylated proteins were precipitated and immunoblotted for ST6Gal-I. Both membrane and cleaved soluble forms of ST6Gal-I were transferred to SW948 and SW48 cells, as denoted by arrows. m, membrane; s, soluble. (D) SNA recognizes α2,6-sialylated ST6Gal-I. To verify that SNA pull-down experiments precipitated the sialylated ST6Gal-I form, pull-downs were conducted with parental SW48 cells that lack endogenous ST6Gal-I or SW48 cells stably expressing ST6Gal-I. Pull-downs were also conducted with neuraminidase-treated lysates from ST6Gal-I-overexpressing SW48 cells. The SNA pull-downs, as well as whole-cell lysates, were immunoblotted for ST6Gal-I. (E) ST6Gal-I in exosomesand exomeres is functional in recipient cells. SW948 cells were treated with exosomesor exomeres isolated from DiFi cells or untreated control. At different time points, cells were stained with FITC-SNA and then assessed for total cell-surface levels of α2,6-sialylation by flow cytometry. Data are presented as mean ± SEM; n = 3; *p < 0.05, **p < 0.01. (F) SW948 cells were treated with either exosomes or exomeres. Lysates were incubated with agarose-conjugated SNA lectin. α2,6-Sialylated proteins were precipitated and blotted for β1-integrin. See also Figure S6.
Figure 6.
Figure 6.. AREG-Containing Exomeres and Exosomes Activate EGFR and Increase Downstream Signaling
(A) Immunoblot analysis of AREG levels in exosomes and exomeres isolated from MDCK cells expressing either empty vector or human AREG. Equal amounts of protein were loaded in each lane. Syntenin-1 was used as an exosomal marker. PAR exosome, exosomes derived from parental (PAR) MDCK cells; rAREG, recombinant human AREG. (B) Immunoblot analysis of AREG levels in DiFi cells treated once with 20 μg/mL exosomes or exomeres (equivalent to 10 pg/mL rAREG), 100 ng/mL rAREG, or untreated control, and harvested at the times indicated. Equal amounts of protein were loaded in each lane. (C) Analysis of AREG mRNA expression by qRT-PCR in DiFi cells and Sum149 AREG knockdown cells treated for 1 and 24 h with the treatments indicated. Data are presented as mean ± SEM. Actin was used as an internal control. (D) Immunoblot for total and phosphorylated (p) EGFR (tyrosine 1068), AKT, and ERK in DiFi cells treated as shown in (B). The same amount of protein was loaded in each lane. See also Figure S7.
Figure 7.
Figure 7.. AREG-Containing Exomeres and Exosomes Alter EGFR Trafficking and Enhance the Growth of Colonic Tumor Organoids
(A–H′) Immunostaining of Egfr-Emerald (Em) in EgfrEm/Em intestinal organoids 5 and 30 min after treatment with exosomes derived from parental MDCK cells (CTL) (A, A′, B, and B′), exosomes and exomeres derived from MDCK cells stably overexpressing AREG (AREG Exosome, C, C′, D, and D′, or AREG Exomere, E, E′, F, and F′, respectively), or rAREG (300 ng/mL) (G, G′, H, and H′). Exosomes and exomeres were added at a concentration of 10 μg/mL total protein. The amount of AREG in AREG exosomes and exomeres was calculated to be 1.5 pg/mL. (A–H) Low-power images of whole organoids. (A′–H′) High-magnification single-channel images of inserts in (A)′(H) indicated by white rectangle. Egfr-Em (green); β-catenin (red); nuclei (blue). See text for details. Scale bars: 25 μm. (I) Equal numbers of Lrig1CreER/+;Apcflox/+ colonic tumor organoids were seeded and treated for 10 days with the conditions indicated. Representative phase-contrast bright-field images are shown; 4× magnification. Scale bars: 100 μm. (J and K) The number (J) and viability (K) of tumor organoids were determined 10 days after exposure to the treatments indicated. Cell viability was measured using a MTS assay. Data are presented as mean ± SEM. See also Figure S8.

References

    1. Baillo A, Giroux C, and Ethier SP (2011). Knock-down of amphiregulin inhibits cellular invasion in inflammatory breast cancer. J. Cell. Physiol 226, 2691–2701. - PMC - PubMed
    1. Barnard JA, Graves-Deal R, Pittelkow MR, DuBois R, Cook P, Ramsey GW, Bishop PR, Damstrup L, and Coffey RJ (1994). Auto- and cross-induction within the mammalian epidermal growth factor-related peptide family. J. Biol. Chem 269, 22817–22822. - PubMed
    1. Bligh EG, and Dyer WJ (1959). A rapid method oftotal lipid extraction and purification. Can. J. Biochem. Physiol 37, 911–917. - PubMed
    1. Bowden JA, Shao F, Albert CJ, Lally JW, Brown RJ, Procknow JD, Stephenson AH, and Ford DA (2011). Electrospray ionization tandem mass spectrometryofsodiated adducts ofcholesteryl esters. Lipids 46,1169–1179. - PMC - PubMed
    1. Britain CM, Holdbrooks AT, Anderson JC, Willey CD, and Bellis SL (2018). Sialylation of EGFR by the ST6Gal-I sialyltransferase promotes EGFR activation and resistance to gefitinib-mediated cell death. J. Ovarian Res 11, 12. - PMC - PubMed

Publication types

MeSH terms