. 2018 Aug;2(8):589-599.
doi: 10.1038/s41551-018-0254-6. Epub 2018 Jul 2.

A designer self-assembled supramolecule amplifies macrophage immune responses against aggressive cancer

Affiliations

A designer self-assembled supramolecule amplifies macrophage immune responses against aggressive cancer

Ashish Kulkarni et al. Nat Biomed Eng. 2018 Aug.

Abstract

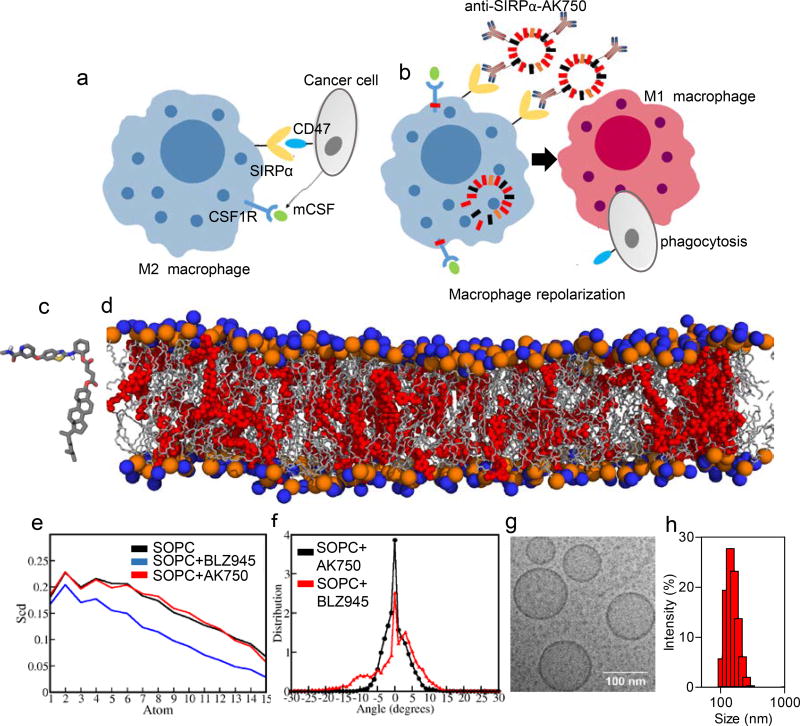
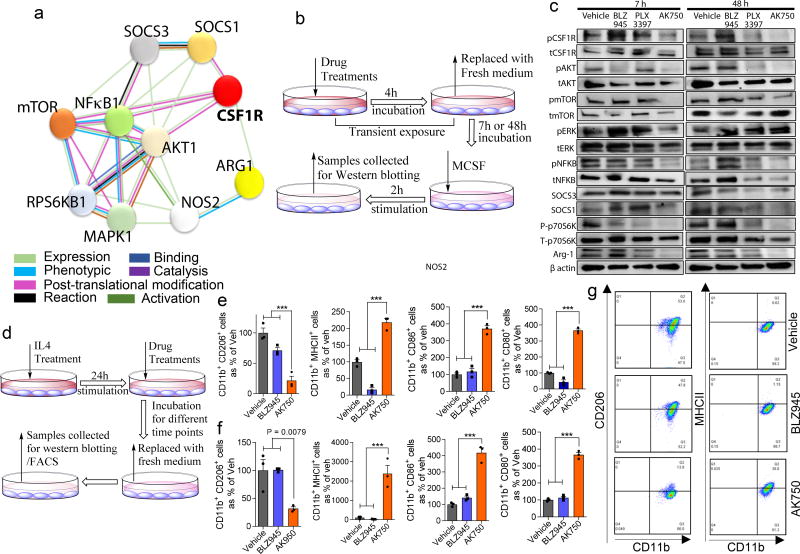
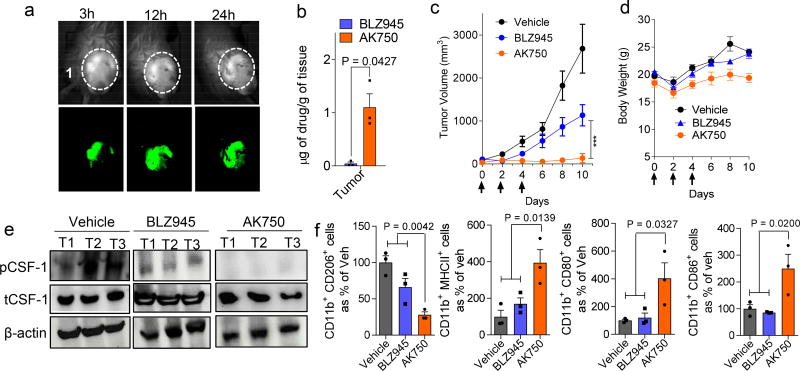
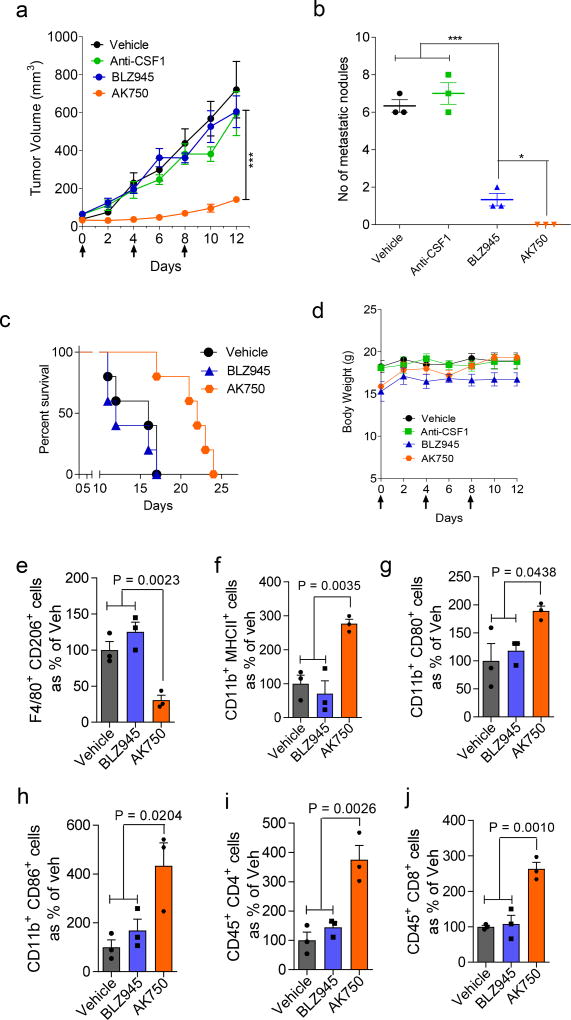
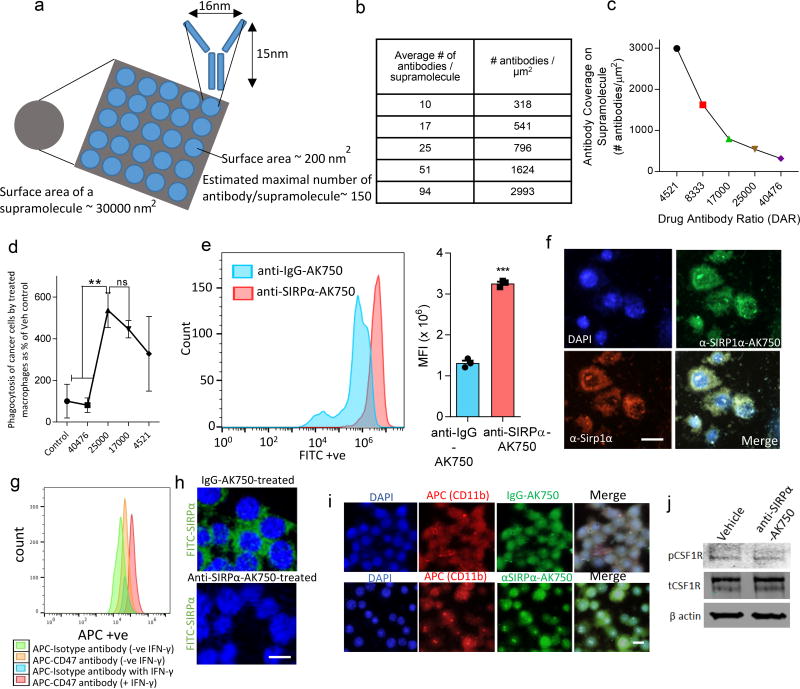
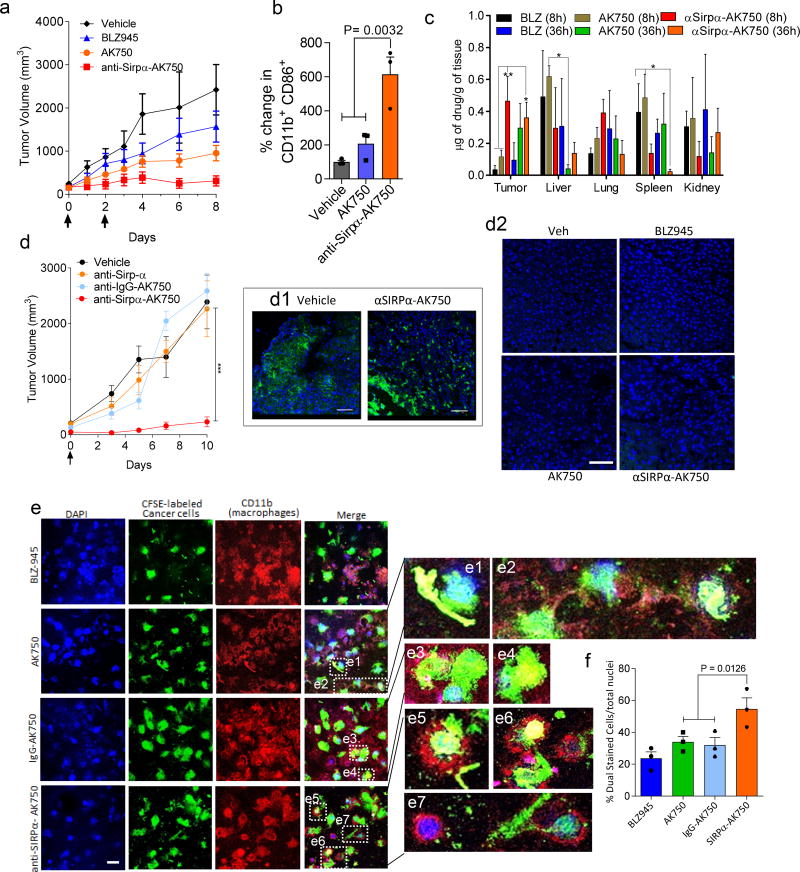
Effectively activating macrophages that can 'eat' cancer cells is challenging. In particular, cancer cells secrete macrophage colony stimulating factor (MCSF), which polarizes tumour-associated macrophages from an antitumour M1 phenotype to a pro-tumourigenic M2 phenotype. Also, cancer cells can express CD47, an 'eat me not' signal that ligates with the signal regulatory protein alpha (SIRPα) receptor on macrophages to prevent phagocytosis. Here, we show that a supramolecular assembly consisting of amphiphiles inhibiting the colony stimulating factor 1 receptor (CSF-1R) and displaying SIRPα-blocking antibodies with a drug-to-antibody ratio of 17,000 can disable both mechanisms. The supramolecule homes onto SIRPα on macrophages, blocking the CD47-SIRPα signalling axis while sustainedly inhibiting CSF-1R. The supramolecule enhances the M2-to-M1 repolarization within the tumour microenvironment, and significantly improves antitumour and antimetastatic efficacies in two aggressive animal models of melanoma and breast cancer, with respect to clinically available small-molecule and biologic inhibitors of CSF-1R signalling. Simultaneously blocking the CD47-SIRPα and MCSF-CSF-1R signalling axes may constitute a promising immunotherapy.


Conflict of interest statement

Competing interests: SS is a cofounder and holds equity in Akamara Therapeutics Inc. which is developing supramolecular therapeutics.

Figures

Figure 1
Figure 1. Design of a TAM-targeting supramolecular therapeutic
(a) Schematic shows that cancer cells exploit colony stimulating factor 1 receptor (CSF-1R) signaling to polarize macrophages to immunosuppressive “M2” phenotype, and signal regulatory protein alpha (SIRPα)-CD47 interactions to inhibit phagocytosis. (b) Schematic illustration of efficient repolarization of M2 macrophage to effector “M1” phenotype by dual-function supramolecular therapeutic (anti-SIRPα-AK750)-mediated sustained inhibition of CSF-1R signaling and enhanced phagocytosis of cancer cells following inhibition of SIRPα. (c) Representation of the QM-optimized structure of the molecular subunit of supramolecular nanostructure, AK750. (d) Snapshot of all atomistic simulation of the molecular subunit (in red) interacting with the lipid bilayer at 100ns shows stable supramolecular structure; Lipid (SOPC) hydrophilic heads are shown in orange and blue spheres and lipid tails are shown in grey color. (e) Angle between vector defined on C-C bond on SOPC tail with Z-axis (axis perpendicular to bilayer plane) is depicted as θ. Deuterium order parameter (Scd) is calculated using θ. Scd is calculated on each carbon atom of phospholipid tail. Higher the -Scd, higher is the lipid tail ordering; Deuterium order parameter on each methylene group on saturated tail of co-lipid is depicted. Lipid tail ordering for BLZ945-containing lipid bilayer is the least. Lipid tail ordering of AK750 bilayer is similar to that of the pure lipid bilayer; (f) Tilt angle is the angle between vector joining center of mass of phospholipid tails and Z-axis (axis perpendicular to bilayer plane). Value of tilt angle is positive or negative depending on direction of the ripple. Its value is close to 0° when no ripples form. Distribution of tilt angle averaged over last 5 ns of MD trajectory. Broader the distribution larger is the tilt angle, higher is the extent of bilayer instability. (g) High resolution cryo-TEM image of AK750 showing size of ~100 nm and spherical morphology; (h) Graph shows the size distribution (hydrodynamic diameter) of a representative batch of AK750 as measured by dynamic light scattering. The description of panels c–g is adapted from ref. .
Figure 2
Figure 2. AK750 inhibits CSF-1R and downstream signaling pathways in a sustained manner, and efficiently repolarize M2 macrophages to M1 phenotype
(a) STRING map showing different direct or indirect protein interactions associated with CSF-1R signaling pathway in macrophages. The STRING map was generated by using STRING database version 10.0; (b) Schematic representation of CSF-1R pathways inhibition assay. RAW264.7 macrophage cells were pre-treated with either BLZ945, PLX3397 or AK750 for 4h, and then washed with cold PBS to remove the drugs that are not internalized. After 7h or 48h of recovery in fresh medium, the cells were stimulated with either MCSF for 2h. The cells were then washed and analyzed for activation of signaling pathway as shown in (c) Western blot for phosphor-CSF-1R, total CSF-1R and downstream signaling pathways. The cropped blots are used in the figure, and full-length blots are presented in Supplementary Fig. 13; (d) Schematic representation of macrophage repolarization assay. RAW264.7 macrophages were stimulated with IL4 for 24h, and then treated with either BLZ945, PLX3397 or AK750 for 12h before replacing with fresh medium. The cell lysates were collected at different timepoints for western blotting and FACS; (e–f) Quantification of flow cytometry data demonstrating expression of M2 markers (CD11b+CD206+), or M1 markers (CD11b+, MHC-II, CD86+ CD80+). The data shown are at (e) 12h, and (f) 72h time points. Statistical analysis was performed with One-way ANOVA with Newman-Keuls post Test. Data shows mean ± SEM (n = 3); ***p < 0.001; (g) Flow cytometry demonstrating expression of CD11b+CD206+, CD11b+MHC-II+, CD11b+CD86+ and CD11b+CD80+ on the macrophages at 72h time point following different treatments.
Figure 3
Figure 3. In vivo efficacy of AK750 in a syngeneic B-16/F10 melanoma C57BL/6 mice model
(a) Representative image shows the temporal accumulation of a NIR dye-tagged AK750 in the tumor in a melanoma-bearing mouse model. (b) Graph shows the quantification of actual drug concentration reached in the tumor, in vivo, as measured using LC-MS. Tumor-bearing animals were injected with equimolar dose of the drugs. Data shows mean ± SEM (n = 3), *p < 0.05 (Student’s t-test, two-sided). (c) Tumor growth curves show effect of different treatments on tumor volume. Each animal was injected with three doses of either vehicle (for control group), 45 mg/kg of free BLZ945, and AK750 (at equimolar dose to BLZ945) on day 0, day 4 and day 8. First day of treatment was considered as Day 0. Treatment with AK750 was significantly more effective than BLZ945. One should note the different routes of administration, and i.p. administration can result in lower bioavailability than i.v. administration. Data shown are mean ± SEM (n = 5), ***p < 0.001 (One-way ANOVA). (d) Graph shows drug toxicity assessed by measurements in overall body weight. Data shown are mean ± SEM (n = 5). (e) Western blot shows expression of phosphor-CSF-1R and total CSF-1R in 3 representative tumors in each treatment group, in vivo. The cropped blots are used in the figure, and full-length blots are presented in Supplementary Fig. 14; (f) Graphs show the quantification of expression of different M2 markers (CD11b+CD206+), or M1 markers (CD11b+MHC-II+, CD11b+CD86+ and CD11b+CD80+) in single cell suspension of the harvested tumor post-treatment, as quantified using flow cytometry. Tumors were harvested on day 10 and single cell suspension was prepared. Data shown are mean ± SEM (n = 3), p values are shown in the graphs. Statistical analysis was performed with One-way ANOVA with Newman-Keuls post Test.
Figure 4
Figure 4. AK750 induces significant tumor growth inhibition in a syngeneic 4T1 breast cancer BALB/c mice model
(a) Growth curves show effect of different multi-dose treatments on tumor volume in 4T1 tumor bearing mice Tumor growth curves show effect of different treatments on tumor volume. Each animal was injected with three doses of either vehicle (for control group), 45 mg/kg of free BLZ945, AK750 (at equimolar dose to BLZ945) or a CSF-1 neutralizing antibody (25mg/kg) on day 0, day 4 and day 8. First day of treatment was considered as Day 0. Data shown are mean ± SEM (n = 5), ***p < 0.001 (One-way ANOVA). (b) Graph shows the number of metastatic nodules present in the lungs. Lungs were harvested from treated tumor-bearing mice on day 12, washed with cold PBS, and the number of metastatic nodules were counted. BLZ945 showed a reduction as compared to CSF-1 neutralizing antibody and the vehicle control, However the AK750 displayed complete inhibition of formation of metastatic nodules. Data shown are mean ± SEM (n = 3), *p < 0.05; ***p < 0.001 (ANOVA followed by Newman Keul’s Post hoc test). (c) Kaplan Meir survival curves show that treatment with AK750 increases survival (P<0.05) as compared with BLZ945 (n=5 in each treatment group). One should note the different routes of administration, and i.p. administration can result in lower bioavailability than i.v. administration. (d) Graph shows drug toxicity assessed by measurements in overall body weight. Data shown are mean ± SEM (n = 5). (e–j) Graphs show the quantification of expression of different M2 markers (CD11b+CD206+), M1 markers (CD11b+MHC-II+, CD11b+CD86+ and CD11b+CD80+), and effector T cell markers (CD45+CD4+, CD45+CD8+) in single cell suspension of the harvested tumor post-treatment, as quantified using flow cytometry. Tumors were harvested on day 12 and single cell suspension was prepared. Data shown are mean ± SEM (n = 3), p values are shown in the graphs. Statistical analysis was performed with One-way ANOVA with Newman-Keuls post Test.
Figure 5
Figure 5. Engineering a bifunctional anti-SIRPα-AK750 that blocks CD47-SIRPα axis and CSF-1R
(a) Schematic shows the theoretical model of the total surface area of a 100 nm supramolecule and maximal number of antibodies that can be accommodated on the surface. (b) Table shows the total number of antibodies on a ~100 nm supramolecule and the corresponding surface density. (c) The effect of increasing antibody concentration on the DAR. (d) The effect of treatment with supramolecules with increasing antibody concentration but constant number of CSF-1R-inhibiting amphiphiles on the phagocytosis of cancer cells by macrophages. RAW264.7 macrophages were stimulated with IL4 to first generate M2 phenotype, and then incubated with anti-SIRPα-AK750. After 12h incubation, CFSE-labeled B16/F10 melanoma cells were added to the culture, and incubated for 8h. Nuclei were stained with DAPI (blue). Macrophages were labeled with APC-anti-CD11b antibody. AK750 was used as the control arm, and data shown are mean ± SD % change from AK750-treated group (n=3). (e) Representative FACS data shows increased binding of fluorophore-tagged anti-SIRPα-AK750 on TAMs as compared to control isotype IgG-AK750. The TAMs were isolated from the tumors of B16/F10 melanoma tumor bearing mice using CD11b isolation kit. The macrophages were incubated with either FITC- tagged anti-SIRPα-AK750 or control FITC-tagged anti-IgG-AK750 for 4h, followed by washing with cold PBS. Binding of the supramolecules was analyzed using FACS. Graph shows the quantification of the binding and internalization of anti-SIRPα-AK750 to TAMs compared to control anti-IgG-AK750, as measured by mean fluorescence intensity (MFI) in TAMs. Data shown are mean ± SEM (n=3). ***P<0.001 (Student’s T test, two-sided). (f) Representative confocal images show binding of FITC- tagged anti-SIRPα-AK750 to SIRPα protein on M2 macrophages with anti-SIRPα-AK750. M2 macrophages were generated by stimulating RAW264.7 cells with IL4 followed by incubation with FITC- tagged anti-SIRPα-AK750 for 4h. Nuclei were stained with DAPI (blue) and SIRPα protein was labeled with APC-anti-SIRPα antibody. (g) Melanoma cells were treated with interferon gamma (IFNγ) to increase the expression of CD47 as seen using the FACS plot. (h) The CD47-expressing cancer cells were incubated with fluorescently tagged SIRPα in the presence of anti-SIRPα-AK750 or control IgG-AK750. Confocal imaging reveals that the treatment with anti-SIRPα-AK750 completely inhibits the SIRPα-CD47 binding unlike the control IgG-AK750 supramolecules. (i) Representative fluorescence images show internalization of FITC- tagged anti-SIRPα-AK750 in M2 macrophages. (j) Western blot shows treatment with anti-SIRPα-AK750 decreases the levels of phosphor-CSF-1R without any change to total CSF-1R. Actin levels were used for normalization. RAW264.7 Cells were stimulated with IL4 to generate M2 phenotype, followed by incubation with anti-SIRPα-AK750. After 48h of incubation, the cells were lysed and analyzed using Western blotting. The cropped blots are used in the figure, and full-length blots are presented in Supplementary Fig. 15.
Fig.6
Fig.6. Single dose of anti-SIRPα-AK750 abrogates tumor growth in a syngeneic B-16/F10 melanoma C57BL/6 mouse model
(a) Tumor growth curves show effect of two cycles of treatments on tumor volume in a syngeneic B-16/F10 melanoma C57BL/6 mice model. Animal with 75 mm3 tumors were randomized into four treatment groups: (1) vehicle controls, (2) BLZ945 (45mg/kg, i.p.), (3) AK750 (mole equivalent to BLZ945 dose), and (4) anti-SIRPα-AK750 (at mole equivalent to BLZ945 dose). One should note the different routes of administration, and i.p. administration can result in lower bioavailability than i.v. administration. First day of treatment was considered as Day 0. Data shown are mean ± SEM (n = 5), *p < 0.05 (One-way ANOVA). (b) Graphs show the quantification of expression M1 markers (CD11b+CD86+) in single cell suspension of the harvested tumor post-treatment, as quantified using flow cytometry. Tumors were harvested on day 10 and single cell suspension was prepared. Data shown are mean ± SEM (n = 3), P value is shown in the graph (One-way ANOVA). (c) Graph shows quantitative analysis of drug biodistribution in different organs. Major RES organs were excised from tumor-bearing mice at different time points after a single injection of AK750, anti Sirpα-AK750 and BLZ945. (all animals were dosed with drugs at molar equivalent to 15mg/kg dose of BLZ945, administered I.V.). The drug concentrations per gram of tissue were quantified using LC/MS/MS. Error bars represent mean ± SEM (n=3) (One-way ANOVA). (d) Tumor growth curves show effect of a single cycle of treatment on tumor volume in a syngeneic B-16/F10 melanoma C57BL/6 mice model. Animal with 75 mm3 tumors were randomized into four treatment groups: (1) vehicle controls, (2) anti-SIRPα IgG (5mg/kg), (3) IgG-AK750 (equivalent to molar dose equivalent to 45mg/kg of BLZ945), and (4) anti-SIRPα-AK750 (at mole equivalent to AK750 dose used in group 3). Day of treatment was considered as Day 0. Data shown are mean ± SEM (n = 5), ***p < 0.001 (One-way ANOVA). (d1) Representative fluorescence images shows F4/80+ macrophages in cross-sections of tumor tissue from vehicle- and anti-SIRPα-AK750-treated groups. (d2) Cross sections of liver stained for apoptosis signal (TUNEL) show the absence of any toxicity signal. (e) Representative confocal images show the effect of different treatments on phagocytosis of B16/F10 melanoma cells in a co-culture assay with macrophages. RAW264.7 Cells were stimulated with IL4 to generate M2 phenotype, and then incubated with BLZ-945, AK750, IgG-AK750 or anti-SIRPα-AK750 or. After 12h incubation, CFSE-labeled B16/F10 melanoma cells were added to the culture, and incubated for 8h. Nuclei were stained with DAPI (blue), Macrophages were labeled with APC-anti-CD11b antibody. Images were captured using a confocal microscope at same magnification (bar=10 µm). (e1–e7) Zoomed images from corresponding merged images show CFSE-labeled cancer cells (green) being phagocytosed by macrophages (red). (h) Graph shows the percentage of phagocytosis as determined by measuring the percentage of dual stained cells (red and green) to total nuclei (blue). Data shown are mean ± SEM (n = 3), p value is shown in the graph (One-way ANOVA followed by Newman Keul’s post hoc test).

References

    1. Mantovani A, Marchesi F, Malesci A, Laghi L, Allavena P. Tumour-associated macrophages as treatment targets in oncology. Nature reviews. Clinical oncology. 2017 doi: 10.1038/nrclinonc.2016.217. - DOI - PMC - PubMed
    1. Engblom C, Pfirschke C, Pittet MJ. The role of myeloid cells in cancer therapies. Nature reviews. Cancer. 2016;16:447–462. doi: 10.1038/nrc.2016.54. - DOI - PubMed
    1. Noy R, Pollard JW. Tumor-associated macrophages: from mechanisms to therapy. Immunity. 2014;41:49–61. doi: 10.1016/j.immuni.2014.06.010. - DOI - PMC - PubMed
    1. Condeelis J, Pollard JW. Macrophages: obligate partners for tumor cell migration, invasion, and metastasis. Cell. 2006;124:263–266. doi: 10.1016/j.cell.2006.01.007. - DOI - PubMed
    1. Gabrilovich DI, Ostrand-Rosenberg S, Bronte V. Coordinated regulation of myeloid cells by tumours. Nature reviews. Immunology. 2012;12:253–268. doi: 10.1038/nri3175. - DOI - PMC - PubMed

Publication types

MeSH terms

Substances