. 2019 Mar 29:7:e6652.
doi: 10.7717/peerj.6652. eCollection 2019.

IOCBIO Sparks detection and analysis software

Affiliations

IOCBIO Sparks detection and analysis software

Martin Laasmaa et al. PeerJ. .

Abstract

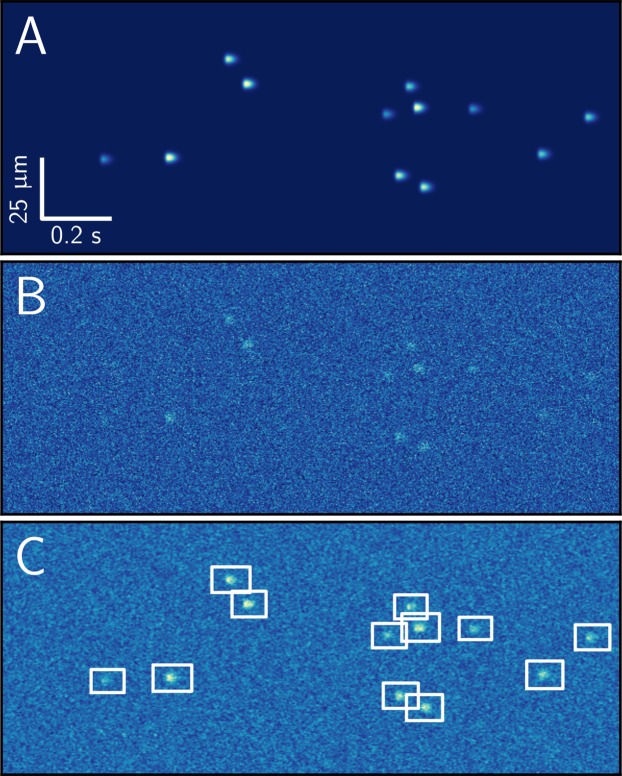
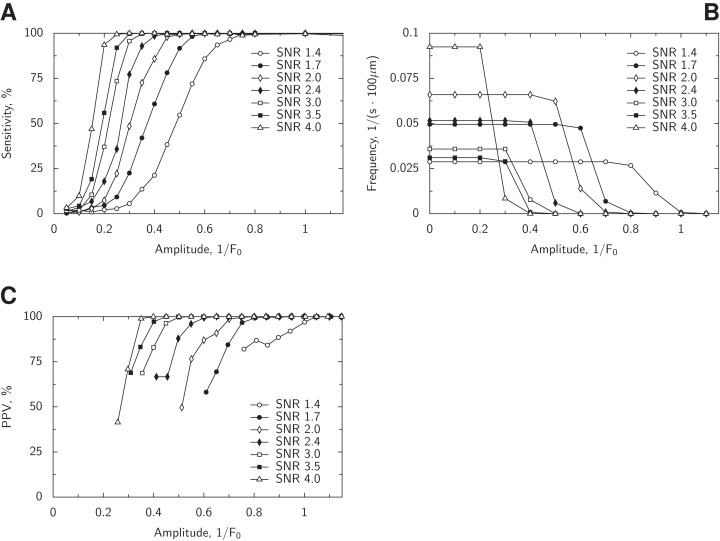
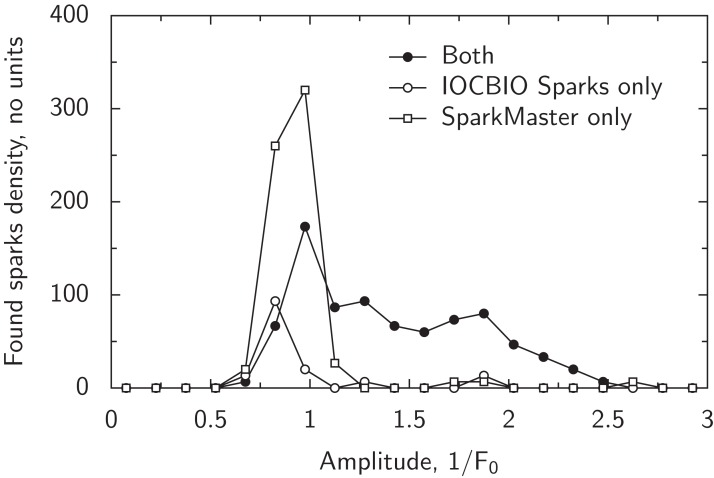
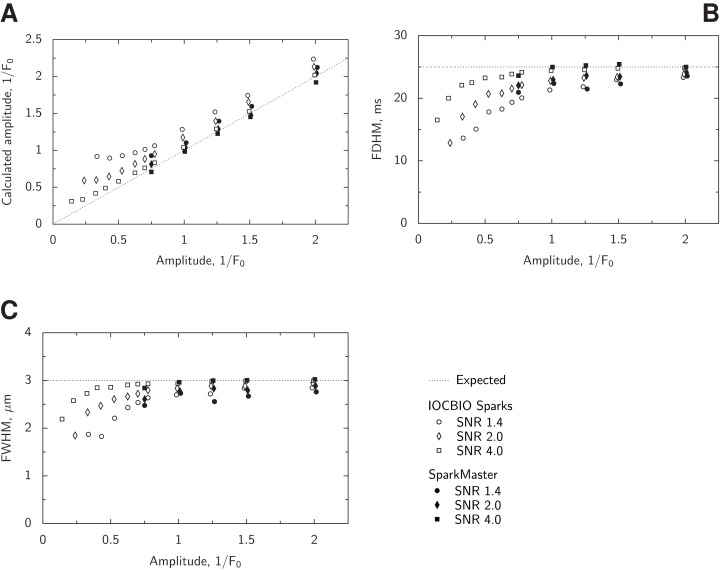
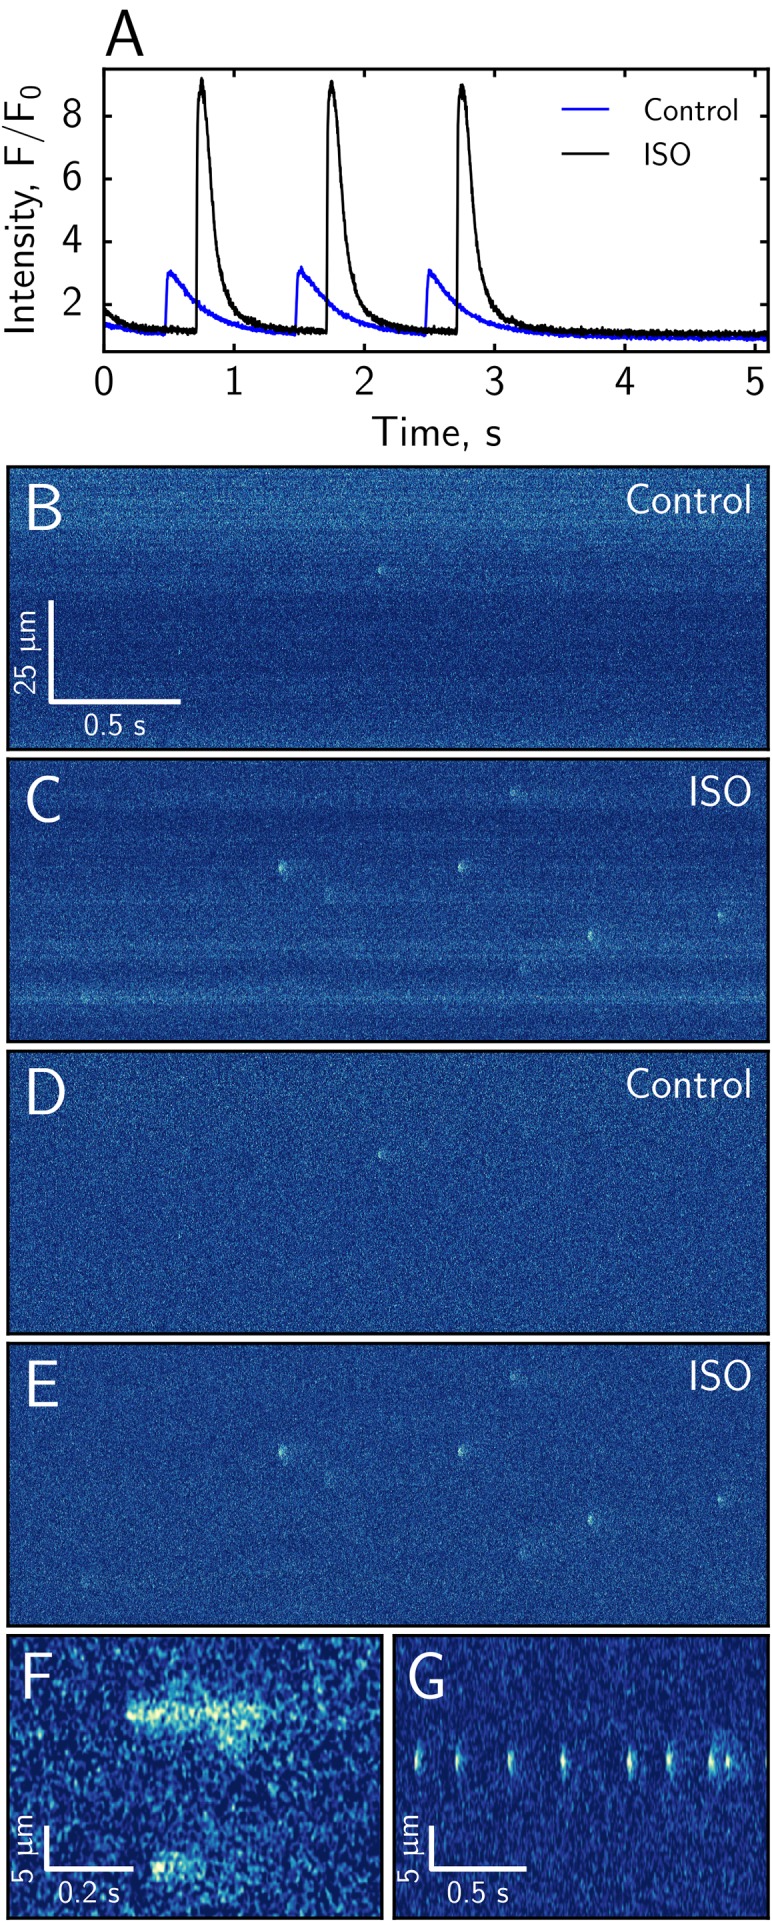
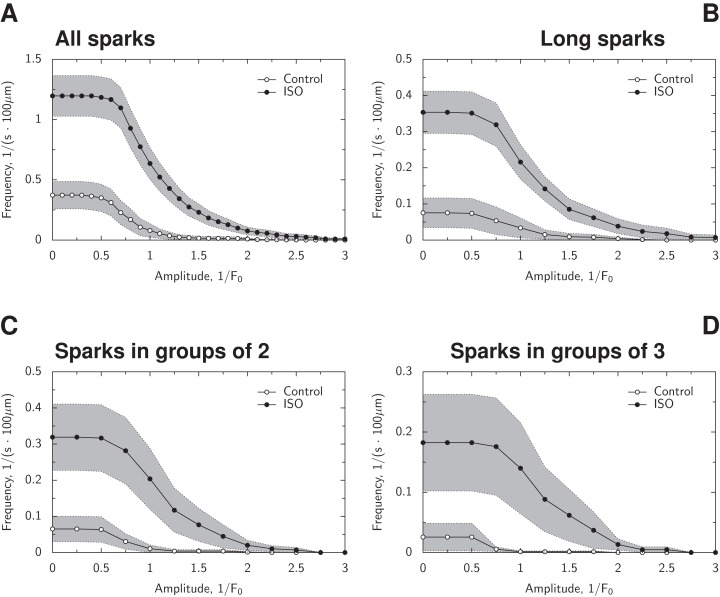
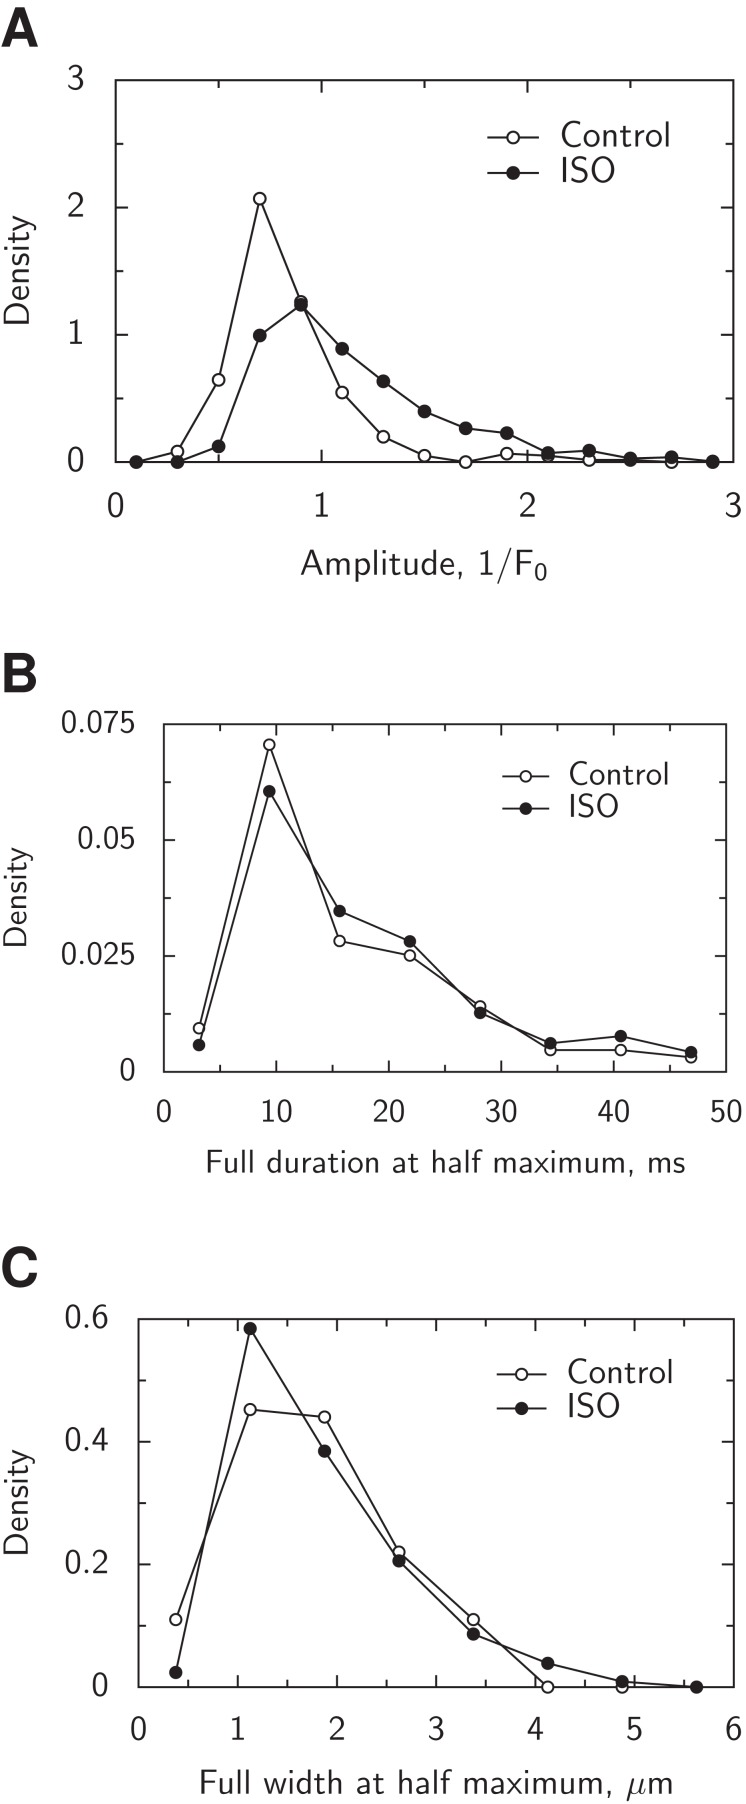
Analysis of calcium sparks in cardiomyocytes can provide valuable information about functional changes of calcium handling in health and disease. As a part of the calcium sparks analysis, sparks detection and characterization is necessary. Here, we describe a new open-source platform for automatic calcium sparks detection from line scan confocal images. The developed software is tailored for detecting only calcium sparks, allowing us to design a graphical user interface specifically for this task. The software enables detecting sparks automatically as well as adding, removing, or adjusting regions of interest marking each spark. The results of the analysis are stored in an SQL database, allowing simple integration with statistical tools. We have analyzed the performance of the algorithm using a large set of synthetic images with varying spark sizes and noise levels and also compared the analysis results with results obtained by software established in the field. The use of our software is illustrated by an analysis of the effect of isoprenaline (ISO) on spark frequency, amplitude, and spatial and temporal characteristics. For that, cardiomyocytes from C57BL/6 mice were used. We demonstrated an increase in spark frequency, tendency of having larger spark amplitudes, sparks with a longer duration, and occurrence of multiple sparks from the same site in the presence of ISO. We also show that the duration and the width of sparks with the same amplitude were similar in the absence and presence of ISO. The software was released as an open source repository and is available for free use and collaborative development.

Keywords: Analysis software; Calcium spark; Cardiomyocyte; Confocal microscopy; Mouse; Open source.


Conflict of interest statement

The authors declare that they have no competing interests.

Figures

Figure 1
Figure 1. Overview of the graphical user interface.
See text in ‘Results’ for description.
Figure 2
Figure 2. Schema of the spark detection algorithm.
See text for description.
Figure 3
Figure 3. Spatial distribution of the image background noise without (blue) and with (red) the correction of the image.
Notice how accounting for the nature of Poisson process of image detection in confocal microscope evens the noise distribution.
Figure 4
Figure 4. Different stages of the experiment analysis.
From the original recording (A), a sparks detection experiment stage is selected (B). In that stage, the background is determined (C) allowing to calculate a background subtracted and uneven noise corrected image (D) with its median-blurred version (E). For each detected spark (F), its temporal and spatial properties are determined on the basis of the spline fits, as in (G) and (H), respectively.
Figure 5
Figure 5. Example of synthetic dataset used for evaluation of the spark detection algorithm.
Image with randomly distributed sparks with amplitudes of 0.5, 0.75, 1.0, 1.25 × F0 (A) was disturbed by Poisson noise to obtain SNR of the background equal to 2 (B), and analyzed by sparks detection algorithm using smoothed image (C). Notice how all the sparks were detected, as indicated by the white boxes on (C).
Figure 6
Figure 6. Analysis of the performance of the detection algorithm.
In (A), the sensitivity of the spark detection strongly depends on the SNR of the image and the amplitude of the detected spark. Here, detection sensitivity for a given amplitude was defined as a proportion of detected sparks out of all sparks with that amplitude. In (B), false positive events characterized as sparks (false positive sparks) are shown as a frequency of the events. The frequency for false positive sparks with given amplitude As was defined as frequency of events with the amplitudes that were at least As. For example, for SNR 2, the false positive sparks had an amplitude which was smaller than 0.7 × F0 and larger than 0.4 × F0. As with sensitivity, there is a large influence of SNR and amplitude on the false positive sparks frequency. In (C), positive predictive value (PPV) is shown against the spark amplitude estimated by the program. Here, PPV was found by binning results with a step 0.05 × F0 and only conditions with more than 20 events (true or false positives) are shown. See the main text for interpretation of the results.
Figure 7
Figure 7. Comparison of spark detection by our program and SparkMaster using the data from Fig. 4.
The detected sparks were grouped into three groups: sparks detected by both programs (“Both”), detected by our software (“IOCBIO Sparks”) or SparkMaster (“SparkMaster”) only. Spark amplitudes are normalized by SparkMaster and our software differently due to the handling of F0 (see Discussion). To correct for the differences in amplitudes normalization, the amplitudes found by SparkMaster were mapped to the amplitudes corresponding to our software through a linear relationship between the amplitudes. Note that the sparks detected with the both programs have relatively large amplitudes and, in contrast, the sparks detected by only one of the programs are mainly restricted to the sparks with small amplitudes.
Figure 8
Figure 8. Analysis of the performance of the spark morphology estimation.
For all successfully detected sparks from the synthetic data, mean estimated amplitude (A), FDHM (B), and FWHM (C) were related to the ground truth values that were used to generate synthetic data. The values used to create synthetic spark data are indicated in the plots using a dashed line (Expected). In the analysis, we varied SNR and spark amplitude with the fixed FDHM and FWHM used to generate synthetic spark images. Data were analyzed either by our program or SparkMaster, see legend for the used notation. Here, only conditions with at least 25 detected sparks were analyzed. Note how the mean estimates depend on SNR and spark amplitude with the similarity in the estimates done by both programs.
Figure 9
Figure 9. Representative experiments showing the effect of isoprenaline as studied by Fluo-4 fluorescence confocal images.
The overall intensity of Fluo-4 fluorescence is significantly higher in the presence of isoprenaline during the pacing stage of experiment (A). The original recordings (B, C) and the corrected images (D, E) show a larger spark frequency in the presence of isoprenaline (B–E have the same scale). We also observed the occurrence of longer calcium release events (F) and multiple sparks occurring at the same location in the experiments with isoprenaline (G).
Figure 10
Figure 10. Analysis of spark frequency for different spark amplitudes.
In all graphs, the frequency was found for occurrence of sparks with the amplitude that was equal or larger than the one indicated on x-axis. The frequency is shown by its mean value (solid line) and the area surrounding it as ± SEM. In (A), the frequency for all sparks is shown in control and in the presence of ISO. In (B), the frequency of longer sparks (sparks with full duration at the half maximum of at least 25 ms) is shown. In (C), the frequency of sparks followed by a spark of at least the same cut-off amplitude within 2 s and within one μm. In (D), similar to (C), but with the two sparks in the location within one μm of the original spark and each spark following the previous one within 2 s. Note that the presence of ISO increased overall spark frequency, spark frequency for sparks with the larger normalized amplitude, spark frequency of longer sparks, and occurrence of multiple sparks in the vicinity of each other at the short period of time.
Figure 11
Figure 11. Analysis of spark distribution shown through probability density functions.
(A) Distribution of spark amplitudes in control and the presence of ISO. Notice the shift of the probability density function towards larger amplitudes in the presence of ISO. (B) Distribution of full duration at half maximum for sparks with the amplitudes in the range from 0.8 × F0 to 1.2 × F0. (C) Distribution of full width at half maximum for sparks with the amplitudes in the range from 0.8 × F0 to 1.2 × F0. Note that the temporal and spatial properties for the sparks with the same amplitude were similar in control and the presence of ISO.

References

    1. Bankhead P, Scholfield CN, Curtis T, Mcgeown JG. Detecting Ca2+ sparks on stationary and varying baselines. American Journal of Physiology-Cell Physiology. 2011;301(3):C717–C728. doi: 10.1152/ajpcell.00032.2011. - DOI - PubMed
    1. Bers DM. Cardiac excitation-contraction coupling. Nature. 2002;415(6868):198–205. - PubMed
    1. Branovets J, Sepp M, Kotlyarova S, Jepihhina N, Sokolova N, Aksentijevic D, Lygate C, Neubauer S, Vendelin M, Birkedal R. Unchanged mitochondrial organization and compartmentation of high-energy phosphates in creatine-deficient GAMT−/− mouse hearts. American Journal of Physiology-Heart and Circulatory Physiology. 2013;305(4):H506–H520. doi: 10.1152/ajpheart.00919.2012. - DOI - PMC - PubMed
    1. Cheng H, Lederer WJ. Calcium sparks. Physiological Reviews. 2008;88(4):1491–1545. doi: 10.1152/physrev.00030.2007. - DOI - PubMed
    1. Cheng H, Lederer W, Cannell M. Calcium sparks: elementary events underlying excitation-contraction coupling in heart muscle. Science. 1993;262(5134):740–744. doi: 10.1126/science.8235594. - DOI - PubMed