

Socio-spatial Self-organizing Maps: Using Social Media to Assess Relevant Geographies for Exposure to Social Processes
- PMID: 30957076
- PMCID: PMC6448781
- DOI: 10.1145/3274414
Socio-spatial Self-organizing Maps: Using Social Media to Assess Relevant Geographies for Exposure to Social Processes
Abstract
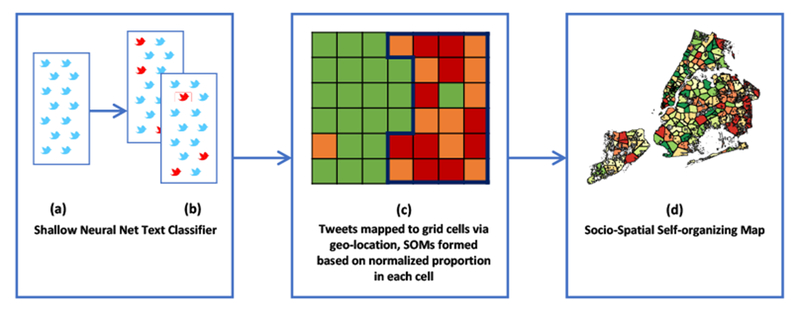
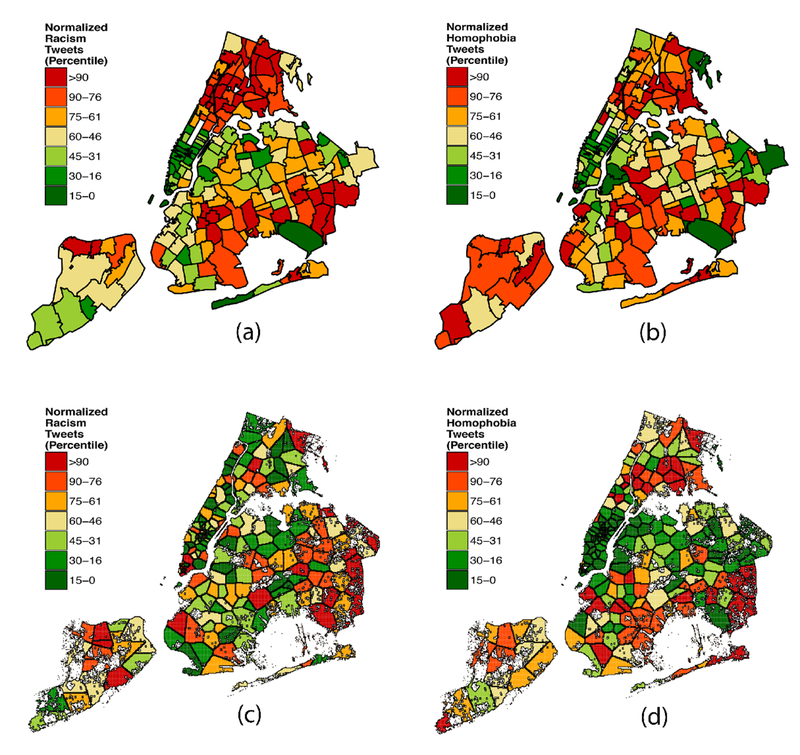
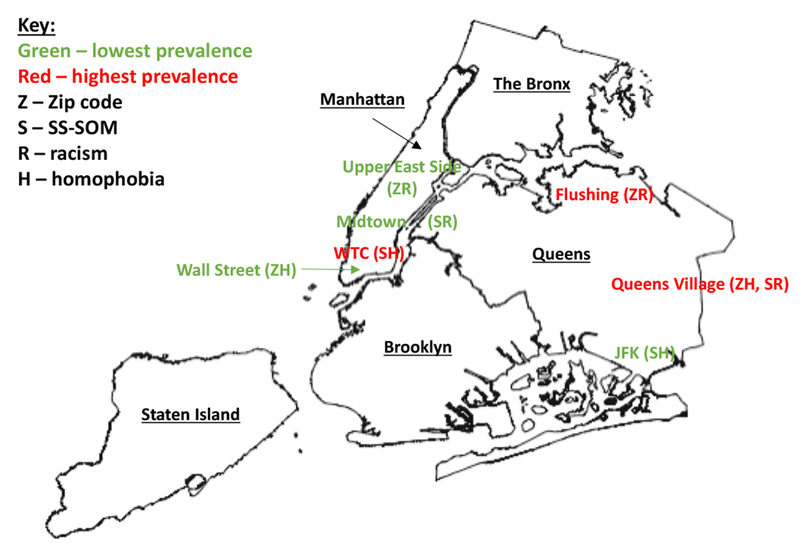
Social media offers a unique window into attitudes like racism and homophobia, exposure to which are important, hard to measure and understudied social determinants of health. However, individual geo-located observations from social media are noisy and geographically inconsistent. Existing areas by which exposures are measured, like Zip codes, average over irrelevant administratively-defined boundaries. Hence, in order to enable studies of online social environmental measures like attitudes on social media and their possible relationship to health outcomes, first there is a need for a method to define the collective, underlying degree of social media attitudes by region. To address this, we create the Socio-spatial-Self organizing map, "SS-SOM" pipeline to best identify regions by their latent social attitude from Twitter posts. SS-SOMs use neural embedding for text-classification, and augment traditional SOMs to generate a controlled number of nonoverlapping, topologically-constrained and topically-similar clusters. We find that not only are SS-SOMs robust to missing data, the exposure of a cohort of men who are susceptible to multiple racism and homophobia-linked health outcomes, changes by up to 42% using SS-SOM measures as compared to using Zip code-based measures.
Keywords: Clustering; homophobia; racism; self-organizing maps.
Figures

References
-
- Aosved Allison C, Long Patricia J, and Voller Emily K. 2009. Measuring sexism, racism, sexual prejudice, ageism, classism, and religious intolerance: The intolerant schema measure. Journal of Applied Social Psychology 39, 10 (2009), 2321–2354.
-
- Bação Fernando, Lobo Victor, and Painho Marco. 2004. Geo-self-organizing map (Geo-SOM) for building and exploring homogeneous regions. Geographic Information Science (2004), 22–37.
-
- Bartlett Jamie, Reffin Jeremy, Rumball Noelle, and Williamson Sarah. 2014. Anti-social media. Demos (2014), 1–51.
Grants and funding
LinkOut - more resources
Full Text Sources