. 2020 Jan;16(1):140-153.
doi: 10.1080/15548627.2019.1598754. Epub 2019 Apr 7.

The PARK10 gene USP24 is a negative regulator of autophagy and ULK1 protein stability

Affiliations

The PARK10 gene USP24 is a negative regulator of autophagy and ULK1 protein stability

Julia A Thayer et al. Autophagy. 2020 Jan.

Abstract

Recent studies indicate a causative relationship between defects in autophagy and dopaminergic neuron degeneration in Parkinson disease (PD). However, it is not fully understood how autophagy is regulated in the context of PD. Here we identify USP24 (ubiquitin specific peptidase 24), a gene located in the PARK10 (Parkinson disease 10 [susceptibility]) locus associated with late onset PD, as a novel negative regulator of autophagy. Our data indicate that USP24 regulates autophagy by affecting ubiquitination and stability of the ULK1 protein. Knockdown of USP24 in cell lines and in human induced-pluripotent stem cells (iPSC) differentiated into dopaminergic neurons resulted in elevated ULK1 protein levels and increased autophagy flux in a manner independent of MTORC1 but dependent on the class III phosphatidylinositol 3-kinase (PtdIns3K) activity. Surprisingly, USP24 knockdown also improved neurite extension and/or maintenance in aged iPSC-derived dopaminergic neurons. Furthermore, we observed elevated levels of USP24 in the substantia nigra of a subpopulation of idiopathic PD patients, suggesting that USP24 may negatively regulate autophagy in PD.Abbreviations: Bafilomycin/BafA: bafilomycin A1; DUB: deubiquitinating enzyme; iPSC: induced pluripotent stem cells; MTOR: mechanistic target of rapamycin kinase; MTORC1: MTOR complex 1; nt: non-targeting; PD: Parkinson disease; p-ATG13: phospho-ATG13; PtdIns3P: phosphatidylinositol 3-phosphate; RPS6: ribosomal protein S6; SNPs: single nucleotide polymorphisms; TH: tyrosine hydroxylase; USP24: ubiquitin specific peptidase 24.

Keywords: Autophagy; Parkinson disease; USP24; dopaminergic neurons; induced-pluripotent stem cells.


Figures

Figure 1.
Figure 1.
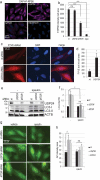
USP24 is a negative regulator of autophagy. (a) Semi-quantitative RT-PCR demonstrating knockdown of USP24 mRNA with 3 independent siRNA oligonucleotides (# 3, 6, 7, nt – non-targeting siRNA control) in H4 cells 72h after transfection. (b) Quantification of USP24:ACTB from figure (a). (c) Western blot demonstrating decreased USP24 protein levels and accumulation of LC3-II following USP24 knockdown in H4 cells. (d) Quantification of USP24:ACTB from figure (c). (e) Quantification of LC3-II:ACTB from figure (c). (f) Representative images of stable GFP-LC3 expressing H4 cells 72h following USP24 siRNA knockdown demonstrating accumulation of GFP-LC3 positive autophagosomes. Images were acquired at 20X; bar: 25 μm. (g) Quantification of autophagosome intensity per cell area from figure (f). All data are presented as ±SEM. *p < 0.05, **p < 0.01, ***p < 0.001. n = 4–18 (median cell number 568.5/group).
Figure 2.
Figure 2.
USP24 regulates autophagy flux upstream of the lysosomes. (a) Accumulation of LC3-II following USP24 knockdown is further increased in the presence of autophagy inhibitor bafilomycin (BafA). H4 cells were transfected with indicated siRNA for 72h and treated with BafA (100 nM) for 4–6 h; nt – non-targeting siRNA. (b) Quantification of LC3-II:ACTB from figure (a). (c) Representative images of H4 GFP-LC3 cells following USP24 knockdown ± BafA treatment demonstrating increased accumulation of GFP-LC3 autophagosomes. Images were acquired at 20X; bar: 25 μm. (d) Quantification of autophagosome intensity from figure (c). (e) Rate of autophagosome-lysosome fusion in increased following USP24 knockdown. Representative images of stable H4 mCHerry-GFP-LC3 dual reporter cells with USP24 knockdown, ± bafilomycin treatment. pH neutral autophagosomes are positive for both GFP and mCherry; acidified autolysosomes are positive for mCherry only. Treatment with BafA was used as a control for dependence on lysosomal acidification. Images were acquired at 60X; bar: 10 μm (f) Quantification of mCherry:GFP intensity from figure (e). Increased mCherry:GFP ratio is indicative of higher autophagy flux. (g) Stability assay demonstrating increased rate of SQSTM1 (p62) protein degradation in cells with USP24 knockdown. Cells were treated with cycloheximide (50 μg/μL) to inhibit protein synthesis. (h) Quantification of SQSTM1:ACTB from figure (g), for the 3-hour time point. All data are presented as ±SEM. *p < 0.05, **p < 0.01, ***p < 0.001. n = 4–9 (median cell number for 20X images 568.5/group median cell number for 60X images 21.5/group).
Figure 3.
Figure 3.
USP24 regulates the class III PtdIns3K activity. (a) Representative images of phosopho-RPS6 (P-RPS6) staining in H4 cells following USP24 knockdown, MTOR knockdown, or treatment with 100 nM rapamycin, demonstrating that USP24 does not regulate MTORC1 activity. (b) Quantification of P-RPS6 intensity from (a) (2 independent experiments, 6–12 replicates). (c) Representative images of H4 cells stably expressing the FYVE-dsRed reporter following USP24 knockdown, demonstrating increased accumulation of the class III PtdIns3K product, PtdIns3P. All images were acquired at 20X; bar: 25 μm. (d) Quantification of FYVE-dsRed accumulation in cells with USP24 knockdown from a representative experiment (4–8 replicates). (e) Western blot demonstrating that LC3-II accumulation in USP24 knockdown cells is attenuated following inhibition of the class III PtdIns3K with spautin (20 μM). (f) Quantification of LC3-II:ACTB from figure (e). (g) Representative fluorescence images demonstrating attenuated accumulation of autophagosomes in H4 GFP-LC3 cells with USP24 knockdown after spautin treatment. All images were acquired at 20X; bar: 25 μm. (h) Quantification of autophagosome intensity from figure (g). All data are presented as ±SEM. *p < 0.05, **p < 0.01, ***p < 0.001. n = 3–8 (median cell number 421/group).
Figure 4.
Figure 4.
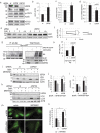
USP24 regulates protein stability of ULK1. (a) Western blot demonstrating increased levels of ULK1 and phospho-ATG13 (P-ATG13) in cells with USP24 knockdown. (b) Quantification of ULK1:ACTB from figure (a). (c) Quantification of P-ATG13:ACTB from figure (a). (d) Real time q-PCR quantification of ULK1:GAPDH mRNA expression following USP24 knockdown (e) Protein stability assay illustrating that USP24 knockdown decreases the rate of ULK1 degradation. Cells were treated with cycloheximide (50μg/μL) to inhibit protein synthesis. (f) Quantification of ULK1:ACTB from figure (e) at 0 and 3-hour time points. (g) IP demonstrating increased ubiquitination of ULK1 after USP24 knockdown. (h) Quantification of the ubiquitin (HA):ULK1 in figure (g). (i) Western blot demonstrating decreased levels of LC3-II in H4 cells with USP24 knockdown treated with ULK1 inhibitor MRT67307 (10 μM, 4 h) and BafA (100 nM, 3 h), as compared to BafA treatment alone. (j) Quantification of LC3-II:ACTB in BafA and BafA+MRT67307 conditions from figure (i). (k) Western blot demonstrating decreased levels of LC3-II in Hela cells with USP24 knockdown treated with MRT67307 (10 μM, 4 h) and BafA (100 nM, 3 h) as compared to BafA treatment alone. (l) Quantification of LC3-II:ACTB in BafA and BafA+MRT67307 conditions from figure (k). (m) Representative fluorescent images demonstrating attenuated accumulation of autophagosomes in H4 GFP-LC3 cells with USP24 knockdown after MRT68921 treatment. All images were acquired at 20X; bar: 25 μm. (n) Quantification of autophagosome intensity from figure (m). All data are presented as ±SEM. *p < 0.05, **p < 0.01, ***p < 0.001. n = 3–14 (median cell number 43/group).
Figure 5.
Figure 5.
USP24 regulates autophagy and neurite length in human iPSC-derived dopaminergic neurons. (a) Western blot illustrating the changes in LC3-II, NBR1, and phospho-ATG14 (P-ATG14) in human iPSC-derived dopaminergic neurons following USP24 knockdown. Dopaminergic precursor cells were differentiated into dopaminergic neurons for 2 wk, transduced with indicated lentiviral shRNAs and evaluated after an additional week in culture. (b) Quantification of USP24:tubulin levels from figure (a). (c) Quantification of LC3-II:tubulin levels from figure (a) (d) Quantification of NBR1:tubulin levels from figure (a) (2 independent experiments; 4–6 replicates) (e and f) Levels of LC3-II following USP24 knockdown are further increased with 100 μM chloroquine (chq) treatment (overnight). (e) Western blot illustrating change in LC3-II levels in human iPSC-derived dopaminergic neurons following USP24 knockdown. (f) Quantification of LC3-II:loading control from figure (e) (4–6 replicates). (g) Representative images of human iPSC-derived neurons at 6 wk after lentiviral transduction, showing increased neurite density in cultures with USP24 knockdown. Cells were transduced with indicated shRNAs; after additional 6 wk cultures were fixed and stained with antibodies against TUBB3/tubulin B3/TUJ1; all neurons) and TH (tyrosine hydroxylase; dopaminergic neurons). Images were acquired at 20X; bar: 25 μm. (h) Quantification of length of neuronal processes over time after lentiviral transduction with indicated shRNAs. All data are normalized to nt shRNA at 1-week time point. Statistical analysis at 1-week time point is presented in Figure S4 and at 6-weeks in (i-j). (i) Quantification of neurite length:neuron from figure (h) at 6-week time point. Data are normalized to nt shRNA at 6-week time point. (j) Quantification of neurite length:neuron for the dopaminergic neurons (TH positive) at 6-week time point. Data are normalized to nt shRNA at 6-week time point. All data are presented as ±SEM. *p < 0.05, **p < 0.01, ***p < 0.001 n = 3–10 (median cell number 634/group).
Figure 6.
Figure 6.
USP24 is differentially expressed in PD patient substantia nigra. (a) q-PCR quantification of USP24:GAPDH mRNA expression in PD patient SN versus unaffected control substantia nigra. All data points correspond to individuals (n = 4); group means are indicated with horizontal lines; error bars are SE; red circle marks a major statistical outlier (defined as a value above Q1-Q3 outer fence) with significantly increased expression of USP24 mRNA (z-score = 4.6). (b) Western blot illustrating USP24 protein levels in 4 PD patient and 4 unaffected age matched control human substantia nigra. (c) Quantification of USP24:ACTB levels from figure (b). Red circles mark major statistical outliers with significantly increased USP24 protein expression (z-scores = 4.5 and 11.0).

References

    1. Levine B, Klionsky DJ.. Development by self-digestion: molecular mechanisms and biological functions of autophagy. Dev Cell. 2004. April;6(4):463–477. PubMed PMID: 15068787. - PubMed
    1. Hara T, Nakamura K, Matsui M, et al. Suppression of basal autophagy in neural cells causes neurodegenerative disease in mice. Nature. 2006. June 15;441(7095):885–889. PubMed PMID: 16625204. - PubMed
    1. Komatsu M, Waguri S, Chiba T, et al. Loss of autophagy in the central nervous system causes neurodegeneration in mice. Nature. 2006. June 15;441(7095):880–884. PubMed PMID: 16625205. - PubMed
    1. Mizushima N, Levine B, Cuervo AM, et al. Autophagy fights disease through cellular self-digestion. Nature. 2008. February 28;451(7182):1069–1075. PubMed PMID: 18305538; eng. - PMC - PubMed
    1. Lesage S, Brice A. Role of mendelian genes in “sporadic” Parkinson‘s disease. Parkinsonism Relat Disord. 2012. January;18 Suppl 1:S66–S70. PubMed PMID: 22166458; eng. - PubMed

Publication types

MeSH terms

Substances

Supplementary concepts