

Body mass index and all cause mortality in HUNT and UK Biobank studies: linear and non-linear mendelian randomisation analyses
- PMID: 30957776
- PMCID: PMC6434515
- DOI: 10.1136/bmj.l1042
Body mass index and all cause mortality in HUNT and UK Biobank studies: linear and non-linear mendelian randomisation analyses
Abstract
Editor's note: Please see the Editor's Note (doi: https://doi.org/10.1136/bmj.l1042) on Methodological Criticism and an Updated Analysis
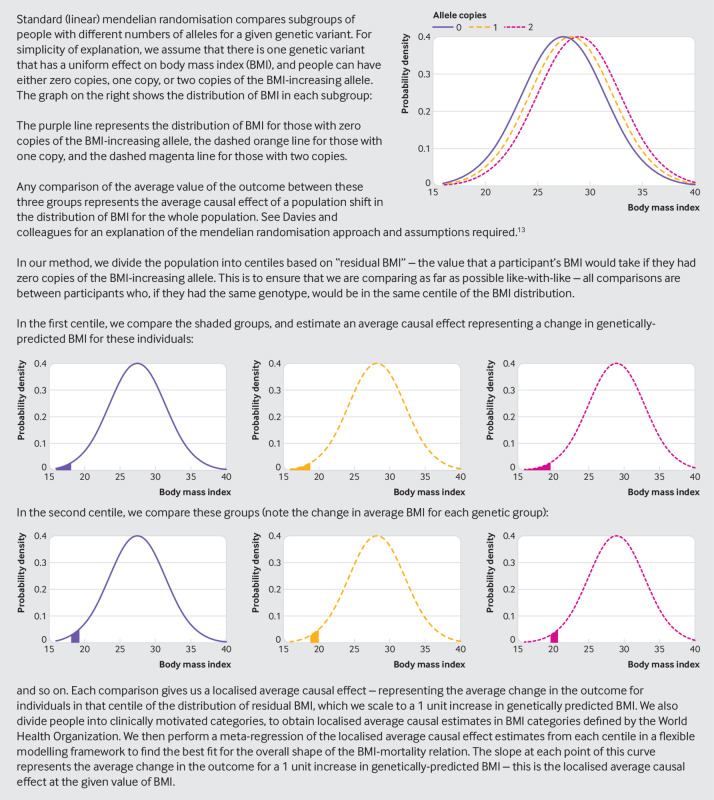
Objective: To investigate the shape of the causal relation between body mass index (BMI) and mortality.
Design: Linear and non-linear mendelian randomisation analyses.
Setting: Nord-Trøndelag Health (HUNT) Study (Norway) and UK Biobank (United Kingdom).
Participants: Middle to early late aged participants of European descent: 56 150 from the HUNT Study and 366 385 from UK Biobank.
Main outcome measures: All cause and cause specific (cardiovascular, cancer, and non-cardiovascular non-cancer) mortality.
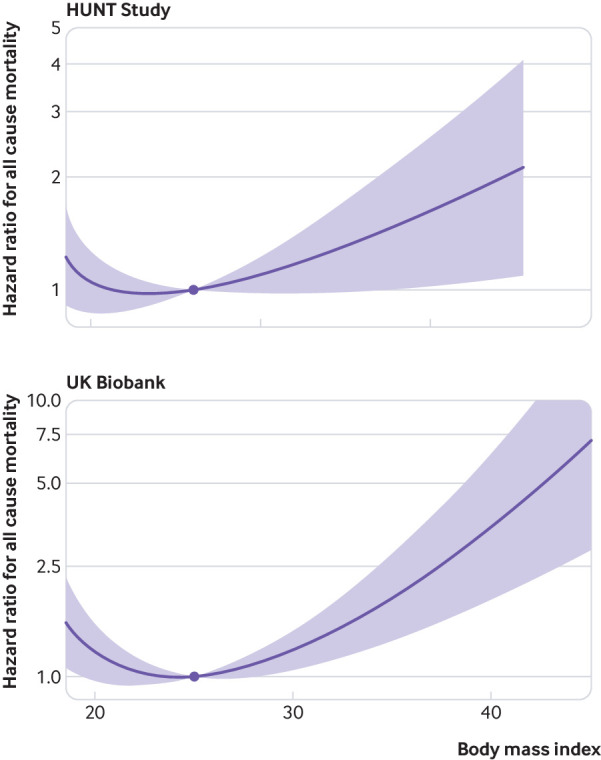
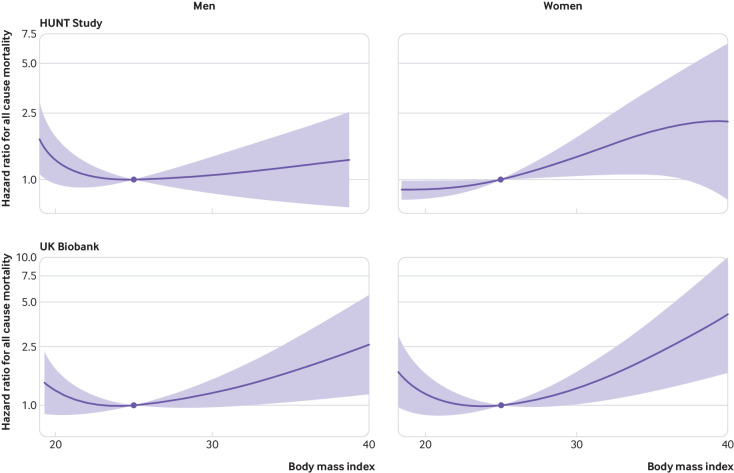
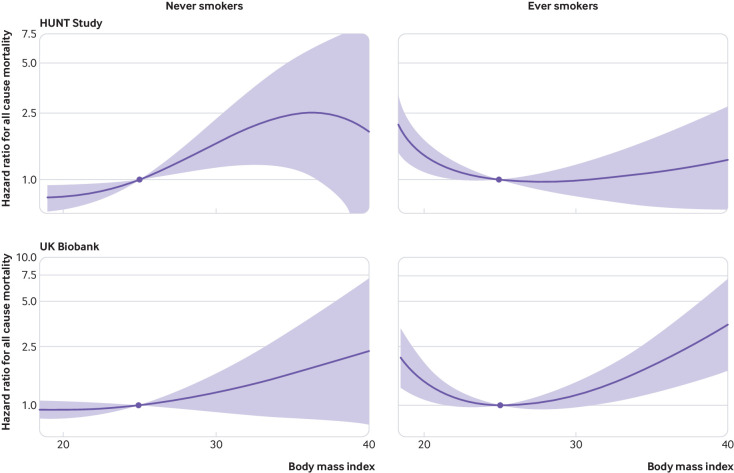
Results: 12 015 and 10 344 participants died during a median of 18.5 and 7.0 years of follow-up in the HUNT Study and UK Biobank, respectively. Linear mendelian randomisation analyses indicated an overall positive association between genetically predicted BMI and the risk of all cause mortality. An increase of 1 unit in genetically predicted BMI led to a 5% (95% confidence interval 1% to 8%) higher risk of mortality in overweight participants (BMI 25.0-29.9) and a 9% (4% to 14%) higher risk of mortality in obese participants (BMI ≥30.0) but a 34% (16% to 48%) lower risk in underweight (BMI <18.5) and a 14% (-1% to 27%) lower risk in low normal weight participants (BMI 18.5-19.9). Non-linear mendelian randomisation indicated a J shaped relation between genetically predicted BMI and the risk of all cause mortality, with the lowest risk at a BMI of around 22-25 for the overall sample. Subgroup analyses by smoking status, however, suggested an always-increasing relation of BMI with mortality in never smokers and a J shaped relation in ever smokers.
Conclusions: The previously observed J shaped relation between BMI and risk of all cause mortality appears to have a causal basis, but subgroup analyses by smoking status revealed that the BMI-mortality relation is likely comprised of at least two distinct curves, rather than one J shaped relation. An increased risk of mortality for being underweight was only evident in ever smokers.
Published by the BMJ Publishing Group Limited. For permission to use (where not already granted under a licence) please go to http://group.bmj.com/group/rights-licensing/permissions.
Conflict of interest statement
Competing interests: All authors have completed the ICMJE uniform disclosure form at www.icmje.org/coi_disclosure.pdf and declare: no support from any organisation for the submitted work; no financial relationships with any organisations that might have an interest in the submitted work in the previous three years, no other relationships or activities that could appear to have influenced the submitted work.
Figures

References
-
- World Health Organization . Obesity: preventing and managing the global epidemic. Report of a WHO consultation. World Health Organ Tech Rep Ser 2000;894:i-xii, 1-253. - PubMed
-
- Wang H, Abajobir AA, Abate KH, et al. GBD 2016 Mortality Collaborators . Global, regional, and national under-5 mortality, adult mortality, age-specific mortality, and life expectancy, 1970-2016: a systematic analysis for the Global Burden of Disease Study 2016. Lancet 2017;390:1084-150. 10.1016/S0140-6736(17)31833-0 - DOI - PMC - PubMed
Publication types
MeSH terms
Grants and funding
LinkOut - more resources
Full Text Sources