. 2019 Feb 28;16(151):20180709.
doi: 10.1098/rsif.2018.0709.

In vitro cell migration quantification method for scratch assays

Affiliations

In vitro cell migration quantification method for scratch assays

Ana Victoria Ponce Bobadilla et al. J R Soc Interface. .

Abstract

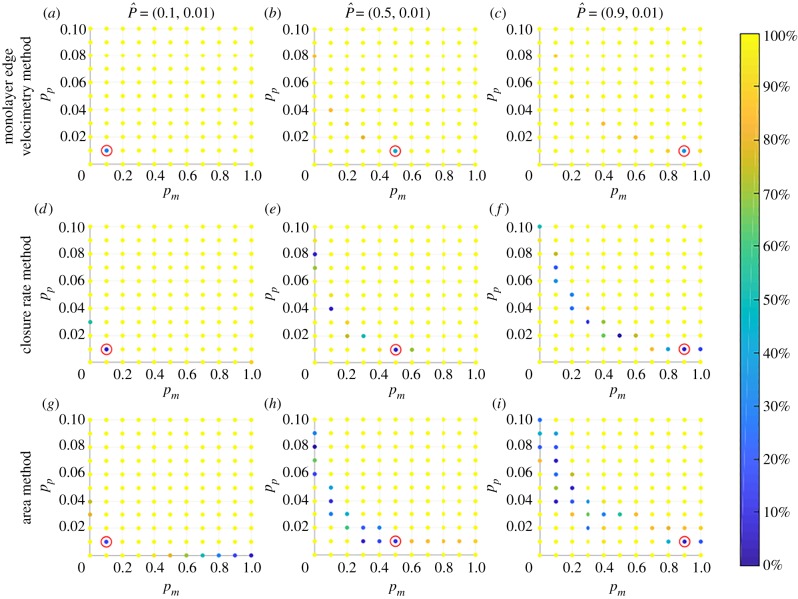
The scratch assay is an in vitro technique used to assess the contribution of molecular and cellular mechanisms to cell migration. The assay can also be used to evaluate therapeutic compounds before clinical use. Current quantification methods of scratch assays deal poorly with irregular cell-free areas and crooked leading edges which are features typically present in the experimental data. We introduce a new migration quantification method, called 'monolayer edge velocimetry', that permits analysis of low-quality experimental data and better statistical classification of migration rates than standard quantification methods. The new method relies on quantifying the horizontal component of the cell monolayer velocity across the leading edge. By performing a classification test on in silico data, we show that the method exhibits significantly lower statistical errors than standard methods. When applied to in vitro data, our method outperforms standard methods by detecting differences in the migration rates between different cell groups that the other methods could not detect. Application of this new method will enable quantification of migration rates from in vitro scratch assay data that cannot be analysed using existing methods.

Keywords: migration quantification methods; migration rates; scratch assays.


Conflict of interest statement

We declare we have no competing interests.

Figures

Figure 1.
Figure 1.
Time-lapse images of a representative scratch assay from each of the six experimental cell groups (S1–S6) are plotted at time 0, 4, 8 and 12 h. In each image, the leading edges were detected by applying the segmentation algorithm. The resulting interfaces/cell fronts are plotted in blue. (Online version in colour.)
Figure 2.
Figure 2.
Evolution of an agent-based simulation. We considered an idealized initial condition and fixed the migration and proliferation parameters so that pm = 0.3 and pp = 0.01, respectively. The recolonization of the wounded region is shown at times t = 0, 4, 8 and 16 h. For ease of visualization, the two cell monolayers (right and left) are plotted with different colours (red and turquoise), while the area devoid of cells is coloured blue. The leading edges detected by the segmentation algorithm are plotted in yellow. (Online version in colour.)
Figure 3.
Figure 3.
Linear approximation of the front position over time with respect to window size w for one of the scratch assays from the experimental cell groups. (a) To introduce the notation, the positions of the left front at times t = 0, 5 and 10 h are plotted in blue. The solid line corresponds to t = 0 h; the dashed line to 5 h and the dotted line to 10 h. The front positions at the 100, 200, 300 and 400 y-coordinates for these times are plotted: yellow, orange, purple and green, respectively. (b) The left front at t = 5 h is approximated by a window size w. Y is partitioned into M segments denoted Ys, 1 ≤ sM, each with length w. A magenta horizontal line delimits each segment. The front position is plotted in blue and the approximated front position, taken as an average over each Ys, is plotted in red. (c) The time evolution of the interfaces at the 100, 200, 300 and 400 y-coordinates and the linear approximation with respect to the window size w = 16 are plotted using dotted lines and dashed lines, respectively. The window size w = 16 is the window size that maximizes the objective function (2.7). (Online version in colour.)
Figure 4.
Figure 4.
Sensitivity analysis of the agent-based model. We analyse the variability of the windowed velocities with respect to the proliferation and migration probabilities (pm, pp) ∈ [0, 1] × [0, 0.1]. In (a) and (b), we plot the mean and the standard deviation of windowed velocities of 150 simulations under each of these 121 parameter pairs. (Online version in colour.)
Figure 5.
Figure 5.
Plots of the mean behaviour of the classification tests for the monolayer edge velocimetry method. The classification tests are performed by considering a K–S test, a sample set of n = 4 simulations and the focal parameters (a) P^=(0.1,0.01), (b) P^=(0.5,0.01) and (c) P^=(0.9,0.01). In each plot at each parameter pair (pm, pp), the colour of the circle denotes the percentage of times the migration measurements of that parameter pair are statistically significantly different to those for the focal parameter P^. We indicate the focal parameter pair with a red circle. The plots illustrate how the classification performance of the method varies as the migration parameter varies. The method performs better when the migration parameter is small. (Online version in colour.)
Figure 6.
Figure 6.
Series of plots showing how the performance of the three quantification methods changes as the migration rate of the focal parameters varies. In each plot, the colour of the circle at each parameter pair (pm, pp) indicates the percentage of times the migration measurements associated with the parameter pair are statistically significantly different from those associated with the focal parameters P^. The focal parameters P^ are indicated by a red circle. The results reveal that the monolayer edge velocimetry method yields a better statistical classification than the other methods. We note also the performance of all three methods declines as the migration rate of the focal parameters P^ increases. (Online version in colour.)
Figure 7.
Figure 7.
Boxplots of the windowed velocities with respect to the optimal window size of 16 μm for each experimental scratch assay. (Online version in colour.)
Figure 8.
Figure 8.
Statistical analysis of the experimental data using the velocity and the closure rate method. First, the migration measurements are grouped into the six different groups (S1–S6). The windowed velocities and the closure rates for the cell groups are plotted in (a), (b). respectively. Above the data, in black, we have reported the statistical significance results from performing a K–S test with respect to the S1 group. Below the data, we have done the same for the t-tests. Considering the windowed velocities, with respect to the K–S test and t-test, the null hypothesis was rejected testing group S1 against groups S2, S3 and S4 at the 0.001 significance level. Performing the statistical tests with the closure rate measurements, the null hypothesis was rejected at the significance level of 0.05 between S1 and S3. The statistical significance level is decoded in the symbols: *pvalue ≤ 0.05, **pvalue ≤ 0.01, ***pvalue ≤ 0.001 and ****pvalue ≤ 0.0001. (Online version in colour.)

References

    1. Friedl P, Gilmour D. 2009. Collective cell migration in morphogenesis, regeneration and cancer. Nat. Rev. Mol. Cell Biol. 10, 445–457. (10.1038/nrm2720) - DOI - PubMed
    1. Li L, He Y, Zhao M, Jiang J. 2013. Collective cell migration: implications for wound healing and cancer invasion. Burns Trauma 1, 21 (10.4103/2321-3868.113331) - DOI - PMC - PubMed
    1. Grada A, Otero-Vinas M, Prieto-Castrillo F, Obagi Z, Falanga V. 2017. Research techniques made simple: analysis of collective cell migration using the wound healing assay. J. Investig. Dermatol. 137, e11–e16. (10.1016/j.jid.2016.11.020) - DOI - PubMed
    1. Kramer N, Walzl A, Unger C, Rosner M, Krupitza G, Hengstschläger M, Dolznig H. 2013. In vitro cell migration and invasion assays. Mut. Res./Rev. Mut. Res. 752, 10–24. (10.1016/j.mrrev.2012.08.001) - DOI - PubMed
    1. Liang C-C, Park AY, Guan J-L. 2007. In vitro scratch assay: a convenient and inexpensive method for analysis of cell migration in vitro. Nat. Protoc. 2, 329–333.. (10.1038/nprot.2007.30) - DOI - PubMed

Publication types

LinkOut - more resources