. 2019 Apr 8:8:e42869.
doi: 10.7554/eLife.42869.

Nationally-representative serostudy of dengue in Bangladesh allows generalizable disease burden estimates

Affiliations

Nationally-representative serostudy of dengue in Bangladesh allows generalizable disease burden estimates

Henrik Salje et al. Elife. .

Abstract

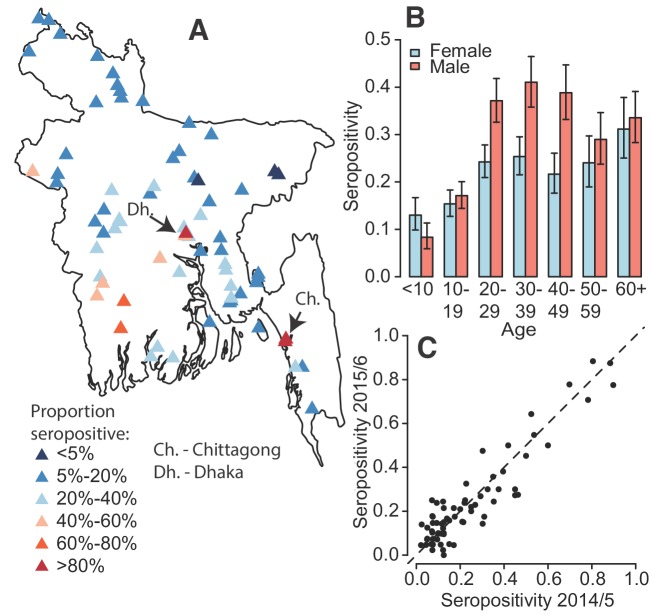
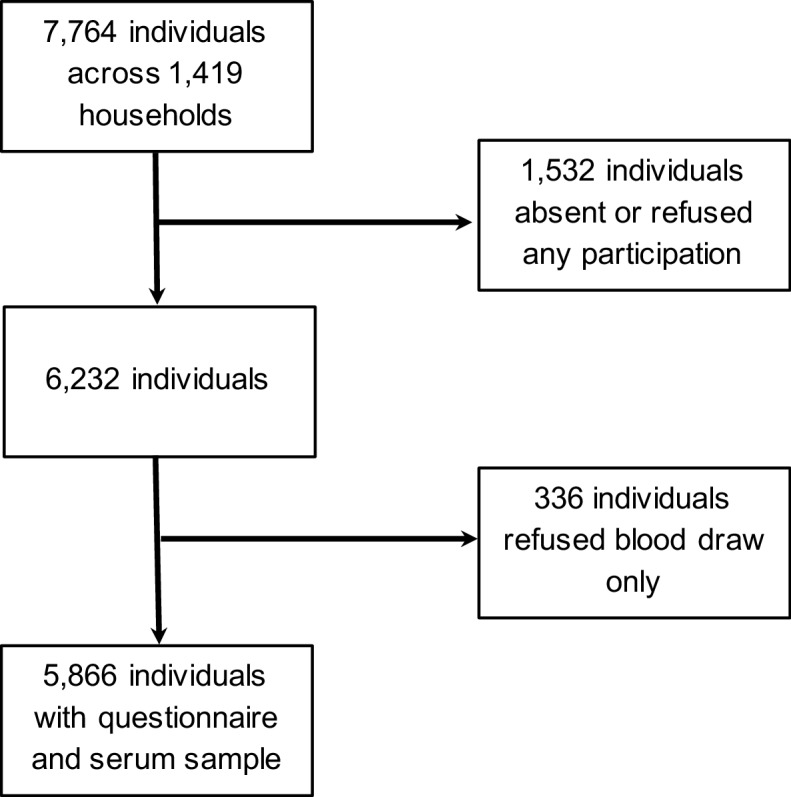
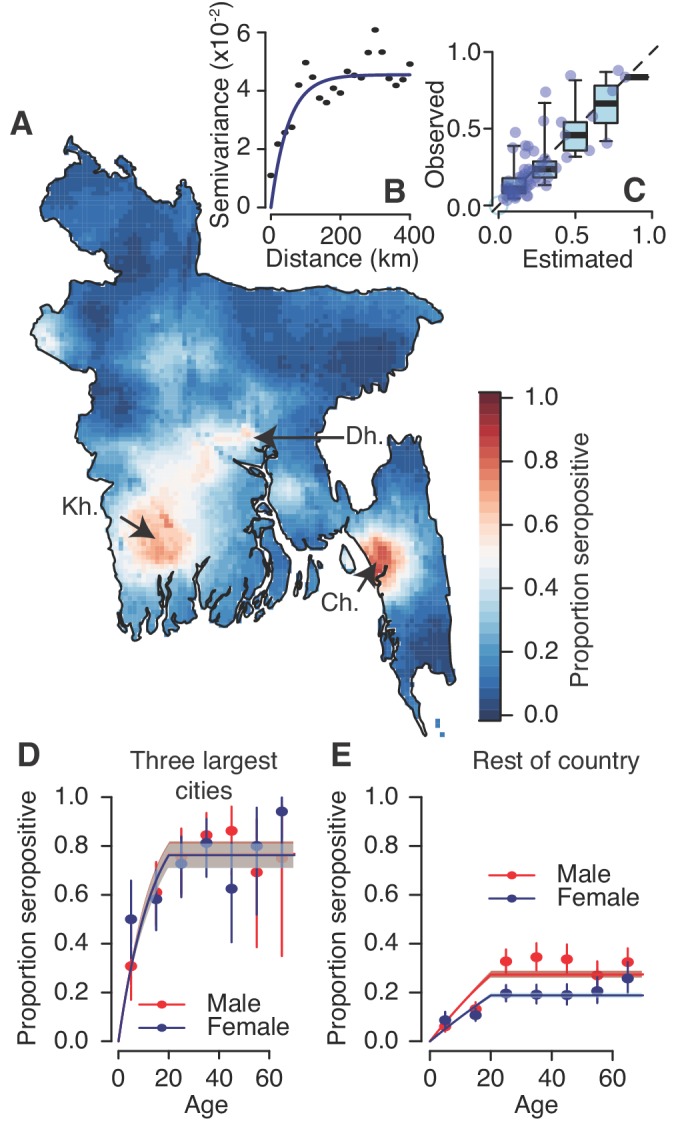
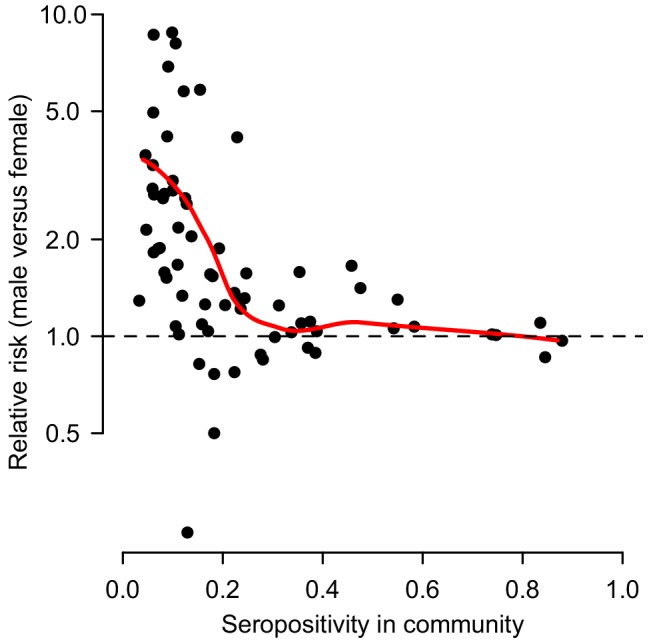
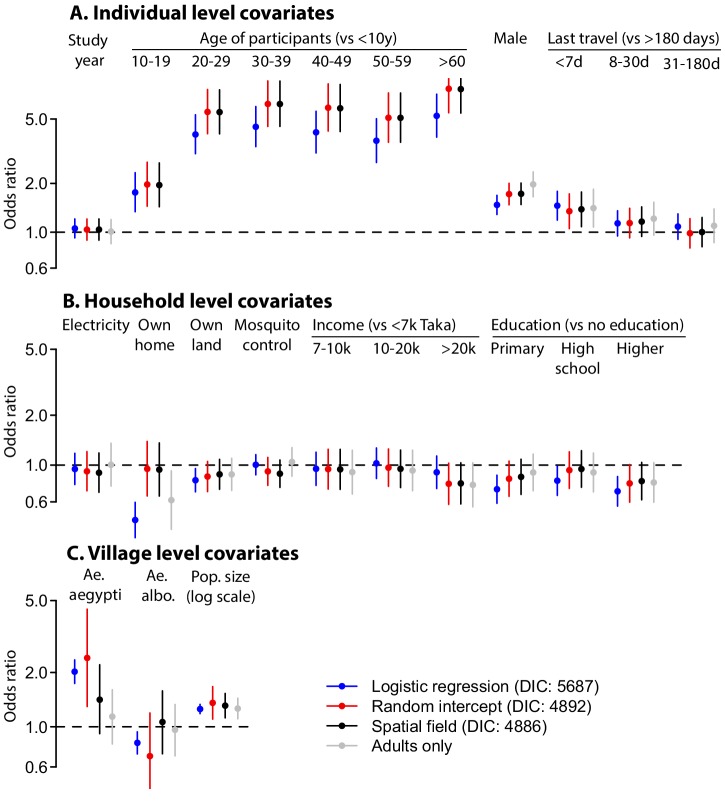
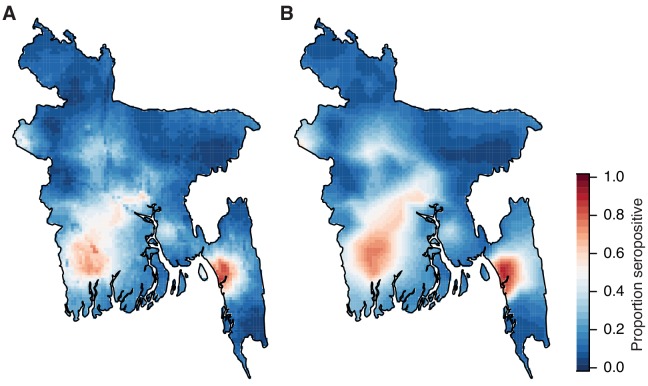
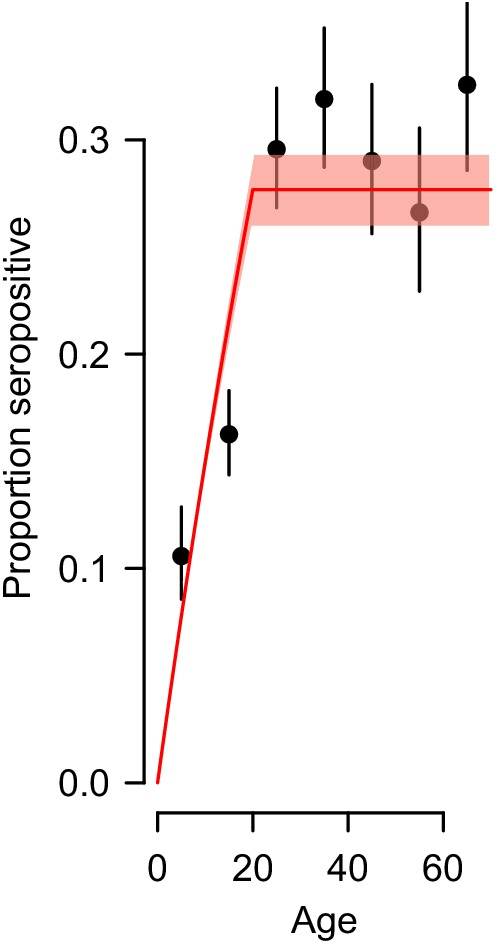
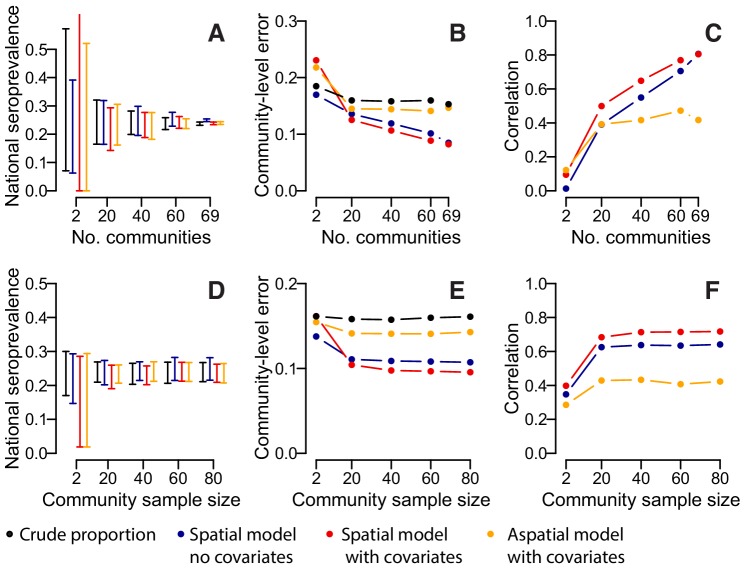
Serostudies are needed to answer generalizable questions on disease risk. However, recruitment is usually biased by age or location. We present a nationally-representative study for dengue from 70 communities in Bangladesh. We collected data on risk factors, trapped mosquitoes and tested serum for IgG. Out of 5866 individuals, 24% had evidence of historic infection, ranging from 3% in the north to >80% in Dhaka. Being male (aOR:1.8, [95%CI:1.5-2.0]) and recent travel (aOR:1.3, [1.1-1.8]) were linked to seropositivity. We estimate that 40 million [34.3-47.2] people have been infected nationally, with 2.4 million ([1.3-4.5]) annual infections. Had we visited only 20 communities, seropositivity estimates would have ranged from 13% to 37%, highlighting the lack of representativeness generated by small numbers of communities. Our findings have implications for both the design of serosurveys and tackling dengue in Bangladesh.

Keywords: Bangladesh; Seroprevalence; dengue; epidemiology; global health; nationally-representative; virus.


Conflict of interest statement

HS, KP, RP, IR, ZR, MA, MR, HA, JH, EG No competing interests declared

Figures

Figure 1.
Figure 1.. Dengue seropositivity in the sampled communities.
(A) Locations of sampled communities and the estimated seroprevalence by community. (B) Proportion seropositive by age and sex with 95% confidence intervals. (C) Seropositivity in Y1 compared to seropositivity in Y2 for each community.
Figure 1—figure supplement 1.
Figure 1—figure supplement 1.. Participants included in study.
Figure 1—figure supplement 2.
Figure 1—figure supplement 2.. Distribution of age groups in years and sex (solid bars) in the study population compared to the 2011 census (lines).
Figure 1—figure supplement 3.
Figure 1—figure supplement 3.. Histogram of PanBio Units derived from the optical densities of the PanBio assay with the manufacturer recommended cutpoint (PanBio Unit of 11) in dashed red.
Those to the left of the dashed line are considered seronegative and those to the right of the line are considered seropositive.
Figure 2.
Figure 2.. Modelled dengue seropositivity across Bangladesh and across age groups.
(A) Spatial predictions of seropositivity for the whole country. Kh. = Khulna, Dh. = Dhaka, Ch. = Chittagong (B) Semivariogram showing spatial dependence between the proportion seropositive between communities as a function of distance between them. (C) Observed versus predicted levels of seropositivity by community from leave one out cross validation. (D) Observed (points) and fitted seropositivity by age for the sampled communities within the three largest cities (Khulna, Chittagong and Dhaka) for both males and females. (E) Observed and fitted seropositivity for the remaining communities by sex.
Figure 2—figure supplement 1.
Figure 2—figure supplement 1.. Relative risk of being seropositive for males versus females as a function of the overall proportion seropositive in the community.
The red line represents a LOESS curve fit through the 70 points.
Figure 2—figure supplement 2.
Figure 2—figure supplement 2.. Differences in coefficient estimates in multivariable models run using logistic regression with no random intercept or spatial covariance (blue), with random intercepts at the household and community level (red) and with random intercepts at the household and community level and a Matern spatial covariance matrix (black, base model).
In addition the results of the spatial field model but restricted to individuals over 20y is shown (grey). The bars represent 95% confidence intervals each time.
Figure 2—figure supplement 3.
Figure 2—figure supplement 3.. Comparison of risk maps using different prediction methods.
(A) Spatial prediction map using age, sex and population size and a Matern covariance structure. (B). Spatial prediction using a Matern spatial covariance only.
Figure 2—figure supplement 4.
Figure 2—figure supplement 4.. Observed proportion seropositive by age group with 95% confidence intervals (black) and the fit using the force of infection estimated by the catalytic model (red).
We used the probability of being seropositive as a function of age from the whole country to estimate the proportion of the susceptible population (individuals that have never been exposed to dengue) that get infected each year.
Figure 3.
Figure 3.. Accuracy of estimates for different number of sampled communities (top row) and different numbers of sampled individuals per community (bottom row) using different estimation methods.
(A) 95% range of estimates of overall seroprevalence from 100 repeated iterations when data from a random subset of communities is used. (B) Mean absolute error among heldout communities over repeated iterations. (C) Mean correlation between predicted and observed seroprevalence among heldout communities. (D) 95% range of estimates of overall seroprevalence from 100 repeated iterations when data from a random number of individuals from 50 communities is used. (E) Mean absolute error among 20 randomly selected heldout communities over repeated iterations. (F) Mean correlation between predicted and observed seroprevalence among 20 randomly selected heldout communities. The different estimation methods are overall proportion seropositive (black), spatial correlation model using Matern covariance structure and no covariates (blue), spatial correlation model using Matern covariance structure and age, sex and population size as covariates, logistic regression using age, sex and population size as covariates with no spatial component (orange).
Author response image 1.

Comment in

  • doi: 10.7554/eLife.47458

References

    1. Bhatt S, Gething PW, Brady OJ, Messina JP, Farlow AW, Moyes CL, Drake JM, Brownstein JS, Hoen AG, Sankoh O, Myers MF, George DB, Jaenisch T, Wint GR, Simmons CP, Scott TW, Farrar JJ, Hay SI. The global distribution and burden of dengue. Nature. 2013;496:504–507. doi: 10.1038/nature12060. - DOI - PMC - PubMed
    1. Braks MAH, Honório NA, Lounibos LP, Lourenço-De-Oliveira R, Juliano SA. Interspecific competition between two invasive species of container mosquitoes, Aedes aegypti andAedes albopictus (Diptera: Culicidae), in Brazil. Annals of the Entomological Society of America. 2004;97:130–139. doi: 10.1603/0013-8746(2004)097[0130:ICBTIS]2.0.CO;2. - DOI
    1. De Melker HE, Conyn-van Spaendonck MA. Immunosurveillance and the evaluation of national immunization programmes: a population-based approach. Epidemiology and Infection. 1998;121:637–643. doi: 10.1017/S0950268898001587. - DOI - PMC - PubMed
    1. Dhar-Chowdhury P, Paul KK, Haque CE, Hossain S, Lindsay LR, Dibernardo A, Brooks WA, Drebot MA. Dengue seroprevalence, seroconversion and risk factors in Dhaka, Bangladesh. PLOS Neglected Tropical Diseases. 2017;11:e0005475. doi: 10.1371/journal.pntd.0005475. - DOI - PMC - PubMed
    1. Ferguson NM, Donnelly CA, Anderson RM. Transmission dynamics and epidemiology of dengue: insights from age-stratified sero-prevalence surveys. Philosophical Transactions of the Royal Society of London. Series B: Biological Sciences. 1999;354:757–768. doi: 10.1098/rstb.1999.0428. - DOI - PMC - PubMed

Publication types