

A Computerized Continuous-Recognition Task for Measurement of Episodic Memory
- PMID: 30958384
- PMCID: PMC6597981
- DOI: 10.3233/JAD-190167
A Computerized Continuous-Recognition Task for Measurement of Episodic Memory
Abstract
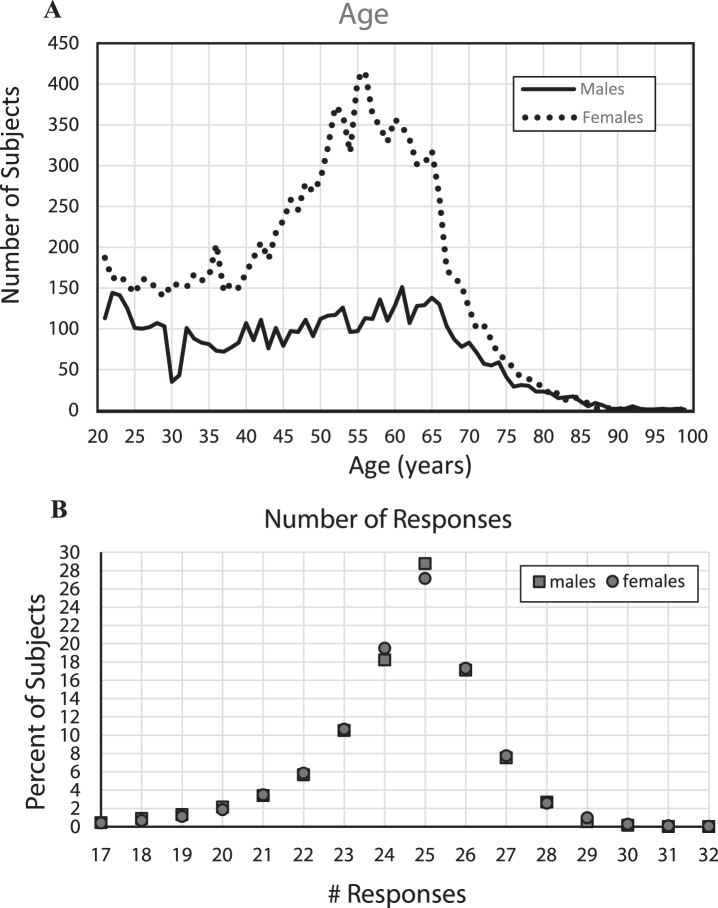
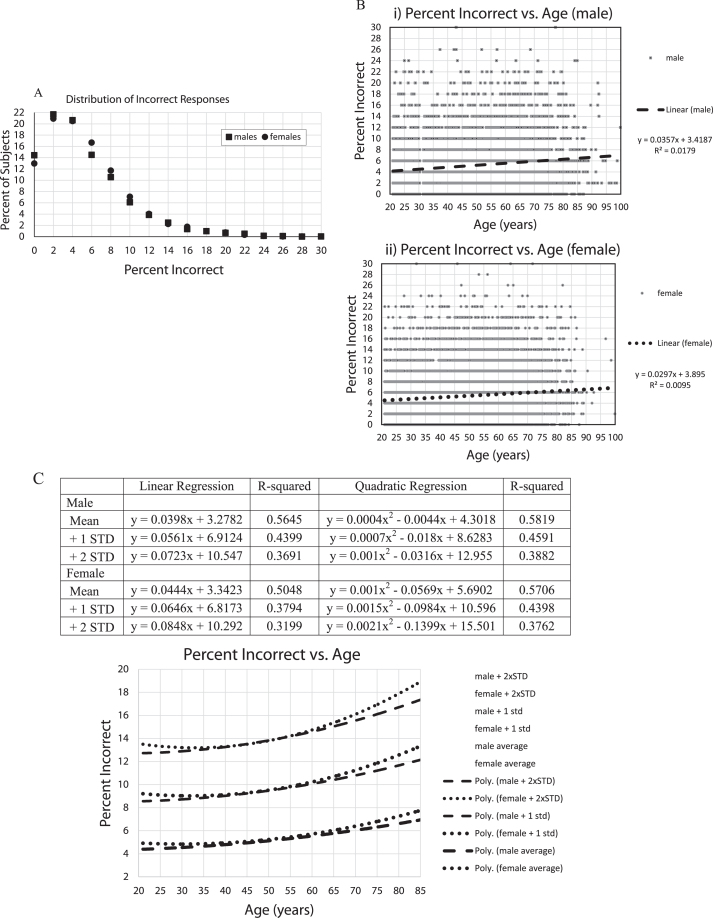
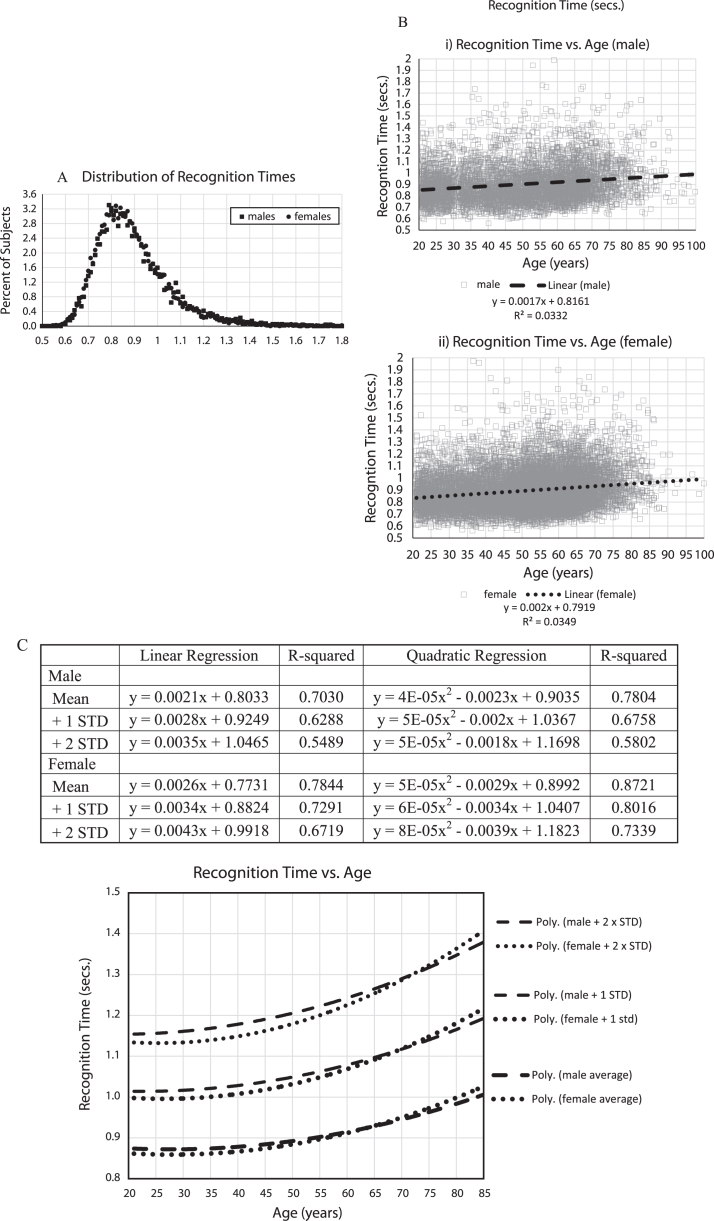
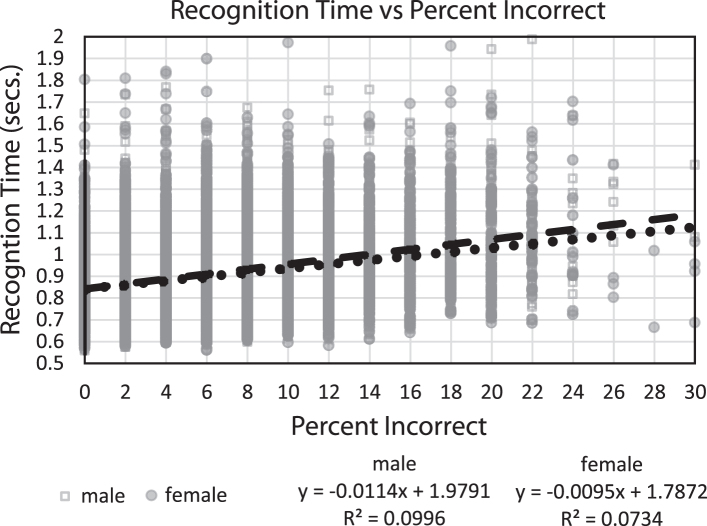
Based on clinical observations of severe episodic memory (EM) impairment in dementia of Alzheimer's disease (AD), a brief, computerized EM test was developed for AD patient evaluation. A continuous recognition task (CRT) was chosen because of its extensive use in EM research. Initial experience with this computerized CRT (CCRT) showed patients were very engaged in the test, but AD patients had marked failure in recognizing repeated images. Subsequently, the test was administered to audiences, and then a two-minute online version was implemented (http://www.memtrax.com). The online CCRT shows 50 images, 25 unique and 25 repeats, which subjects respectively either try to remember or indicate recognition as quickly as possible. The pictures contain 5 sets of 5 images of scenes or objects (e.g., mountains, clothing, vehicles, etc.). A French company (HAPPYneuron, SAS) provided the test for 2 years, with these results. Of 18,477 individuals, who indicated sex and age 21-99 years and took the test for the first time, 18,007 individuals performed better than chance. In this group, age explained 1.5% of the variance in incorrect responses and 3.5% of recognition time variance, indicating considerable population variability. However, when averaging for specific year of age, age explained 58% of percent incorrect variance and 78% of recognition time variance, showing substantial population variability but a major age effect. There were no apparent sex effects. Further studies are indicated to determine the value of this CCRT as an AD screening test and validity as a measure of EM impairment in other clinical conditions.
Keywords: Aging; Alzheimer’s disease; cognition; cognitive impairment; dementia; episodic memory; memory; reaction time; recognition.
Conflict of interest statement
Authors’ disclosures available online (
Figures
References
-
- Ashford JW, Kolm P, Colliver JA, Bekian C, Hsu LN (1989) Alzheimer patient evaluation and the mini-mental state: Item characteristic curve analysis. J Gerontol 44, P139–146. - PubMed
-
- Ashford JW, Coburn KL, Fuster JM (1998) Functional cognitive networks in primates In Fundamentals of Neural Networks: Neuropsychology and Cognitive Neuroscience, Parks RW, Levine DS, eds. The MIT Press, Cambridge, Mass.
-
- Fuster JM (2006) The cognit: A network model of cortical representation. Int J Psychophysiol 60, 125–132. - PubMed
-
- Buschke H, Fuld PA (1974) Evaluating storage, retention, and retrieval in disordered memory and learning. Neurology 24, 1019–1025. - PubMed
-
- Benton AL (1962) The visual retention test as a constructional praxis task. Confin Neurol 22, 141–155. - PubMed
MeSH terms
LinkOut - more resources
Full Text Sources
Research Materials
