. 2019 Aug 1:196:32-40.
doi: 10.1016/j.neuroimage.2019.03.076. Epub 2019 Apr 5.

Cortical dynamics during psychedelic and anesthetized states induced by ketamine

Affiliations

Cortical dynamics during psychedelic and anesthetized states induced by ketamine

Duan Li et al. Neuroimage. .

Abstract

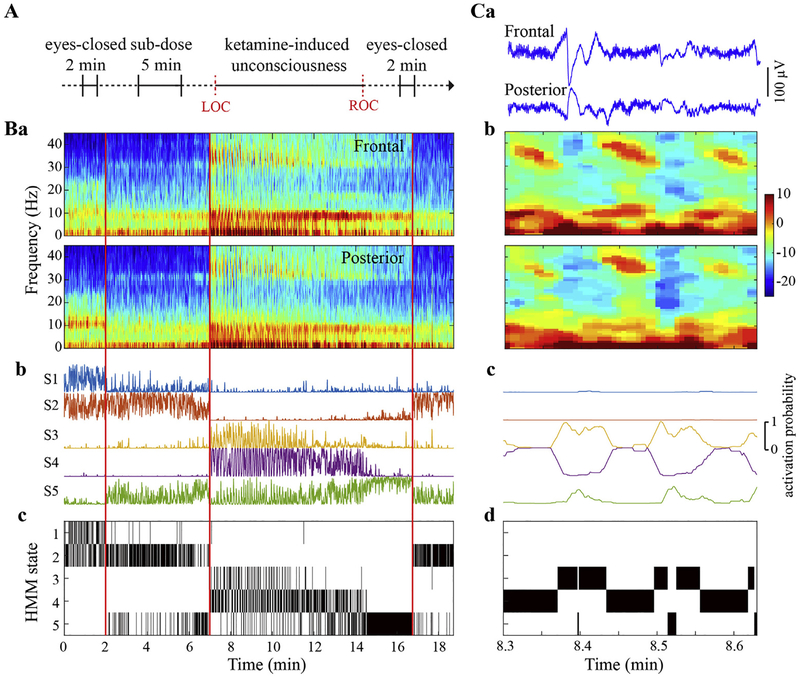
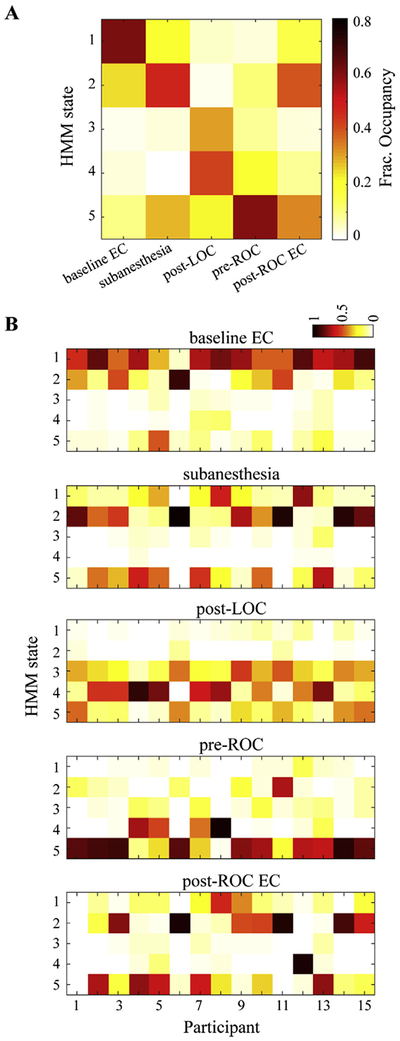
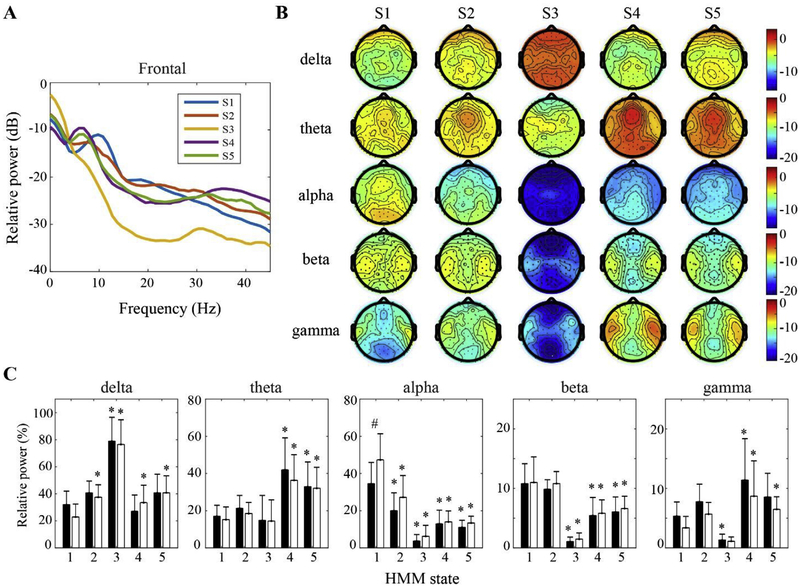
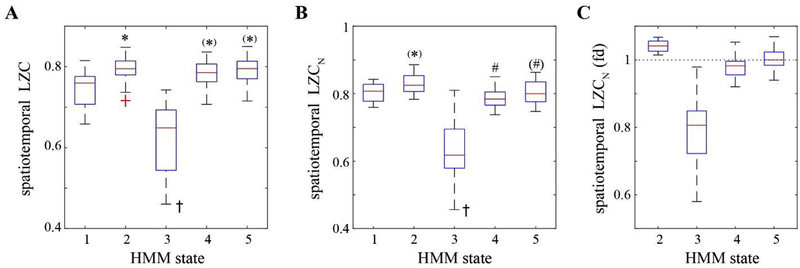
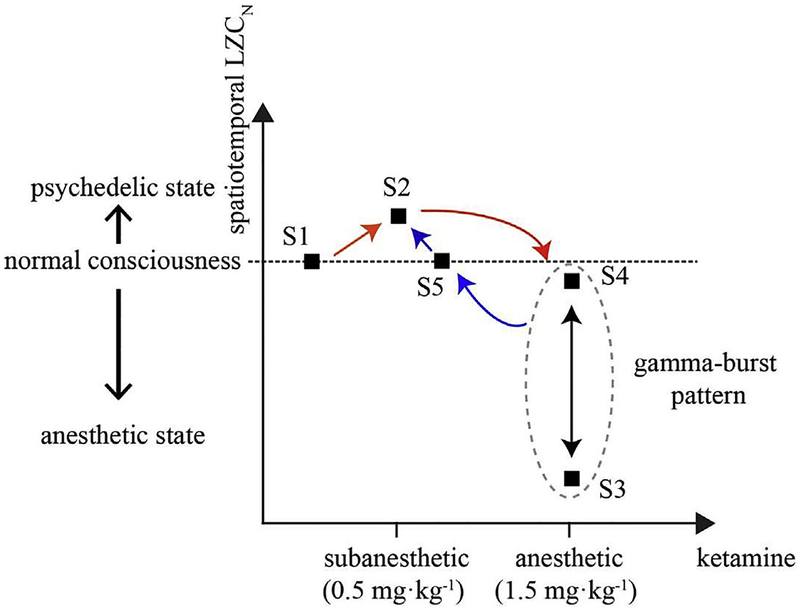
Ketamine is a unique drug that has psychedelic and anesthetic properties in a dose-dependent manner. Recent studies have shown that ketamine anesthesia appears to maintain the spatiotemporal complexity of cortical activation evoked by transcranial magnetic stimulation, while a psychedelic dose of ketamine is associated with increased spontaneous magnetoencephalographic signal diversity. However, a systematic investigation of the dose-dependent effects of ketamine on cortical complexity using the same modality is required. Furthermore, it is unknown whether the complexity level stabilizes or fluctuates over time for the duration of ketamine exposure. Here we investigated the spatiotemporal complexity of spontaneous high-density scalp electroencephalography (EEG) signals in healthy volunteers during alterations of consciousness induced by both subanesthetic and anesthetic doses of ketamine. Given the fast transient spectral dynamics, especially during the gamma-burst pattern after loss of consciousness, we employed a method based on Hidden Markov modeling to classify the EEG signals into a discrete set of brain states that correlated with different behavioral states. We characterized the spatiotemporal complexity specific for each brain state as measured through the Lempel-Ziv complexity algorithm. After controlling for signal diversity due to spectral changes, we found that the subanesthetic dose of ketamine is associated with an elevated complexity level relative to baseline, while the brain activity following an anesthetic dose of ketamine is characterized by alternating low and high complexity levels until stabilizing at a high level comparable to that during baseline. Thus, spatiotemporal complexity associated with ketamine-induced state transitions has features of general anesthesia, normal consciousness, and altered states of consciousness. These results improve our understanding of the complex pharmacological, neurophysiological, and phenomenological properties of ketamine.

Keywords: Consciousness; Dynamics; Electroencephalography; General anesthesia; Ketamine; Lempel-Ziv complexity; Psychedelic state.


Figures

Fig. 1.
Fig. 1.
Experimental design and the inference of Hidden Markov Model (HMM) states. (A) Experimental design and timeline. The electroencephalographic (EEG) data was recorded throughout the entire experiment and the four periods during eyes-closed baseline, subanesthetic, anesthetic, and recovery, as indicated in bold horizontal lines, were concatenated for the analysis. LOC, loss of consciousness. ROC, recovery of consciousness. (B) Representative spectrograms from frontal (average of F1, F2, and Fz) and posterior (average of PO3, PO4, POz) channels (a) were estimated via multitaper method in 1-s window with 0.5-s overlap, time-bandwidth product = 2, number of tapers = 3. Five HMM states were inferred from Hidden Markov modeling based on the frontal-posterior spectral dynamics, with the probability time course (smoothed via a 1-s sliding window) indicating the probability of each HMM state being active (b) and the HMM states time courses showing the most probable state at each time point (c). The black vertical lines differentiate the baseline, subanesthetic, anesthetic and recovery periods respectively. (C) Representative EEG signals (a), spectrograms (b), and HMM state time courses (c and d) during gamma-burst pattern after LOC. The gamma-burst pattern is characterized by alternating delta and theta-gamma activities, as evident in EEG signals and spectrograms, which were classified into distinct HMM states (c and d).
Fig. 2.
Fig. 2.
The inferred HMM states are associated with different behavioral states. (A) Fractional occupancy, i.e., the fraction of time spent in each HMM state for each behavioral state across all participants. For each participant, five segments of 2-min were selected to represent the different behavioral states: eyes-closed baseline, subanesthesia, post-LOC, pre-ROC, and recovery. (B) fractional occupancy of HMM states for each behavioral state at the single participant level. The recovery period was not recorded for participant 01, as indicated by all zero occupancy across all HMM states for this participant in the bottom-most panel. EC, eyes-closed.
Fig. 3.
Fig. 3.
HMM state-specific spectral power analysis. (A) Group-level power spectrum of frontal EEG, averaged across F1, F2, Fz channels. (B) Scalp topography of the power values at delta (0.5–4 Hz), theta (4–8 Hz), alpha (8–13 Hz), beta (13–25 Hz), and gamma (25–45 Hz) bands across the HMM states. (C) The mean and SD (frontal: black bars; posterior: white bars) of the power values at each frequency band across the HMM states. * indicates significant changes relative to S1, while # indicates significant difference between frontal and posterior regions, using linear mixed model analysis (Bonferroni corrected p < 0.05).
Fig. 4.
Fig. 4.
HMM state-specific complexity analysis. The complexity changes across the HMM states as assessed by spatiotemporal LZC (A) and its normalized measure, spatiotemporal LZCN (B, and C in the form of fold changes from the baseline-associated state S1). On each box, the central line and edges indicate the median and the interquartile range (IQR) of the values across the participants, the whiskers extend to the most extreme values, and the outliers are marked as red crosses. * indicates significant increase relative to S1, # indicates significant increase relative to S2, while y indicates significant decrease as compared to all the other states, using linear mixed model analysis (Bonferroni corrected p < 0.05, while (*) or (#) indicating uncorrected p < 0.05).
Fig. 5.
Fig. 5.
Schematic summary of the complexity dynamics during ketamine-induced alterations of consciousness. The black squares indicate the inferred HMM states, which correlated with different behavioral states under consideration. For each HMM state, the spatiotemporal complexity (averaged value of spatiotemporal LZCN across all the participants) were plotted relative to S1. The arrows in red represent the alterations from baseline (S1) to subanesthesia (S2) and then LOC following a bolus dose of ketamine (alternating between S3 and S4), whereas the progression into late anesthesia (S5) and then recovery of consciousness (S2) is indicated in blue arrows. The brain dynamics after recovery of consciousness didn’t return to baseline (S1), but shared the same dominant state (S2) with subanesthesia. This suggests that the spatiotemporal complexity associated with ketamine-induced state transitions has features of general anesthesia (S3), normal consciousness (S4, S5), and altered states of consciousness (S2).

References

    1. Abásolo D, Simons S, Morgado da Silva R, Tononi G, Vyazovskiy VV, 2015. Lempel-Ziv complexity of cortical activity during sleep and waking in rats. J. Neurophysiol 113, 2742–2752. - PMC - PubMed
    1. Akeju O, Song AH, Hamilos AE, Pavone KJ, Flores FJ, Brown EN, Purdon PL, 2016. Electroencephalogram signatures of ketamine anesthesia-induced unconsciousness. Clin. Neurophysiol 127, 2414–2422. - PMC - PubMed
    1. Berman RM, Cappiello A, Anand A, Oren DA, Heninger GR, Charney DS, Krystal JH, 2000. Antidepressant effects of ketamine in depressed patients. Biol. Psychiatry 47, 351–354. - PubMed
    1. Bishop CM, 2006. Pattern Recognition and Machine Learning (Information Science and Statistics). Springer-Verlag.
    1. Blain-Moraes S, Lee U, Ku S, Noh G, Mashour GA, 2014. Electroencephalographic effects of ketamine on power, cross-frequency coupling, and connectivity in the alpha bandwidth. Front. Syst. Neurosci 8. - PMC - PubMed

Publication types